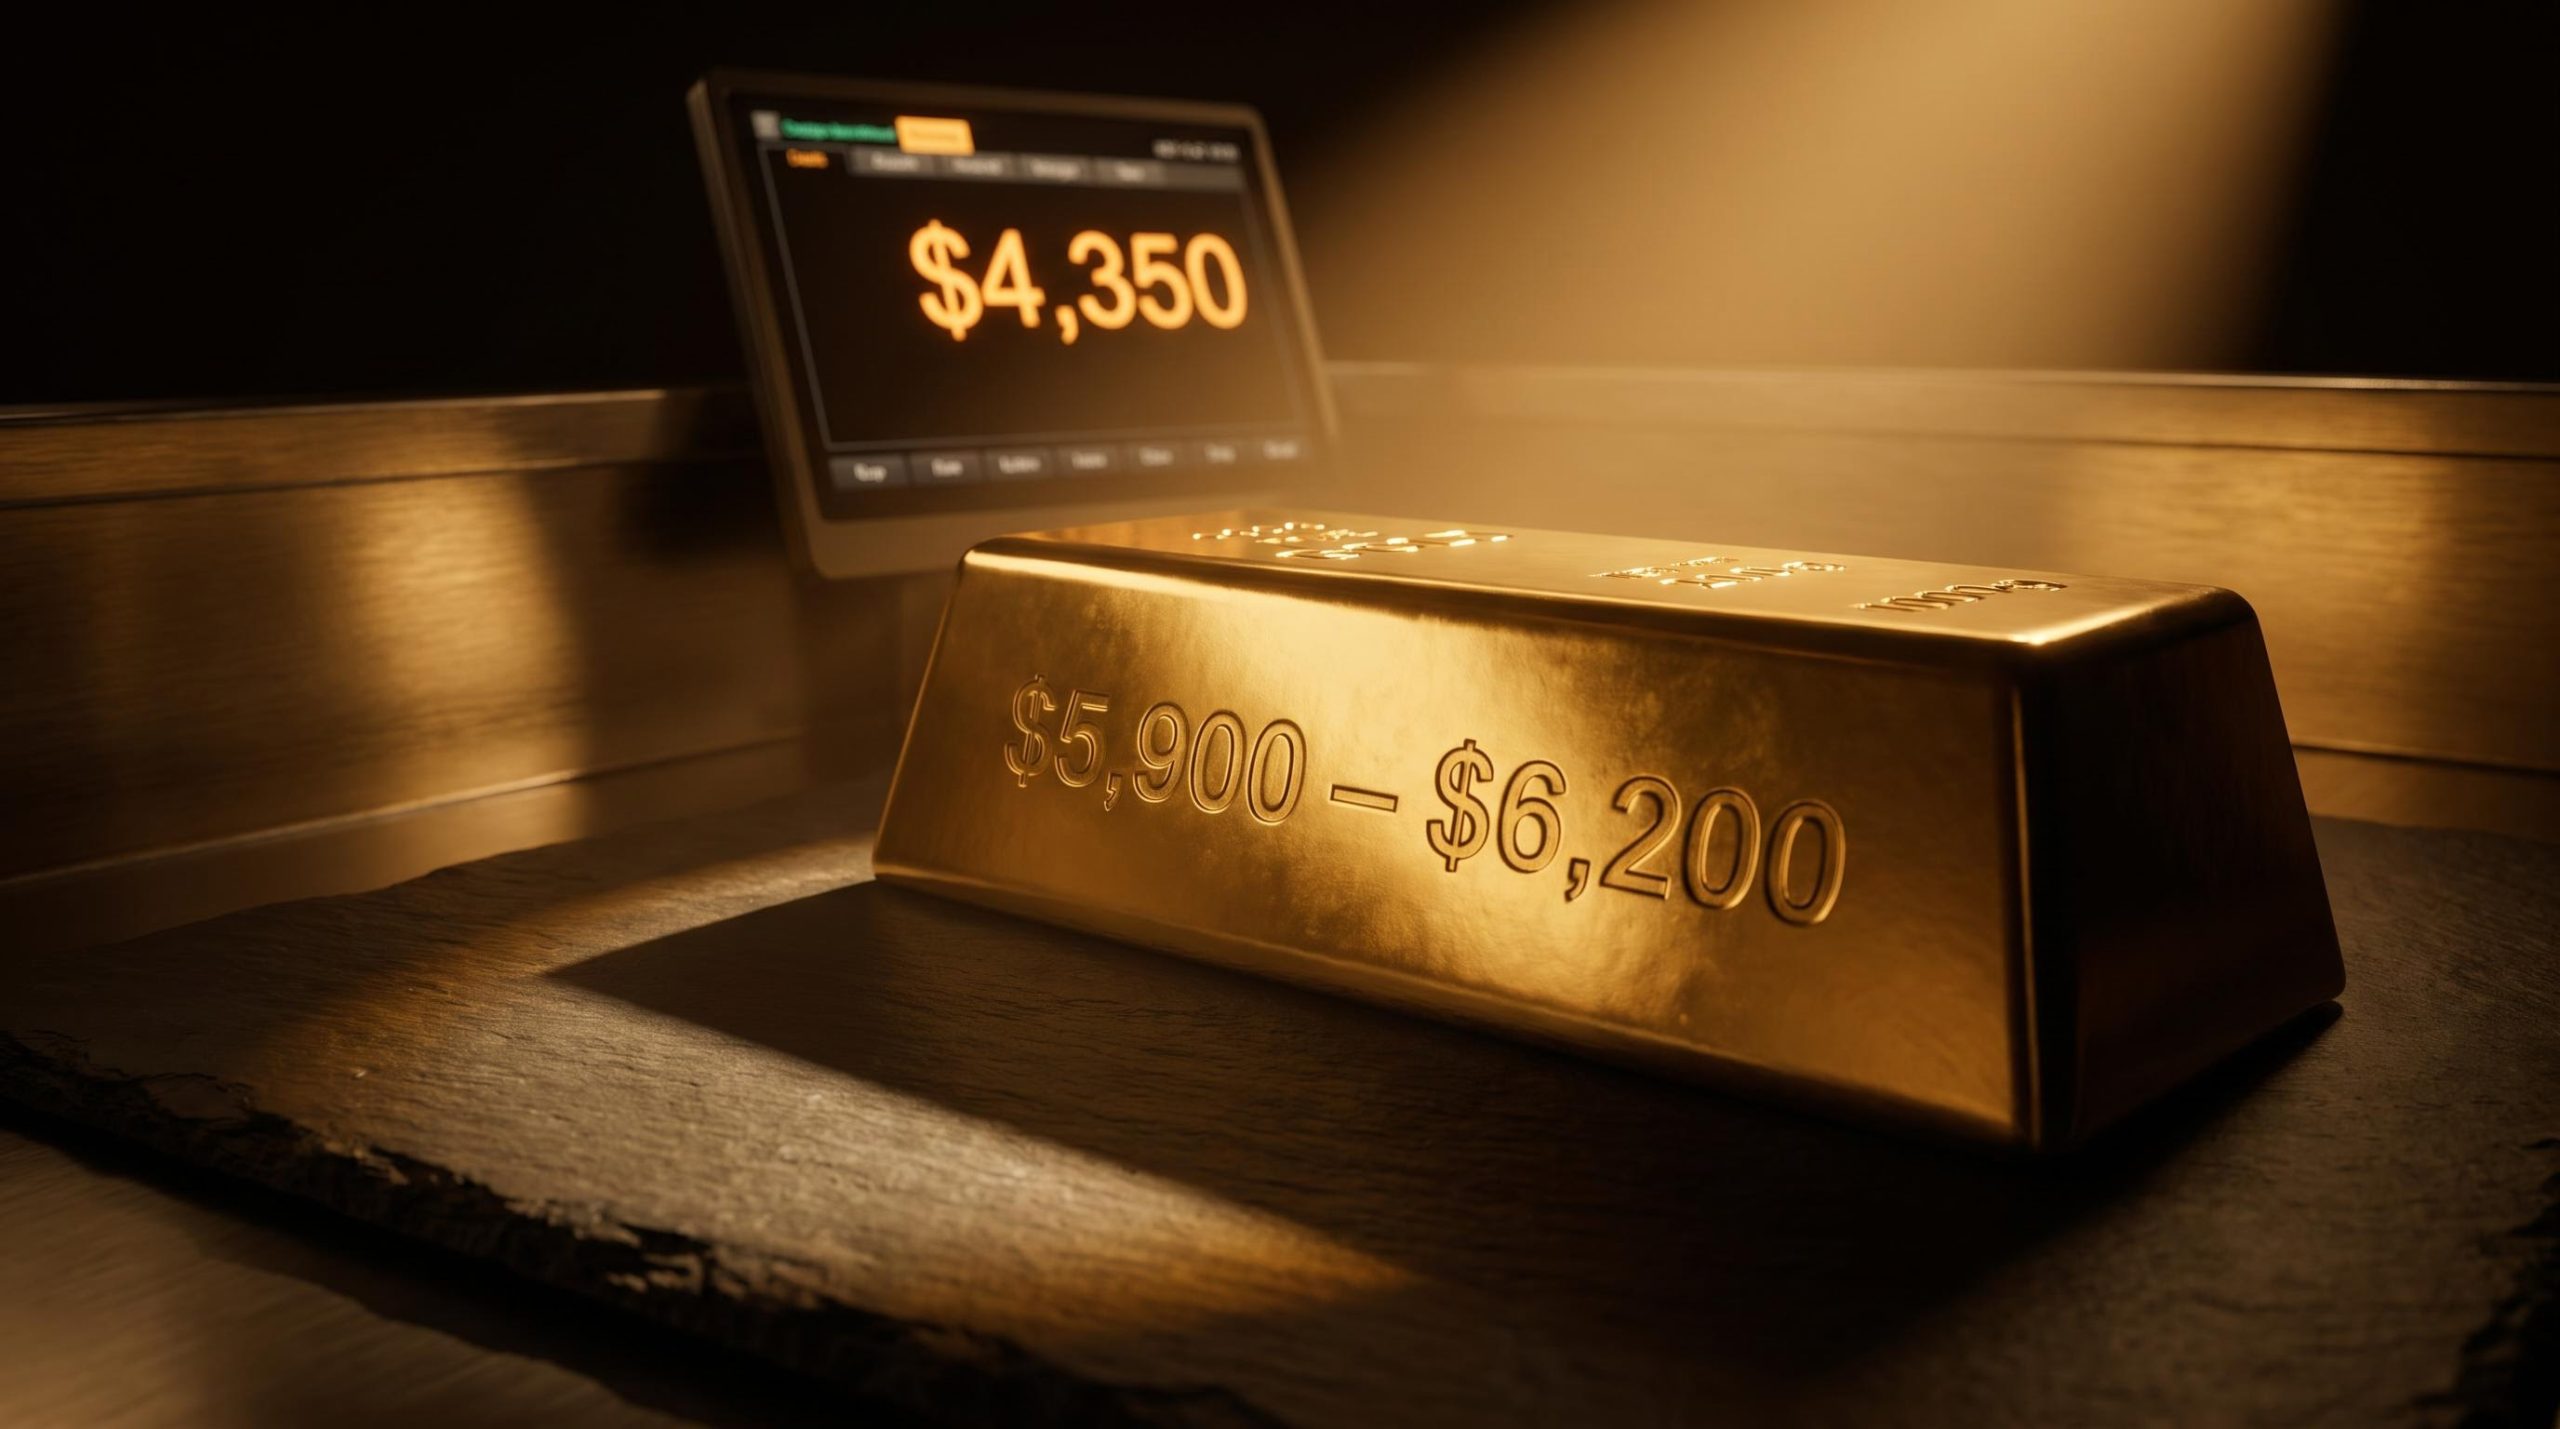
Gold is trading above $4,350 per ounce on 11 September 2026, sitting within touching distance of record highs. On the same day, one of the world’s largest wealth managers is telling clients the bigger risk from here is not that gold falls, but that it climbs higher still.
That contradiction is the entry point. A US Federal Reserve rate decision is imminent, a September hike remains a live possibility, and the outcome will push gold in one of two directions.
UBS strategist Joni Teves has mapped both paths. One is a short, contained dip. The other is a longer, stronger rally. The bank considers the second more likely.
What follows breaks down that scenario framework: the structural demand factors tilting the probability toward the upside, the historical record on gold and rate cycles, and where UBS’s view diverges from Goldman Sachs. If you are holding gold or weighing exposure before the decision lands, this is the institutional lens for thinking about the metal through year-end 2026.
Gold’s resilience after the jobs report was not an accident
There is a tempting read on gold right now that says the metal has simply stopped caring about interest rates. That read is wrong, and understanding why matters for anyone waiting on the sidelines for a post-hike bargain.
Gold held near record levels after recent US labour market data landed, trading across a $4,330 to $4,403 range on 11 September 2026. That stability was not immunity to rate moves. It was the visible result of tightening expectations already being priced in.
Here is the mechanism. As markets anticipated higher policy rates, real yields rose and the dollar strengthened ahead of the data, front-loading the pressure on gold before the jobs numbers even arrived. By the time the figures matched rather than exceeded expectations, the anticipated selloff had already largely happened.
This is a common pattern. Investors tend to over-position for hikes ahead of the event, which leaves room for relief when reality merely confirms what was already feared.
According to World Gold Council research, gold has positively surprised on hikes more than 50% of the time historically, with median one-month returns turning positive once adjusted for the long-run average.
The World Gold Council’s mid-year 2026 outlook reinforces the point, describing gold’s current price as broadly in line with a backdrop of moderate growth and further but limited central-bank tightening. In plain terms, much of the anticipated Fed path is already reflected in the number on your screen.
That changes the risk calculus. If a September hike is substantially baked in already, then waiting for a clean post-decision dip may leave you buying into a correction that never fully arrives. The stability you are seeing is not the absence of rate risk. It is rate risk that has already been absorbed.
Governor Waller’s pre-FOMC economic outlook, delivered on 3 September 2026, signalled the Fed’s internal framing of the rate decision, with Waller addressing both the growth trajectory and his own policy communication approach in terms that markets interpreted as leaving a September hike firmly on the table.
When big ASX news breaks, our subscribers know first
Three demand pillars that put a floor under any selloff
If prior pricing explains why gold held its ground, structural demand explains why UBS believes any post-hike correction would be contained rather than open-ended. The bank points to three supports, and their strength lies in the fact that they operate at once.
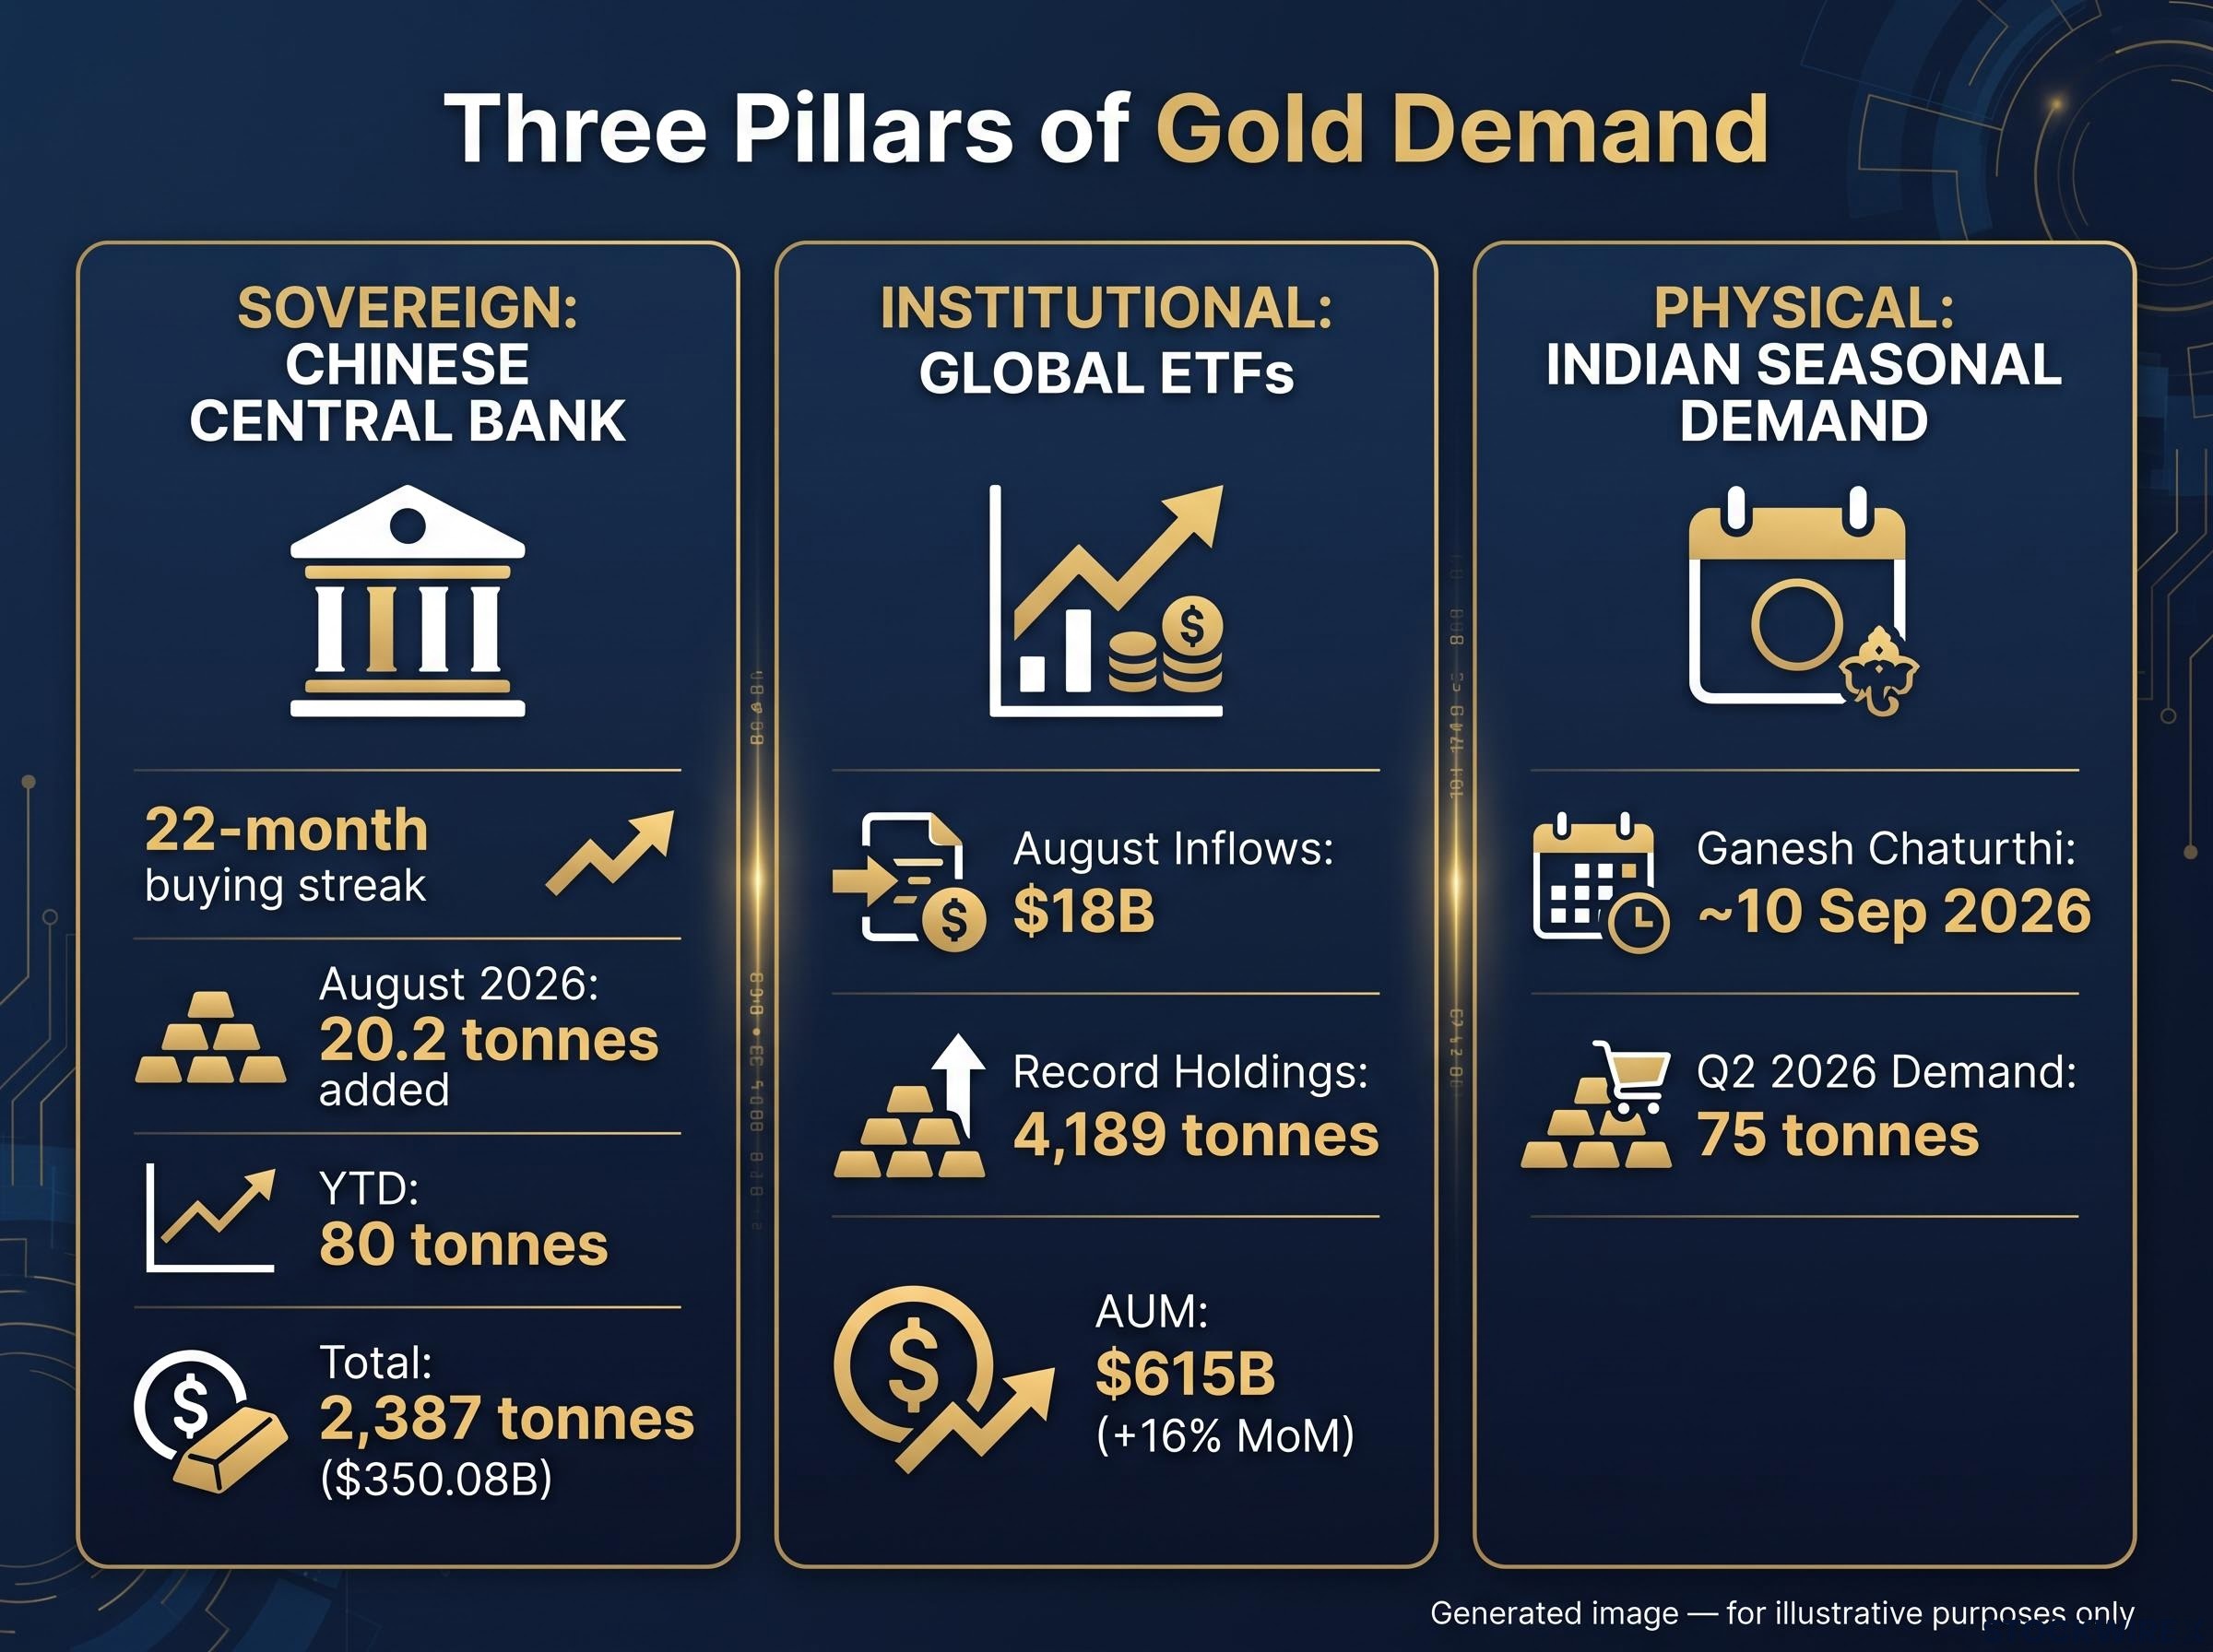
The first is Chinese central bank buying, and its most striking feature is duration. According to People’s Bank of China data, China extended its buying streak to 22 consecutive months through August 2026, with August alone adding approximately 20.2 tonnes, the largest single-month addition since late 2024. That brought estimated year-to-date purchases to roughly 80 tonnes.
China’s total reserves reached 76.73 million ounces (around 2,387 tonnes) at the end of August, with the reported value climbing to $350.08 billion. UBS described the pace as the most robust since late 2023, treating sovereign demand as a durable floor rather than a passing flourish.
The durability of central bank gold accumulation as a structural bid is reinforced by a documented shift in reserve intent: the OMFIF Global Public Investor survey, covering 90 sovereign institutions with over $7 trillion in assets, recorded the first-ever instance where more central banks declared plans to reduce dollar holdings than increase them.
| Demand driver | August 2026 data point | UBS characterisation | Outlook direction |
|---|---|---|---|
| Chinese central bank buying | ~20.2 tonnes added; 22-month streak; ~80 tonnes YTD | Most robust pace since late 2023 | Ongoing, structural |
| Global ETF holdings | $18B inflows; record 4,189 tonnes; $615B AUM | Gradually rebuilding, incremental | Directional, not exhausted |
| Indian seasonal demand | Festive season opened ~10 Sep; jewellers restocking | Near-term physical support | Non-discretionary floor |
ETF rebuilding and India’s festive season add near-term support
The second pillar is exchange-traded fund demand, and August delivered a scale that is hard to ignore. World Gold Council data show $18 billion of inflows, the second-largest monthly figure on record, lifting total holdings to a record 4,189 tonnes and pushing assets under management up 16% month-on-month to $615 billion.
What matters for the outlook is how UBS frames this. The bank treats ETF rebuilding as ongoing and incremental, not a completed trend. That distinction tells you the support is directional, with room to keep building rather than a peak already behind the market.
The third pillar is Indian seasonal demand, and its timing is the point. Ganesh Chaturthi opened India’s festive and wedding season on roughly 10 September 2026, with jewellers building inventory in advance. Q2 2026 jewellery demand ran at approximately 75 tonnes, down 6% year-on-year in volume but rising in value as prices climbed.
Wedding and festive gifting in India is considered non-discretionary, occurring regardless of price level. That the physical demand catalyst aligns almost exactly with the Fed decision window means any dip would meet buyers already in motion.
Taken together, this is what UBS means by “contained.” A Fed-driven selloff would need to overcome sovereign, institutional, and physical buyers all stepping in at lower prices. That is a materially different setup from a hike landing into a structurally weak market, and it is directly relevant to how much conviction you attach to any position heading into year-end.
What actually happened the last time the Fed hiked this fast
History offers reassurance on gold and rate hikes, but the reassurance is easy to misread. The useful lesson is not that gold tends to survive tightening. It is the single variable that decides whether it survives.
The broad record is encouraging. Across 13 Fed hiking cycles, gold rallied in nine of them, with an average gain of approximately 49%, while the four losing cycles averaged losses of around 10.5%. Two recent cycles anchor the point:
- 2004 to 2006: The Fed moved rates from 1% to 5.25%, and gold rose approximately 53% over the period.
- 2022 to 2023: The Fed delivered 525 basis points of hikes, the fastest campaign in 40 years, yet gold ended the cycle up approximately 10.2% from its pre-hike level, supported by central-bank buying that reached a modern record of 1,082 tonnes.
The 2022 to 2023 example is the more instructive of the two, because it shows gold advancing through the most aggressive tightening in a generation. The reason is where the analytical pivot sits.
World Gold Council research finds that a normal real-rate environment of 0% to 4% is not automatically adverse to gold, with the metal delivering annualised returns of 6% to 7% in such regimes.
The relationship between real yields and gold prices is the operative framework here: nominal rate moves matter far less than whether tightening drives inflation-adjusted yields sharply higher, a distinction that explains why gold advanced through the most aggressive Fed hiking cycle in four decades.
The operative variable is real rates and the dollar, not the hike headline itself. According to the World Gold Council, gold has historically struggled when tightening drives real yields sharply higher and prompts ETF outflows, not simply when nominal rates rise.
That distinction gives you a sharper filter than watching the gold price tick in the first hour after the announcement. If a September hike does not produce a sustained real-rate surge, the historical record suggests it may land far more gently than the headline implies. Watch the transmission channel, not the decision.
UBS versus Goldman Sachs: where the institutional disagreement actually sits
Two major banks look at the same gold market and reach different conclusions, but the disagreement is narrower and more locatable than a simple bulls-versus-bears framing suggests. It comes down to one variable: how durable the geopolitical risk premium is.
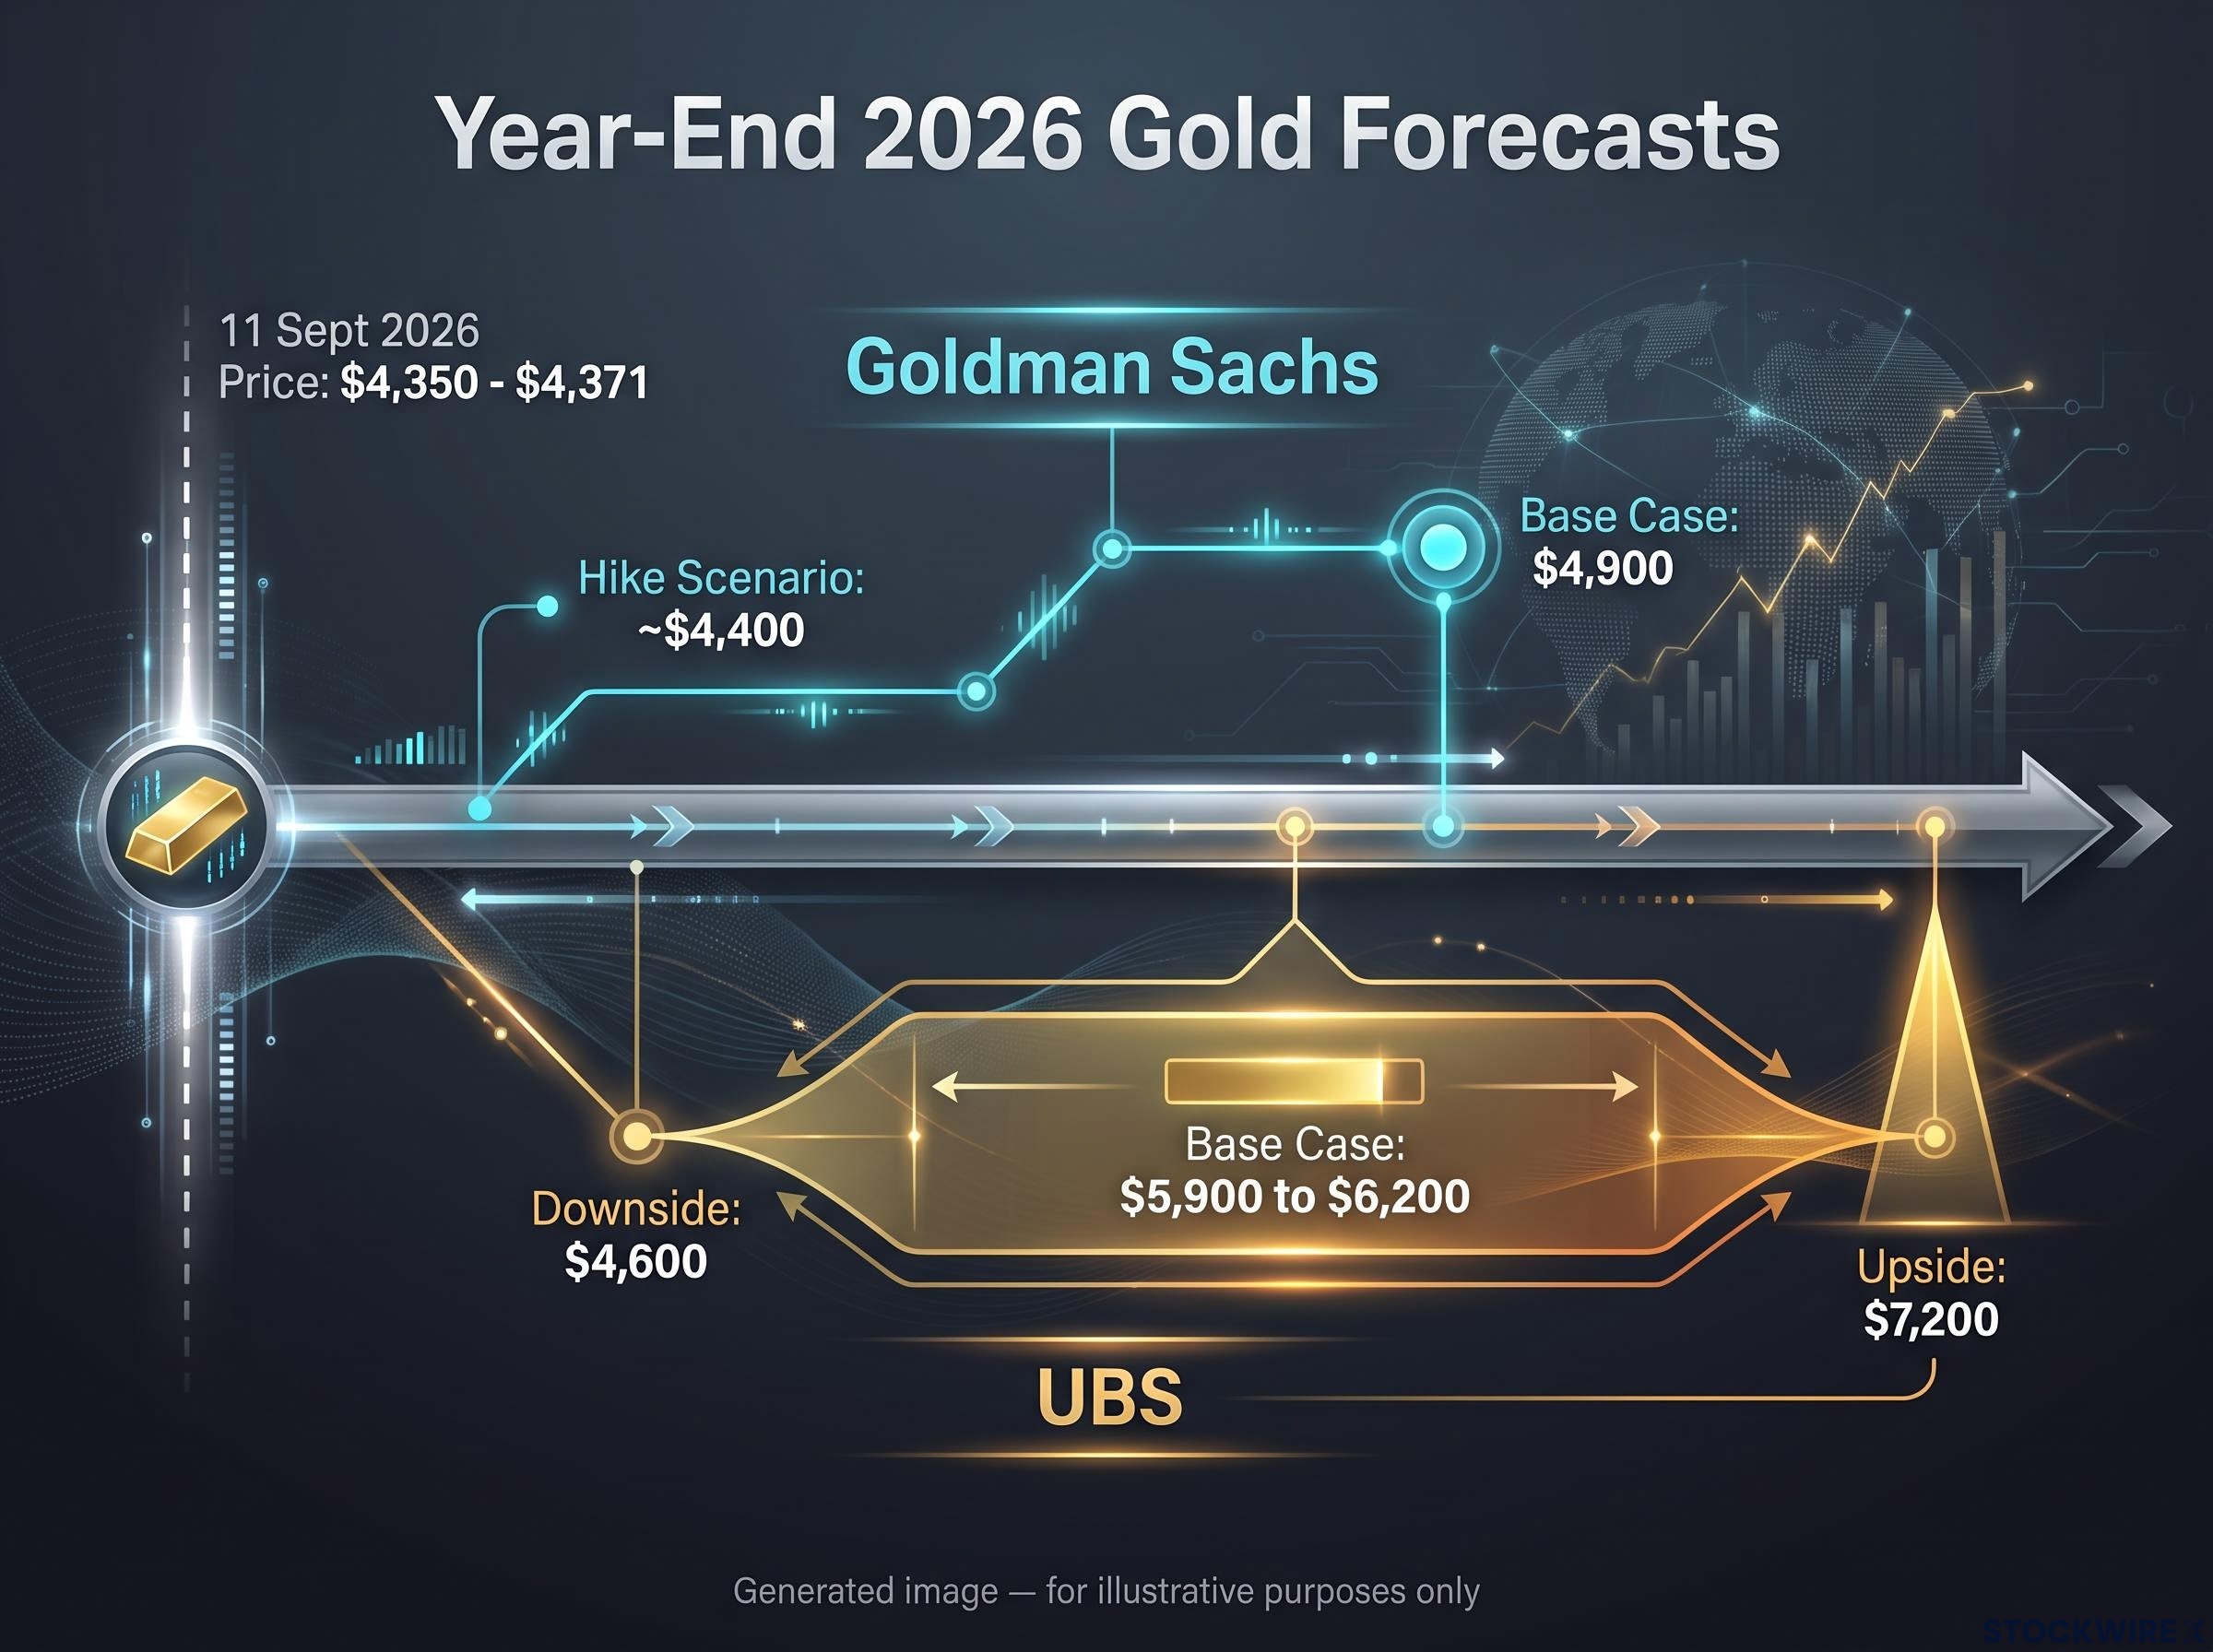
UBS holds a base-case year-end 2026 target of $5,900 to $6,200 per ounce, with a scenario range spanning $4,600 on the downside and $7,200 on the upside. The bank’s stance is structurally bullish, with risk-reward skewed toward the upside.
Goldman Sachs is more measured. In a June 2026 note it cut its year-end 2026 forecast by $500 to $4,900 per ounce, with a hike scenario pointing to roughly $4,400. Goldman remains structurally constructive but tactically cautious, projecting gold above current levels while flagging near-term downside from real rates, dollar strength, and position unwinds.
| Institution | Year-end 2026 base case | Hike scenario | Key risk identified |
|---|---|---|---|
| UBS | $5,900 to $6,200/oz | Contained, short-term dip | Hawkish policy surprise |
| Goldman Sachs | $4,900/oz | ~$4,400/oz | Geopolitical premium unwind |
| World Gold Council | Broadly fair value (no target) | Not specified | Real-rate spikes, dollar strength |
The disagreement itself is precise. Goldman’s caution centres on the risk that geopolitical risk premia, such as those tied to Hormuz-related disruptions, could fade, prompting ETF liquidation even while central-bank buying stays strong. The bank warned that demand for gold as a macro policy hedge “could unwind more persistently” under higher real rates and a stronger dollar.
UBS’s upside case assumes the opposite: that the structural demand pillars hold and the Fed’s rate path eventually pivots toward cuts.
The price context sharpens the stakes. With gold trading in the $4,350 to $4,371 range on 11 September 2026, Goldman’s base case sits only around 12% to 15% above current levels, while UBS’s base case implies 35% to 42% upside. The gap between them is not a reason for paralysis. It is a map of what to monitor, with geopolitical premium durability and the trajectory of real rates as the two decisive inputs.
The divergence between UBS and Goldman is sharpened by the gold price prediction for 2026 from the World Bank, which anchors the most conservative major institutional forecast at approximately $4,700 per ounce for the full year, providing a useful floor reference when the range between banks spans more than $2,000.
What the risk-reward map tells you before the Fed decides
Strip the analysis back to a decision, and the question is not whether gold rises or falls. It is whether the downside is bounded enough to justify holding through the noise.
UBS’s two-sided scenario frames it cleanly. A September hike triggers a contained, short-term correction that structural buyers absorb at lower prices. A hold shifts market pricing away from further hikes and toward eventual cuts, unlocking renewed investment demand and a stronger rally.
The bank flags one additional upside trigger: if a hold renewed concerns about the Fed’s operational independence, investors would likely bid the metal higher still.
For anyone positioned in gold, three variables are worth tracking closely once the decision lands:
- Real US Treasury yields. This is the operative transmission channel. A sustained real-rate surge is the historical condition under which gold struggles.
- The dollar’s response. A sharp dollar rally amplifies pressure; a muted move suggests the hike is being absorbed.
- ETF flow direction. Continued inflows confirm the demand thesis holds; a reversal would validate Goldman’s caution.
The core of the UBS case is not a directional bet on the Fed. It is asymmetry. The floor beneath gold is thick enough, through sovereign, institutional, and physical demand, that the downside scenario is bounded, while the upside has multiple reinforcing catalysts operating at once. UBS describes the risk-reward as weighted toward the upside, with gold increasingly responsive to positive catalysts.
That reframes the decision facing you. The question is not “up or down.” It is whether the downside is limited enough to justify staying long through the volatility rather than waiting for a clarity that may arrive only after the move has already happened.
For investors wanting to stress-test the UBS framework before positioning, our full explainer on why gold price rules fail examines three documented rate cycles where gold outcomes directly contradicted the most widely cited trading signals, including the 2022–2023 period where all theoretically gold-positive conditions were present and gold still fell 20%.
This article is for informational purposes only and should not be considered financial advice. Investors should conduct their own research and consult with financial professionals before making investment decisions. Past performance does not guarantee future results. Financial projections are subject to market conditions and various risk factors, and forward-looking scenarios are speculative and subject to change based on market developments.