Gold is trading above $4,400 per ounce, and the most common explanation you will hear is that investors are protecting themselves against inflation. The bond market disagrees.
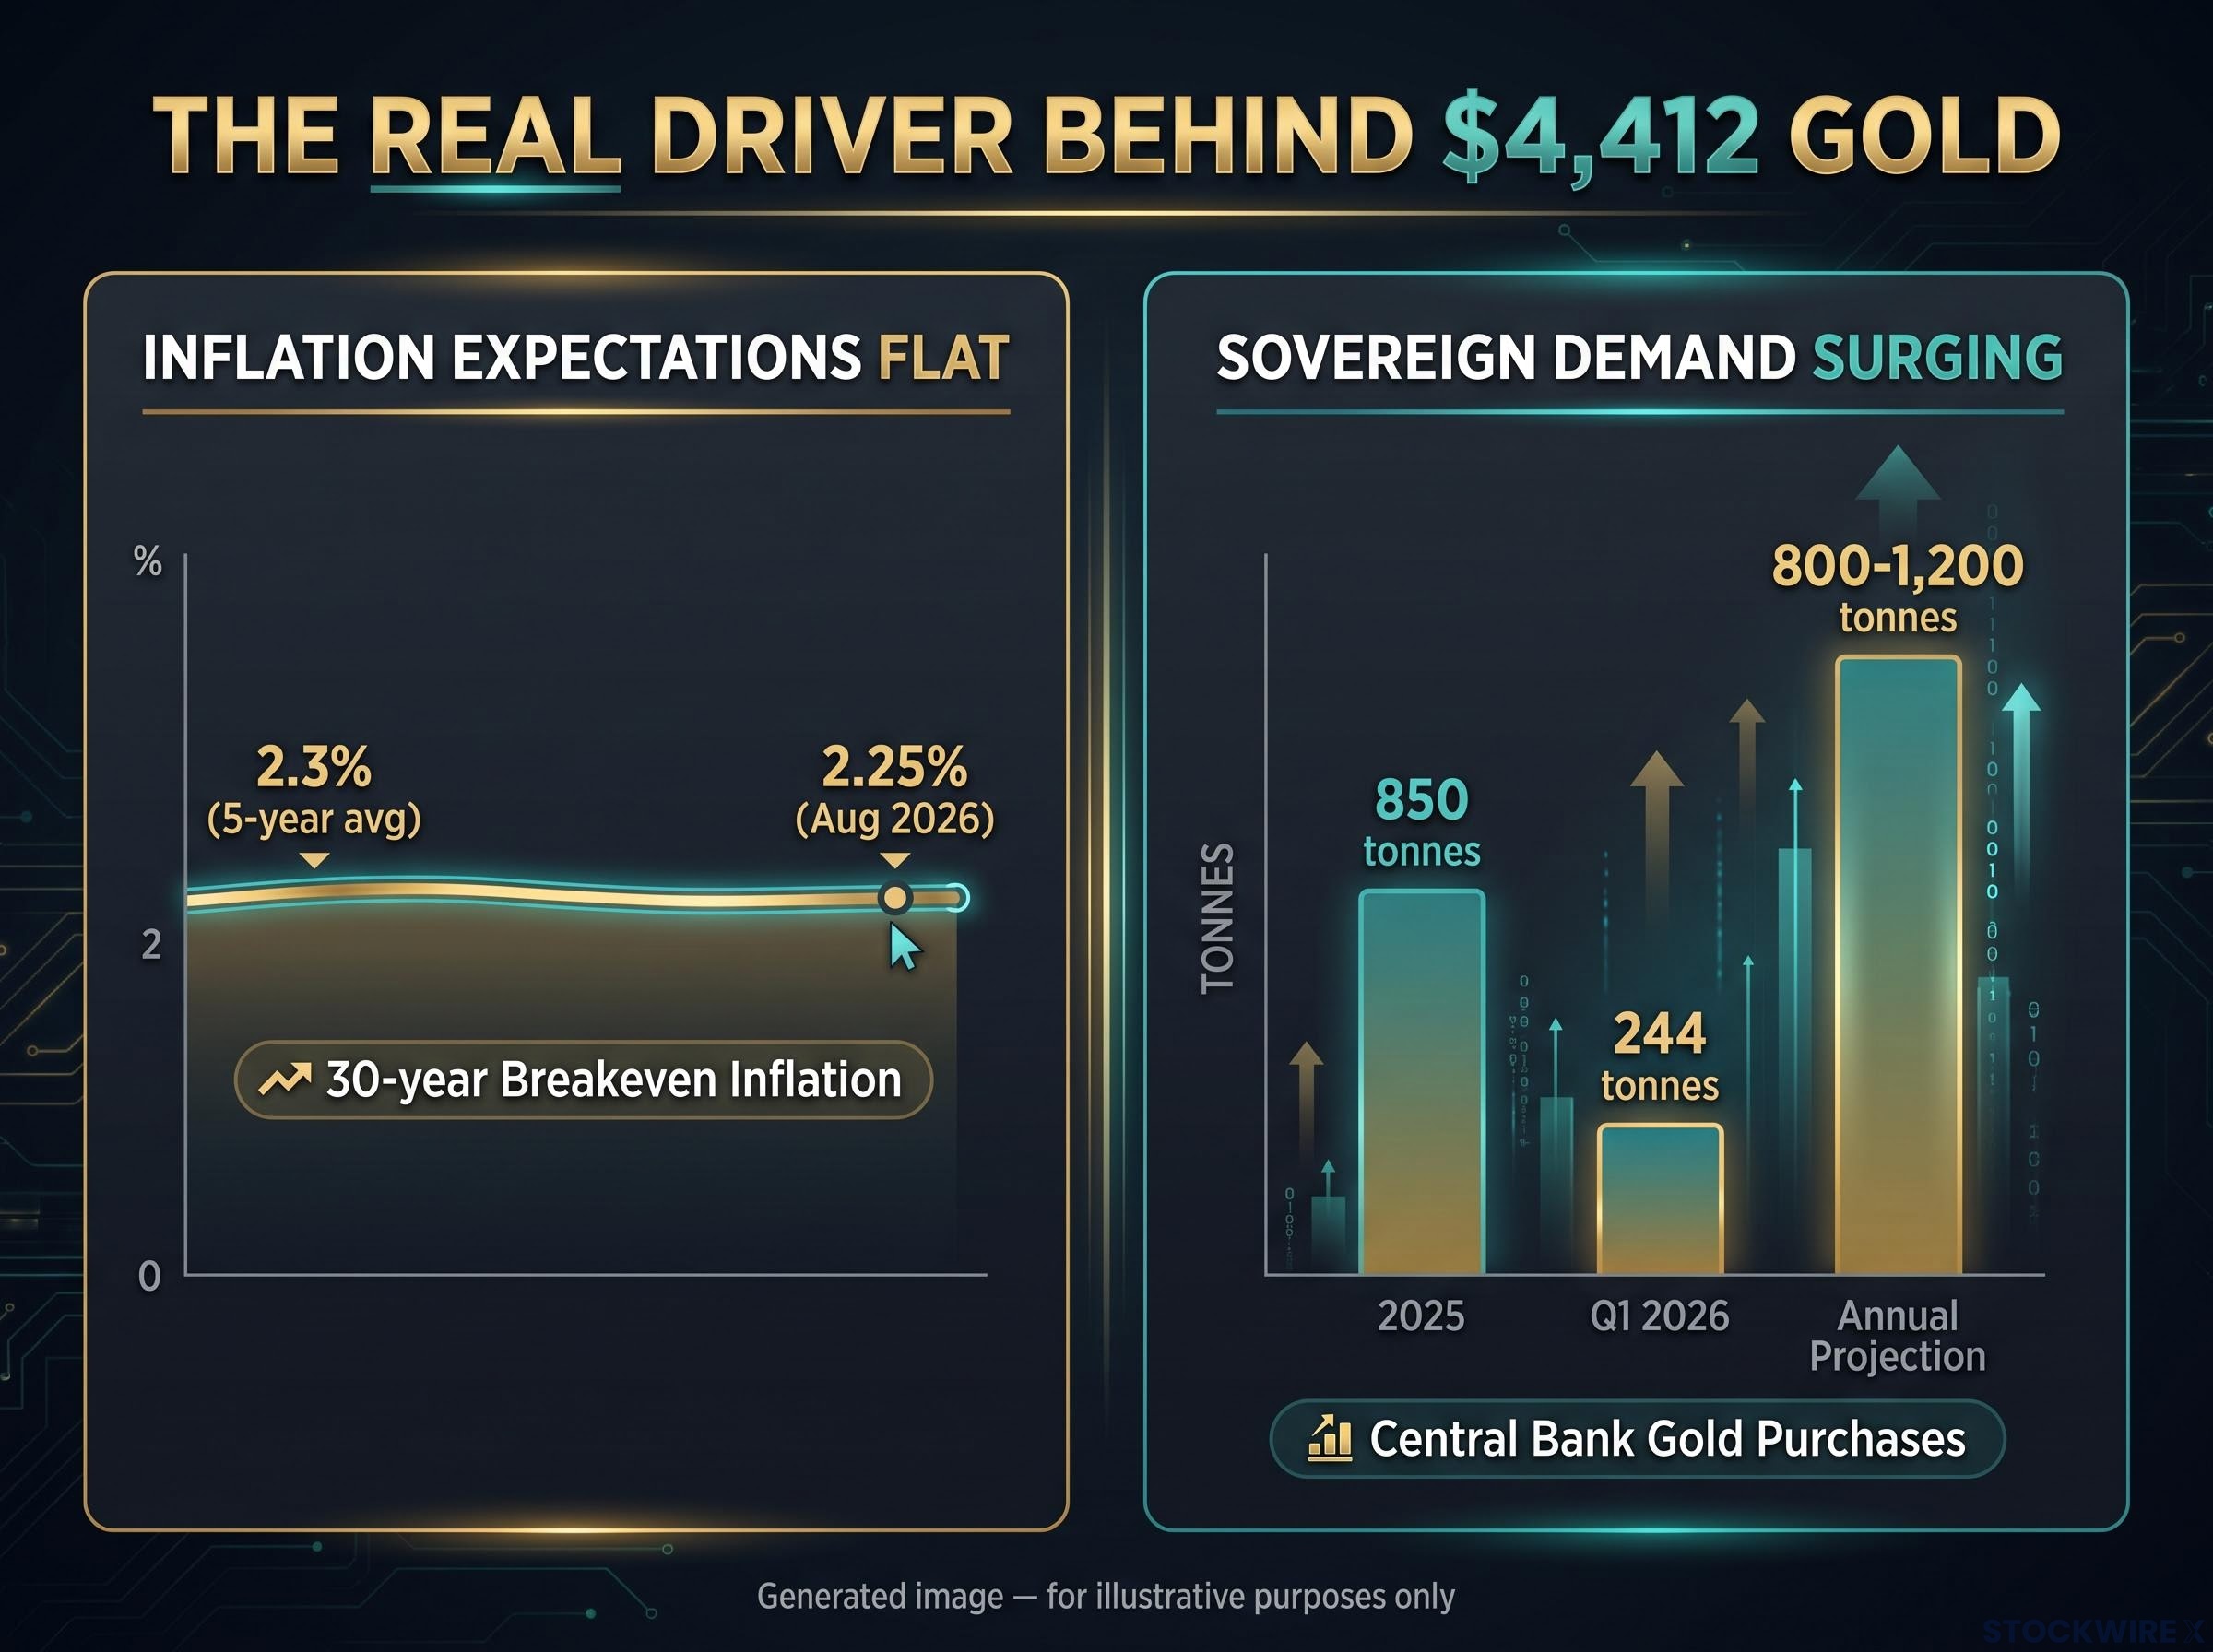
The 30-year breakeven inflation rate sat at 2.25% in August 2026, essentially unchanged over the past five years. If the market genuinely believed the dollar was being debased or that inflation was about to run structurally hot, that number would not be 2.25%. It would be moving.
The fact that it is not tells you something important about what gold’s rally actually reflects, and what it does not. What follows here gives you the analytical tools to separate the gold rally’s real drivers from the inflation-hedge story, and to weigh whether TIPS, currently priced at multi-decade high real yields, are the more precise instrument for the specific risk you are trying to manage.
What the bond market says about gold’s rally
The retail assumption running through the current gold rally is simple: gold rises when inflation rises, so record gold prices must mean the market fears inflation. That assumption is the one being tested here, and the bond market provides the cleanest place to test it.
Start with how a nominal Treasury yield breaks down. A nominal yield is made of two parts: the real yield (the return above inflation) and the market’s inflation expectation (the breakeven rate). This is standard bond decomposition using the Fisher equation framework, not speculation.
Recent increases in nominal yields have come almost entirely through the real yield component. The inflation expectation portion, the breakeven, has barely moved.
The FRED 30-year breakeven inflation series shows that this measure has held in a narrow band around 2.3% since 2021, a degree of stability that sits in direct tension with gold’s concurrent 60%-plus appreciation and makes the inflation-hedge narrative increasingly difficult to sustain.
Why rising nominal yields haven’t moved breakevens
If investors genuinely anticipated imminent currency debasement or a structural inflation break higher, breakevens would have climbed alongside gold. They have not. The 30-year breakeven sat at 2.25% as of August 2026, and it has averaged roughly 2.3% over the past five years through September 2026.
The 30-year breakeven has held near a 2.3% five-year average through September 2026. That is stability, not compression, and it makes gold’s move even harder to explain through inflation expectations.
This is where the contradiction becomes hard to ignore. Spot gold traded around $4,412 per troy ounce in early September 2026, after appreciating more than 60% in 2025 alone. Meanwhile the market’s long-run inflation view sat flat.
The most direct evidence sits in the performance gap itself. According to Convex Trading data, gold has outperformed TIPS by roughly 180 percentage points cumulatively since 2022.
That gap is the signal. If you are holding gold as protection against official US inflation, this is the number to sit with. A 180-point divergence from an inflation-linked bond is not what an inflation hedge looks like; it is evidence that gold is doing a different job entirely, and that buying it as a CPI hedge means buying the wrong instrument for the task.
When big ASX news breaks, our subscribers know first
The actual drivers behind gold at $4,400
If inflation expectations are not moving gold, something else is. Three structural forces explain the rally, and they assemble into a coherent thesis when taken in order of explanatory power:
- Central-bank demand and reserve diversification: sovereign buyers accumulating gold with little sensitivity to price.
- Geopolitical and de-dollarization risk: gold as a hedge against monetary regime uncertainty.
- Momentum and ETF flows: trend-following behaviour amplifying the move.
Central-bank demand sits at the top for a reason. The World Gold Council reported net central-bank purchases of 244 tonnes in Q1 2026, following approximately 850 tonnes in 2025, with projected annual purchases running in the 800-1,200 tonne range.
What matters is not just the volume but the behaviour behind it. Sovereign buyers are largely price-insensitive; they buy to diversify reserves, not to time a bottom. Conventional supply-and-demand logic, which assumes buyers pull back as prices climb, does not fully capture a purchaser that keeps buying regardless.
The OMFIF Global Public Investor survey released 30 June 2026 marked the first time on record that net dollar-reduction intent crossed into majority territory, providing the institutional backdrop for the reserve diversification argument that sovereign gold buying is structural rather than cyclical.
That price-insensitive demand tells you what gold’s price is actually reflecting. It is registering geopolitical hedging and reserve diversification by governments, not a forecast about where US consumer prices are heading.
The second driver is regime risk. Persistent trade friction and volatile global markets have pushed gold’s safe-haven appeal higher, but the risk being hedged is confidence in the monetary system itself, not domestic CPI.
The third driver is behavioural. Morningstar analysis suggests that investor momentum and trend-following, rather than deliberate inflation-hedging calculations, have heavily influenced gold’s appreciation. Money follows performance, and performance has been extraordinary.
The historical record reinforces the point.
World Gold Council research finds that gold’s relationship with CPI has been inconsistent and statistically insignificant since 1971.
Consider the 2001 to 2011 window: average US inflation was only 2.4%, yet gold rose by roughly 650%. Understanding why gold is rallying lets you assess whether those drivers apply to you. Sovereign de-dollarization and geopolitical hedging are legitimate risks, but they are different risks from CPI running at 4%, and they call for a different instrument.
Why TIPS are priced to do what gold only promises
Treasury Inflation-Protected Securities (TIPS) are US government bonds whose principal value adjusts with the Consumer Price Index (CPI). When official inflation rises, the bond’s principal rises with it, and the interest is paid on that adjusted principal. You are not hoping the security correlates with inflation through sentiment; the link is written into the mechanics.
That mechanical link is the first reason TIPS deserve a look right now. The second is valuation. The 30-year TIPS real yield sat near 3.05% (quoted at 3.047% on 10 September 2026), and 5-year TIPS real yields above 2% sit in roughly the 11th percentile historically. In plain terms, real yields this high are unusual; investors have rarely been paid this much above inflation to hold these bonds.
The shift in the real yield hurdle rate under Chair Warsh has recalibrated the opportunity cost across every asset class, and it is precisely this elevated real-rate environment that makes a 30-year TIPS offering above 3% real yield so structurally unusual relative to the post-2008 baseline.
The scenario math is where the case sharpens. With a 30-year real yield near 3.05% and breakevens at 2.25%, if actual inflation averages 3%, the nominal return approaches 6% annually. That requires no heroic inflation assumption; it only requires inflation to run modestly above the level the market has already priced.
Here is how the current curve looks against a 3% CPI outcome.
| Maturity | Real Yield | Breakeven Rate | Nominal Return if CPI Averages 3% |
|---|---|---|---|
| 5-year | ~2.01% | ~2.25% | ~5.0% |
| 10-year | ~2.31% | ~2.25% | ~5.3% |
| 30-year | ~3.05% | 2.25% | ~6.0% |
The 5-year, 10-year and 30-year real yields in the table reflect the mid-July 2026 curve snapshot alongside the September 30-year reading, with breakevens and outcomes shown for illustration.
Now place that against what inflation is actually doing. At the 2026 Jackson Hole conference, Chair Warsh cited the Fed’s preferred PCE measure at 3.7% year-on-year, with a six-month pace of 4.1%. Governor Jefferson reported core PCE near 3.0%. Federal Reserve Governor Waller has noted that inflation has exceeded the 2% goal for more than five and a half years.
This is the crux. With breakevens at 2.25% and actual PCE running between 3% and 4%, the market is effectively pricing inflation returning to target faster than the Fed’s own recent data supports. TIPS investors are being paid to take the other side of a consensus the Fed itself has not validated.
For a reader who genuinely believes inflation will hold above 2.25% over multiple years, TIPS at these real yields offer a direct, mathematically precise hedge at historically attractive prices. This is the specific instrument for the specific risk.
What can go wrong with TIPS
The case is strong, not flawless. Three risks deserve attention before you act:
- Liquidity premium: TIPS trade at a slight yield penalty relative to nominal Treasuries because the market is smaller and structurally more complex, so you give up a little yield for the inflation protection.
- Phantom income tax: in a taxable account, the CPI-linked principal increase is taxable each year before you receive it at maturity, creating a cash-flow drag.
- CPI mismatch: TIPS hedge official CPI, not your personal inflation rate or broader monetary instability. That gap between official CPI and systemic monetary risk is precisely the space gold tries to fill.
When gold still earns its place and when it does not
Gold and TIPS are not competing for the same job. History makes that clear once you look at how each has behaved across different regimes.
Immediately after the Global Financial Crisis, in a disinflationary quantitative easing era, TIPS delivered strong real returns while gold lagged. Over the 2005 to 2020 window, the two produced nearly identical performance. Gold’s standout episodes came elsewhere.
The late 1970s is the reference case. Gold rose from roughly $100 per ounce in 1976 to $850 by January 1980, driven by a genuine loss of confidence in monetary policy rather than a specific CPI print. Over the 1974 to 2009 period, gold produced an annualised real return of 5.9% against 3.7% for TIPS.
The table below maps the instruments to the regime that favours each.
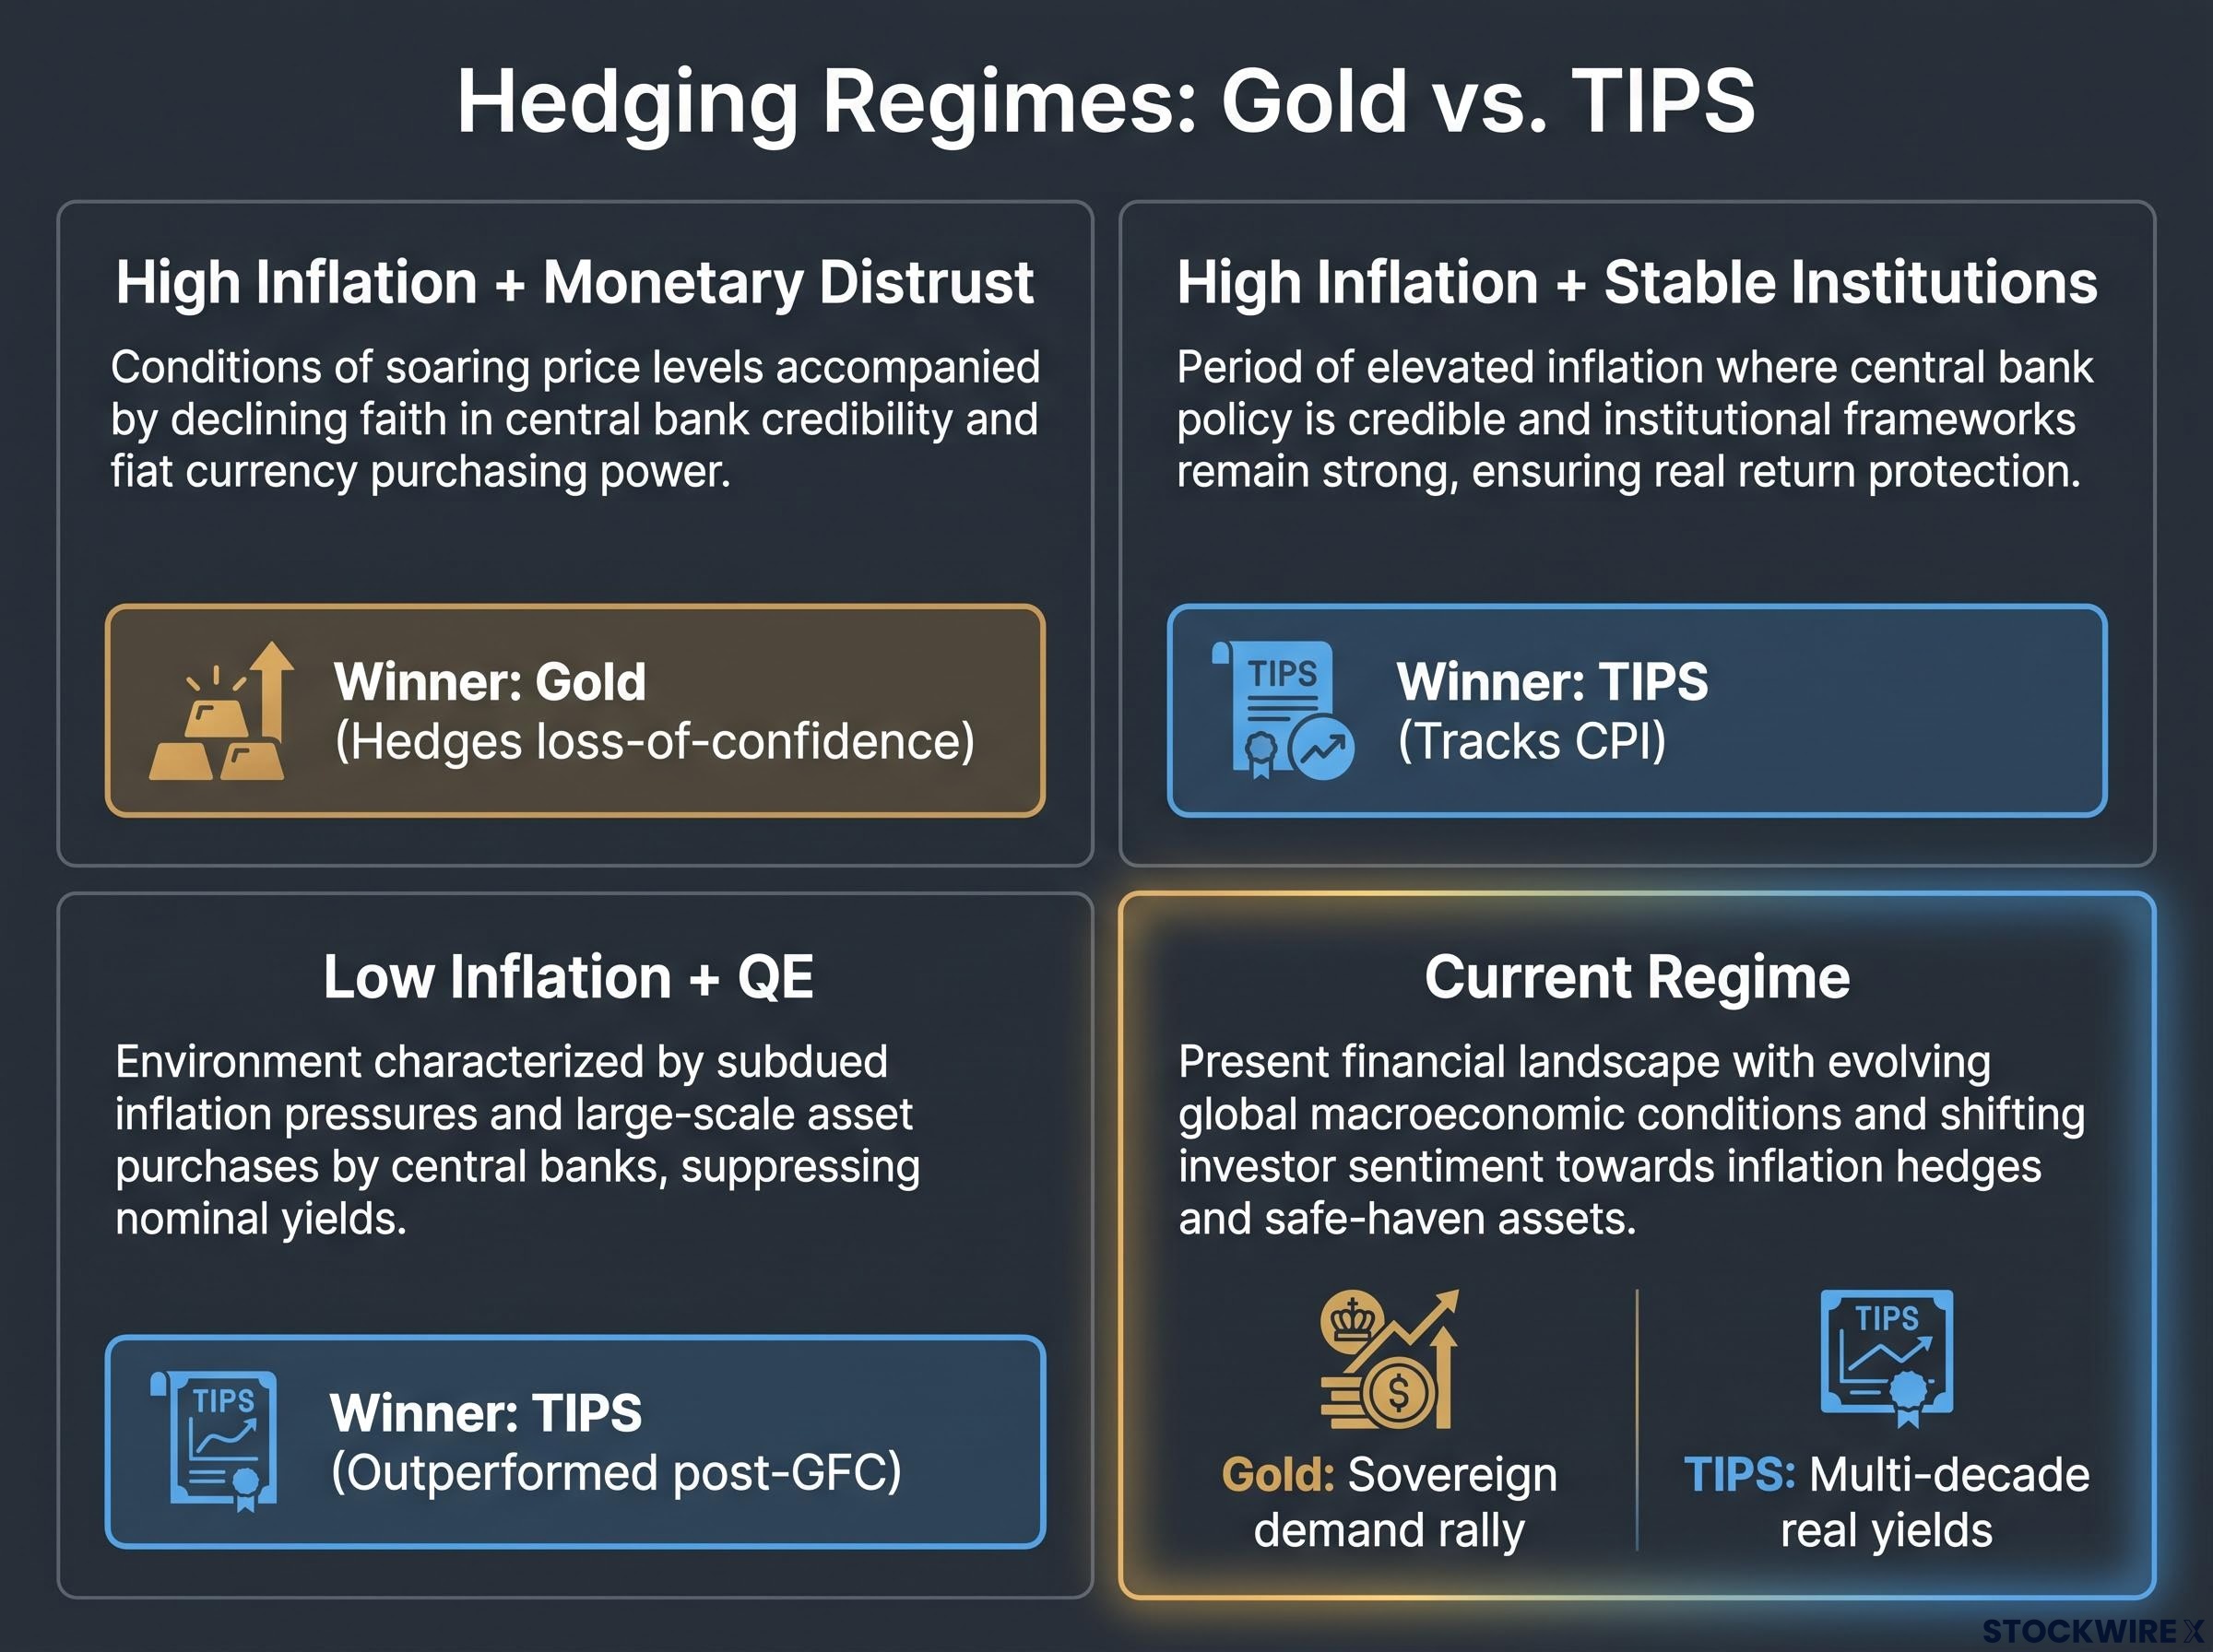
| Regime Type | Gold Performance | TIPS Performance | Reader Implication |
|---|---|---|---|
| High inflation plus monetary distrust | Strong | Solid but capped at CPI | Gold hedges the loss-of-confidence risk |
| High inflation plus stable institutions | Inconsistent | Strong, tracks CPI directly | TIPS hedge the CPI risk precisely |
| Low inflation plus QE | Lagged post-GFC | Outperformed with real returns | TIPS the better fit |
| Current: anchored breakevens, elevated PCE | Rallying on sovereign demand | Priced at multi-decade real yields | Depends which risk you are pricing |
The pattern is consistent with World Gold Council research showing gold’s CPI correlation has been statistically insignificant since 1971. Gold’s strongest runs have coincided with distrust of the monetary system itself, not with high CPI readings. If that is the risk you are hedging, gold’s role is legitimate. If you are hedging the risk that CPI averages 3.5% over the next decade, TIPS do that job more precisely and more cheaply at current prices.
The financial repression trade
There is a way to capture the scenario many gold buyers fear without touching a commodity. In financial repression, governments suppress nominal yields while allowing inflation to run hot.
A long TIPS and short nominal Treasuries position hedges exactly that. Held to maturity, it delivers a return roughly equal to realised inflation over the period minus the breakeven rate at purchase, which makes the math transparent and the exposure a pure fixed-income structure.
The Treasury’s August 2026 expansion of long-end buyback capacity to at least $4 billion per operation has been interpreted by several analysts as financial repression by institutional design, deliberately suppressing borrowing costs in a way that structurally benefits hard assets and gives the TIPS-versus-gold debate an additional dimension beyond nominal yield levels.
Naming your risk before picking your hedge
The question most investors ask is “gold or TIPS.” The better question is “what specific risk am I trying to hedge.” That reframing is what separates deliberate portfolio construction from momentum-driven allocation.
The evidence points in one direction on the CPI question. Breakevens have held near 2.25% for five years, actual PCE is running between 3.0% and 4.1%, and 30-year TIPS real yields near 3.05% place investors in the top quartile of real yield opportunity of the post-2000 era. Gold, meanwhile, is being driven by sovereign demand and regime uncertainty, not by a domestic inflation signal. New York Fed President John Williams projects overall inflation around 2.5% in 2026, still above the breakeven.
Federal Reserve Governor Waller has observed that inflation has exceeded the 2% goal for more than five and a half years, which establishes the current setup as persistent rather than transitory.
That persistence is what makes the entry point defensible. Every month that actual PCE runs above 2.25% is a month in which an investor who bought 30-year TIPS at today’s prices earns more than the market consensus assumed at purchase. For the explicit CPI hedger, that asymmetry is what gold at $4,400 does not offer.
The takeaway is a decision structure you can apply immediately: name the risk you believe is underpriced, match the instrument that hedges it directly, then check whether current pricing rewards you for the trade. That framework outlasts any single market call.
For readers wanting to map the TIPS and gold positioning frameworks onto a broader portfolio context, our comprehensive walkthrough of US debt scenarios examines how a soft landing, stagflationary trap, and debt monetisation each produce different winners and losers across stocks, bonds, and gold allocations.
This article is for informational purposes only and should not be considered financial advice. Investors should conduct their own research and consult with financial professionals before making investment decisions. Past performance does not guarantee future results. Financial projections are subject to market conditions and various risk factors, and scenario returns cited here are illustrative rather than assured.