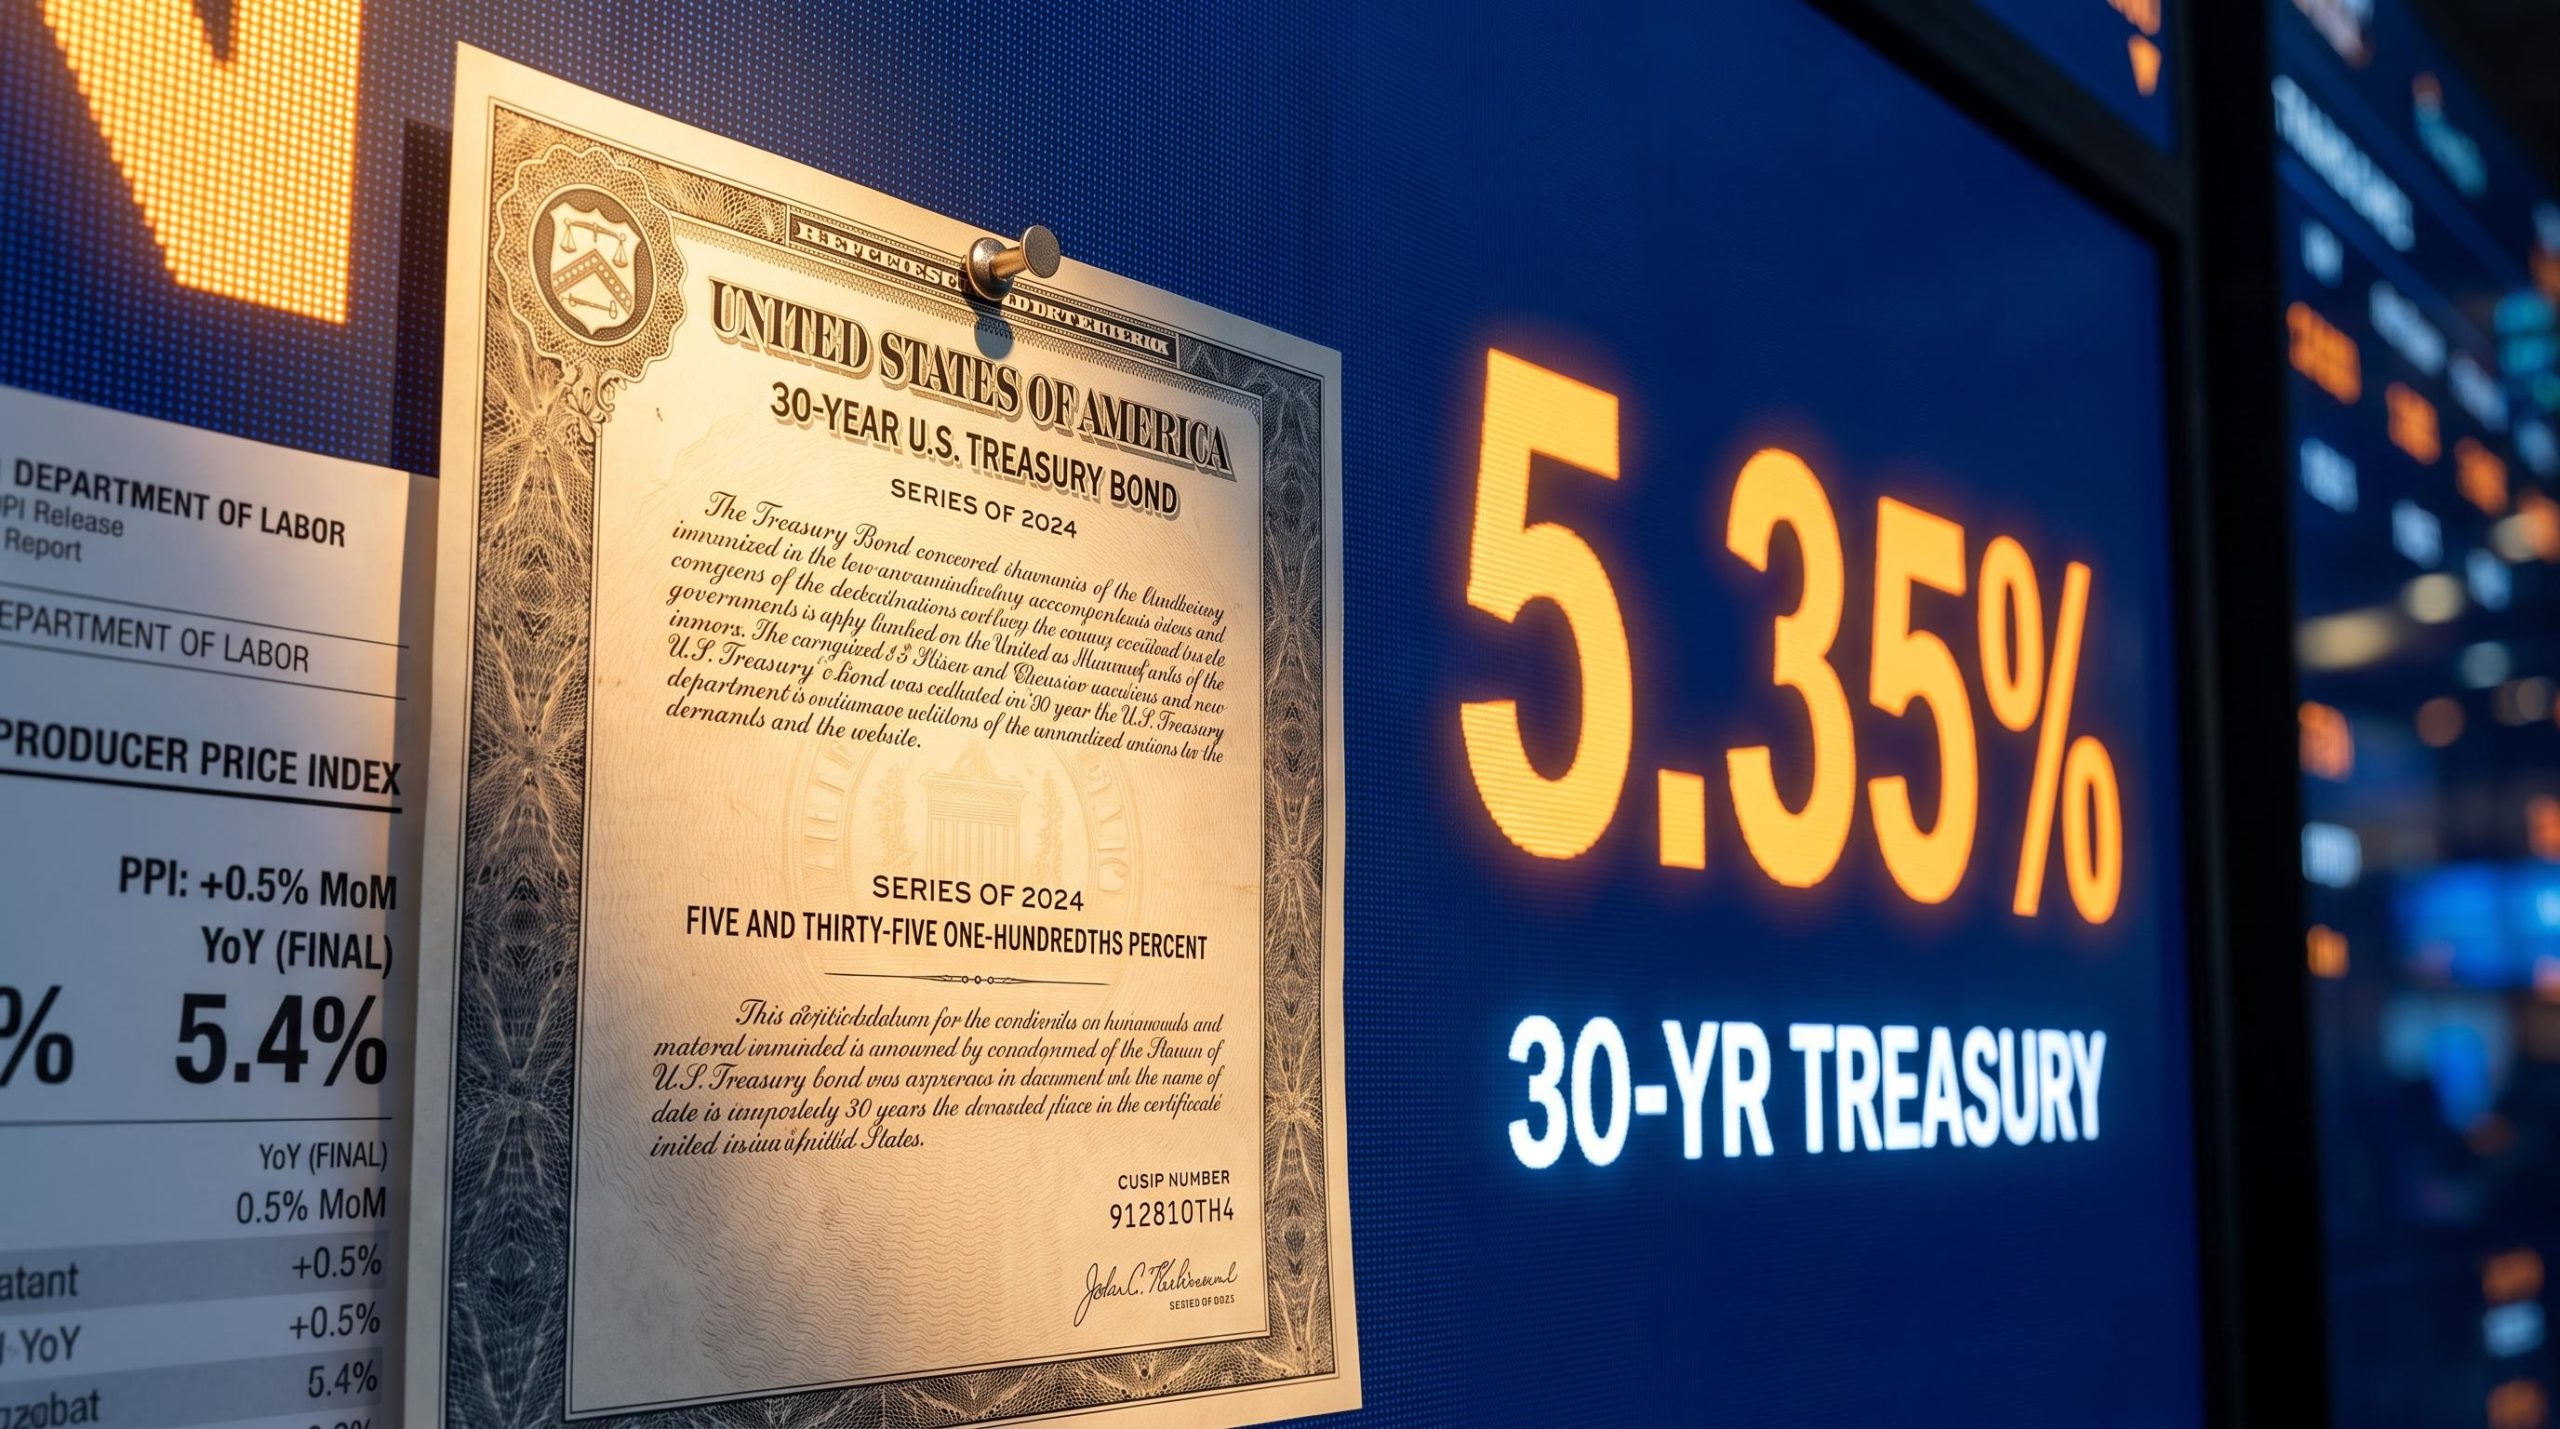
A 5.4% wholesale inflation print landed on 10 September 2026. Within hours, futures markets had flipped past 70% odds of a rate hike six days out. Long-term Treasury yields punched to levels not seen in a generation.
For most of this year, the Federal Reserve had been the outlier, holding rates steady while central banks elsewhere tightened. That posture is now under direct pressure from the Fed’s own inflation pipeline data. If you assumed the hiking cycle was safely behind you, this week is evidence it may not be.
Here is what the Producer Price Index number actually means, why the bond market is behaving the way it is, and what a surprise no-hike outcome could do to your portfolio ahead of the 16 September meeting.
Why the August PPI number hit markets so hard
Before inflation shows up in the price of your groceries or your rent, it shows up in what businesses pay to make and move things. That is what the Producer Price Index (PPI) captures.
The PPI is a wholesale inflation gauge. It sits upstream of the Consumer Price Index (CPI), the official measure of what households actually pay, which makes it a leading signal for where consumer inflation is heading next.
Here is why bond traders watch it so closely:
- It measures price changes at the wholesale level, before costs reach the consumer.
- It differs from CPI by focusing on producers and the supply chain rather than end buyers.
- Because businesses pass higher input costs downstream, a hot PPI raises the odds that consumer inflation stays elevated.
The timing this week sharpened the signal. The August 2026 release from the Bureau of Labor Statistics landed on 10 September, one day ahead of the CPI print, in a week where every inflation data point is being read as a vote for or against a hike.
The number that moved markets Wholesale inflation re-accelerated to 5.4% year-over-year in August, up 0.4% on the month. The story is not the level. The story is the direction.
What re-acceleration actually signals
A single high reading is one thing. A trend reversal is another, and August fits the second description.
According to the Bureau of Labor Statistics, final demand prices rose 0.1% in July and fell 0.1% in June, figures that pointed toward cooling. Core PPI, which strips out food and energy, ran at 4.6% year-over-year and 0.2% month-over-month in August. The month-over-month jump to 0.4% in headline PPI broke that softening pattern.
That distinction matters to you as an investor. A high-but-stable reading suggests inflation is plateauing. A re-acceleration suggests the problem has not resolved itself, which hands the Fed fresh justification to act. That is precisely what futures markets priced in within hours of the release.
The June 2026 data offered the opposite picture: wholesale price signals pointed toward disinflation, with headline PPI falling 0.3% month-over-month, yet core held at 4.7% year-over-year, a divergence that illustrated how energy-driven monthly swings can mask structural inflation pressure still running well above target.
When big ASX news breaks, our subscribers know first
How Treasury yields reflect the market’s rate expectations
To read the bond market’s reaction, you need to separate two things that often get lumped together: short-dated yields and long-dated yields. They respond to different forces.
Shorter-duration Treasuries, the 3-month, 6-month, and 1-year bills, track near-term Fed policy expectations most closely. When the market expects a 25 basis point move in six days, those yields climb in anticipation.
Longer-duration Treasuries, the 10-year and 30-year, price something broader: inflation and interest rate expectations across a decade or more. They are not set by the Fed directly. They are set by the bond market’s collective forecast.
Following the 10 September release, the picture looked like this.
| Treasury maturity | Mid-August yield | Post-PPI yield (10 Sep) | Approx. change |
|---|---|---|---|
| 1-year | Data not confirmed* | Higher, on hike anticipation | Qualitative move up |
| 10-year | 4.657%* | 4.89% – 4.95%** | Roughly 25-30 bps |
| 30-year | 5.236%* | 5.33% – 5.35% | Roughly 10-11 bps |
*Mid-August baseline figures are unverified and included for directional context only. **Sources conflict on the precise 10-year peak; the range is shown rather than a single figure.
The 10-year near 4.89% to 4.95% marks a multi-decade peak. The 30-year around 5.33% to 5.35% sits at its highest in over two decades. The gap between where these yields stood in mid-August and where they sit now tells you something important: the bond market is already pricing the consequences of persistent inflation, without waiting for the Fed to formally act.
The August auction data reinforced that this is a structural yield repricing, not a temporary spike: the 30-year cleared at 5.216% on 13 August, its highest borrowing cost for that maturity in roughly 25 years, with primary dealers absorbing only 11.5% of supply, a figure that signals real but price-sensitive institutional demand rather than reflexive buying.
Why long-term yields move differently
The Fed sets the short-term policy rate. It does not set the 10-year or 30-year yield. Those are the bond market’s verdict on inflation and growth over horizons the Fed cannot control.
Long-dated yields also carry a term premium, which is the extra return investors demand for locking money up over a long horizon amid uncertainty. Right now, that premium is being pushed higher by three forces.
- The sheer volume of Treasury issuance, sometimes described as debt-deluge concern.
- Tariff-driven input cost risks feeding into future inflation.
- Energy prices near $100 per barrel, which raise production costs across the board.
For you, the takeaway is practical. Stop reading “the Fed raised rates” as “all yields went up equally.” The curve is a layered signal, and the long end is telling you the market expects inflation pressure to persist well beyond one meeting.
The counterintuitive case for why a “no hike” outcome could hurt more than a hike
The natural assumption is that a rate hike is the bad outcome. The mechanics of expectation pricing suggest the opposite may be true this time.
Here is the core principle. When a market action clears roughly 70% probability in futures pricing, it is largely already baked into asset prices. As of 10 September, the CME Group’s FedWatch tool assigned greater than 70% odds to a 25 basis point hike on 16 September. That figure had climbed from 64% just before the PPI report, and from the 58% to 58.4% range earlier in September. You could watch the number move in real time as the data landed.

If the hike is that widely expected, the hike itself is not the shock. The absence of a hike is.
New York-based certified financial planner Kody Sherlund frames the mechanism clearly.
A rate hike can support yield stability by reinforcing the Fed’s credibility as an inflation fighter. A decision to hold steady risks the opposite signal: that the Fed is willing to tolerate inflation running above its 2% target.
What history says about “hold” decisions
The record shows that markets read holds as a statement about the Fed’s inflation tolerance, not merely its rate preference.
- June and September 2023, hawkish holds. The Fed held rates steady at 5.00%-5.25% and then 5.25%-5.50% but signalled more hikes via its dot plot. Stocks felt the pressure, with the S&P 500 falling nearly 1% after the September decision.
- Late July 2026, a narrow hold. The Fed voted by a slim margin to keep rates unchanged. Markets took it badly, and long-term yields surged in response.
- December 2023, a dovish hold. When the Fed held and signalled cuts ahead, the reaction flipped. The Dow rallied roughly 400 points.

The July 2026 precedent is the one to sit with. It tells you the Fed’s credibility gap is already visible in the data. Another hold without a genuinely disinflationary justification could reprice risk assets faster than the hike itself would.
That reframes where your attention should sit ahead of 16 September. The hike is the expected, largely priced scenario. The unpriced risk is the surprise.
What comes after September 16, one hike or a new tightening cycle?
Suppose the hike arrives. The bigger question is whether it stands alone or opens a new tightening cycle. Analysts are genuinely divided, and it is worth seeing the split clearly.
| Scenario | Key forecast | Key assumption | Main risk |
|---|---|---|---|
| One-and-done (J.P. Morgan Asset Management) | No sustained hiking cycle | Hawkish views sit with regional bank presidents, not core Governors | Supply-side inflation forces more action |
| Renewed tightening (UBS) | Two Fed hikes in 2026 | Persistent upside inflation pressure | Credit fragility argues for a pause |
| Market-implied view | ~20% chance of an October follow-on; ~90% of at least one hike by December | Data-dependent path | A single surprise print shifts odds fast |
The figures above for the analyst scenarios and market-implied probabilities are drawn from research flagged as unverified and should be treated as indicative.
The single most information-dense output on 16 September will not be the rate decision. It will be the Summary of Economic Projections (SEP), the document where individual Fed officials forecast where benchmark rates will sit at the end of 2026, 2027, and 2028. The shift in that dot plot relative to the June version is the key signal to watch.
The June SEP itself is contested in the research. One account says it projected a modest decline in rates in later years. Another says it already penciled in one hike by year-end 2026, with nine officials marking a single 25 basis point increase. Either way, a hawkish revision now would formally confirm what the bond market is already pricing.
The risks that could force the Fed’s hand either way
The Fed is balancing two opposing pressures, and each points to a different path.
- Bank stress exposure. The Fed’s 2026 stress tests, built around a severely adverse global recession, saw 32 large U.S. banks absorb more than $708 billion in projected losses. All stayed above minimum capital requirements, but the scenario underlines how much strain a prolonged restrictive stance could create.
- Credit spread widening. Elevated long-term yields could strain leveraged borrowers, particularly in private credit and non-bank finance, arguing for caution.
- BOJ divergence and carry trades. The Bank of Japan raised its rate to 1.0% in June and is expected to lift it to 1.25% on 18 September, heading toward 1.75%. That narrowing gap with U.S. rates affects the yen-funded carry trades flowing into American assets.
On the other side sits the upside inflation risk: supply-side shocks, tariff pass-through, and oil near $100 per barrel. If those pressures persist, the case for more than one hike strengthens.
The Fed credibility premium embedded in long-end yields became visible after the July 29 press conference, when long-term Treasury yields rose while short-term rates fell, a bear steepening that Wolfe Research, Capital Economics, and Barclays each attributed to a mismatch between a hawkish written statement and a non-committal chair tone that investors read as tolerance of above-target inflation.
Reading the September 16 decision as a framework, not a single event
The most useful shift you can make this week is to stop treating 16 September as a binary. Whether 25 basis points arrive is the least surprising part. The information lives in the SEP revisions, the dot plot shift, and the Chair’s language on the path ahead.
If a hike lands, it is the expected outcome and already reflected in prices. What moves markets next is whether the Fed signals one more step or several.
Here is what to actually watch on the day:
- The SEP year-end 2026 median rate projection. A meaningful rise would read as a multi-hike signal.
- The number of officials projecting more than one additional hike.
- Any language on the term premium or elevated long-term yields.
- The October follow-on probability, currently near 20%, as the first test of whether September is a comma or a new sentence.
For context, the last U.S. tightening cycle ran to 11 rate increases between spring 2022 and autumn 2023, coinciding with a stock market bear market. The late July 2026 hold, and the yield surge that followed, is the freshest reminder of how costly it is to misread the Fed’s signalling.
For investors trying to size the equity risk around a September decision, our dedicated guide to S&P 500 performance during rate hikes covers the Goldman Sachs data showing the index has averaged roughly 9% in the 12 months after the first hike, along with the four variables that determine whether a cycle tracks the historical average or departs from it.
The core paradox to hold onto The expected hike is not the risk. The risk lives in the unexpected hold or the unexpected hawkish SEP, and that is where the volatility that touches your portfolio will come from.
This article is for informational purposes only and should not be considered financial advice. Investors should conduct their own research and consult with financial professionals before making investment decisions. Past performance does not guarantee future results, and financial projections are subject to market conditions and various risk factors. Forward-looking statements are speculative and subject to change based on market developments.