Every major crude oil surge of roughly $40 per barrel over the past two decades has been followed by a stock market decline. Not most of them. Every one.
That regularity, tracked by Bloomberg Intelligence strategist Mike McGlone, is not a curiosity of chart-watching. It is a pattern that has held across geopolitical shocks, monetary regimes, and three different decades. Which raises the obvious question: is this time different?
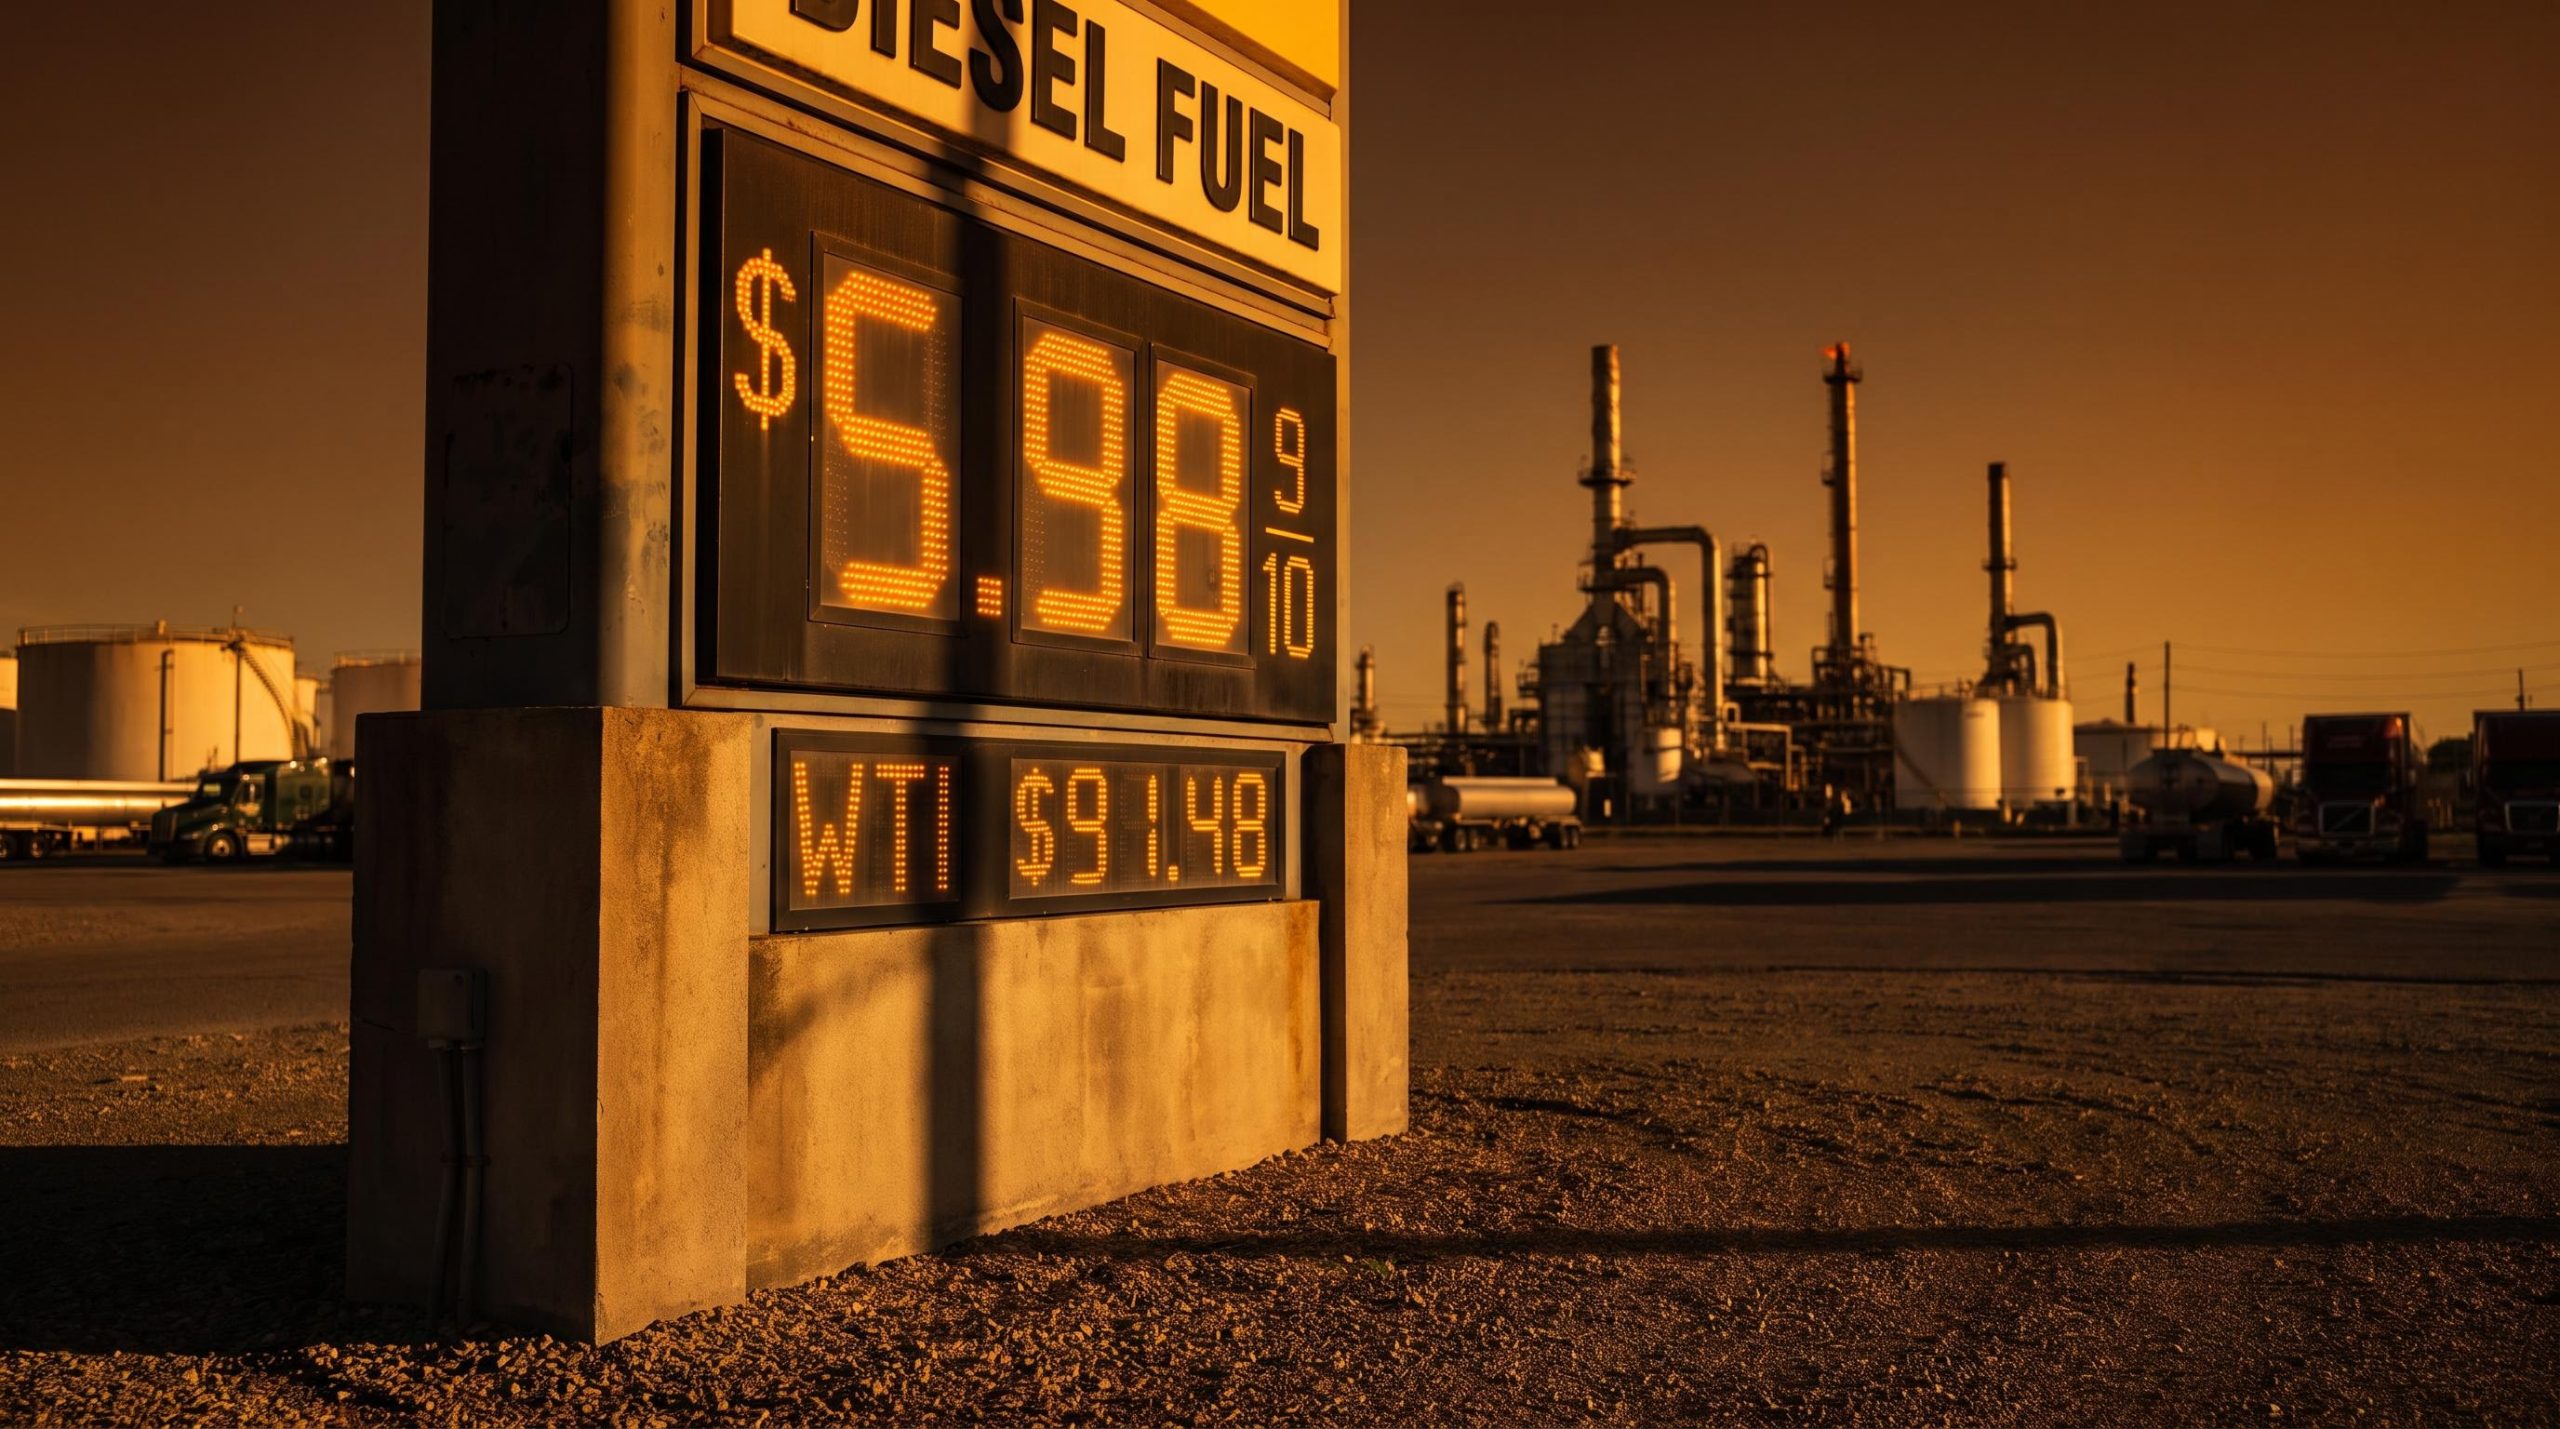
The current numbers make it worth asking. As of early September 2026, WTI is trading near $91.48 per barrel and Brent near $96.02, leaving crude up roughly 75% year-to-date. Diesel at the pump has reached a record near $6 per gallon in the United States, the operational fuel of the entire physical economy.
Read the next few sections and you will have a working framework for treating energy prices as a leading recessionary and deflationary signal, plus three specific market indicators to watch for the first evidence that the reversal has begun.
Every major oil spike ends the same way, and the pattern is repeating
The strength of a pattern comes from how many times it survives conditions that should have broken it. This one has survived a lot.
Start with 2008. Crude peaked at $147 per barrel that summer, driving a genuine inflationary shock through freight, food, and manufacturing. By the end of the year, WTI had collapsed to roughly $40 per barrel as equities fell apart. The inflation that felt permanent in July was gone by December, and the mechanism that killed it was a market decline, not a gentle cooling.
Then 2011. The European Central Bank raised rates into what turned out to be transitory energy inflation, tightening policy just as the pressure was about to ease on its own. Those hikes were later unwound aggressively, and the episode is now cited by McGlone and others as a policy error framework: a central bank inflicting avoidable damage by treating a temporary spike as a structural one.
The pattern also runs in the other direction. McGlone notes that every instance of U.S. unleaded gasoline falling to roughly $2 per gallon has coincided with a broader equity downturn. High energy stresses the economy on the way up; collapsing energy confirms the damage on the way down. The link between fuel and equities runs both ways.
The $40-surge rule: over the 20 years prior to the original analysis, every major crude oil price surge of approximately $40 per barrel has preceded a stock market decline.
Here is what those three episodes have in common:
- 2008 peak-and-collapse: $147 crude created an inflationary shock, then reversed to roughly $40 by year-end as equities fell.
- 2011 ECB misstep: Rate hikes into transitory energy inflation, later reversed, delivering unnecessary economic damage.
- The $2 gasoline floor: Every time U.S. gasoline hit roughly $2, a broader market downturn followed, showing the bidirectional link between fuel and equities.
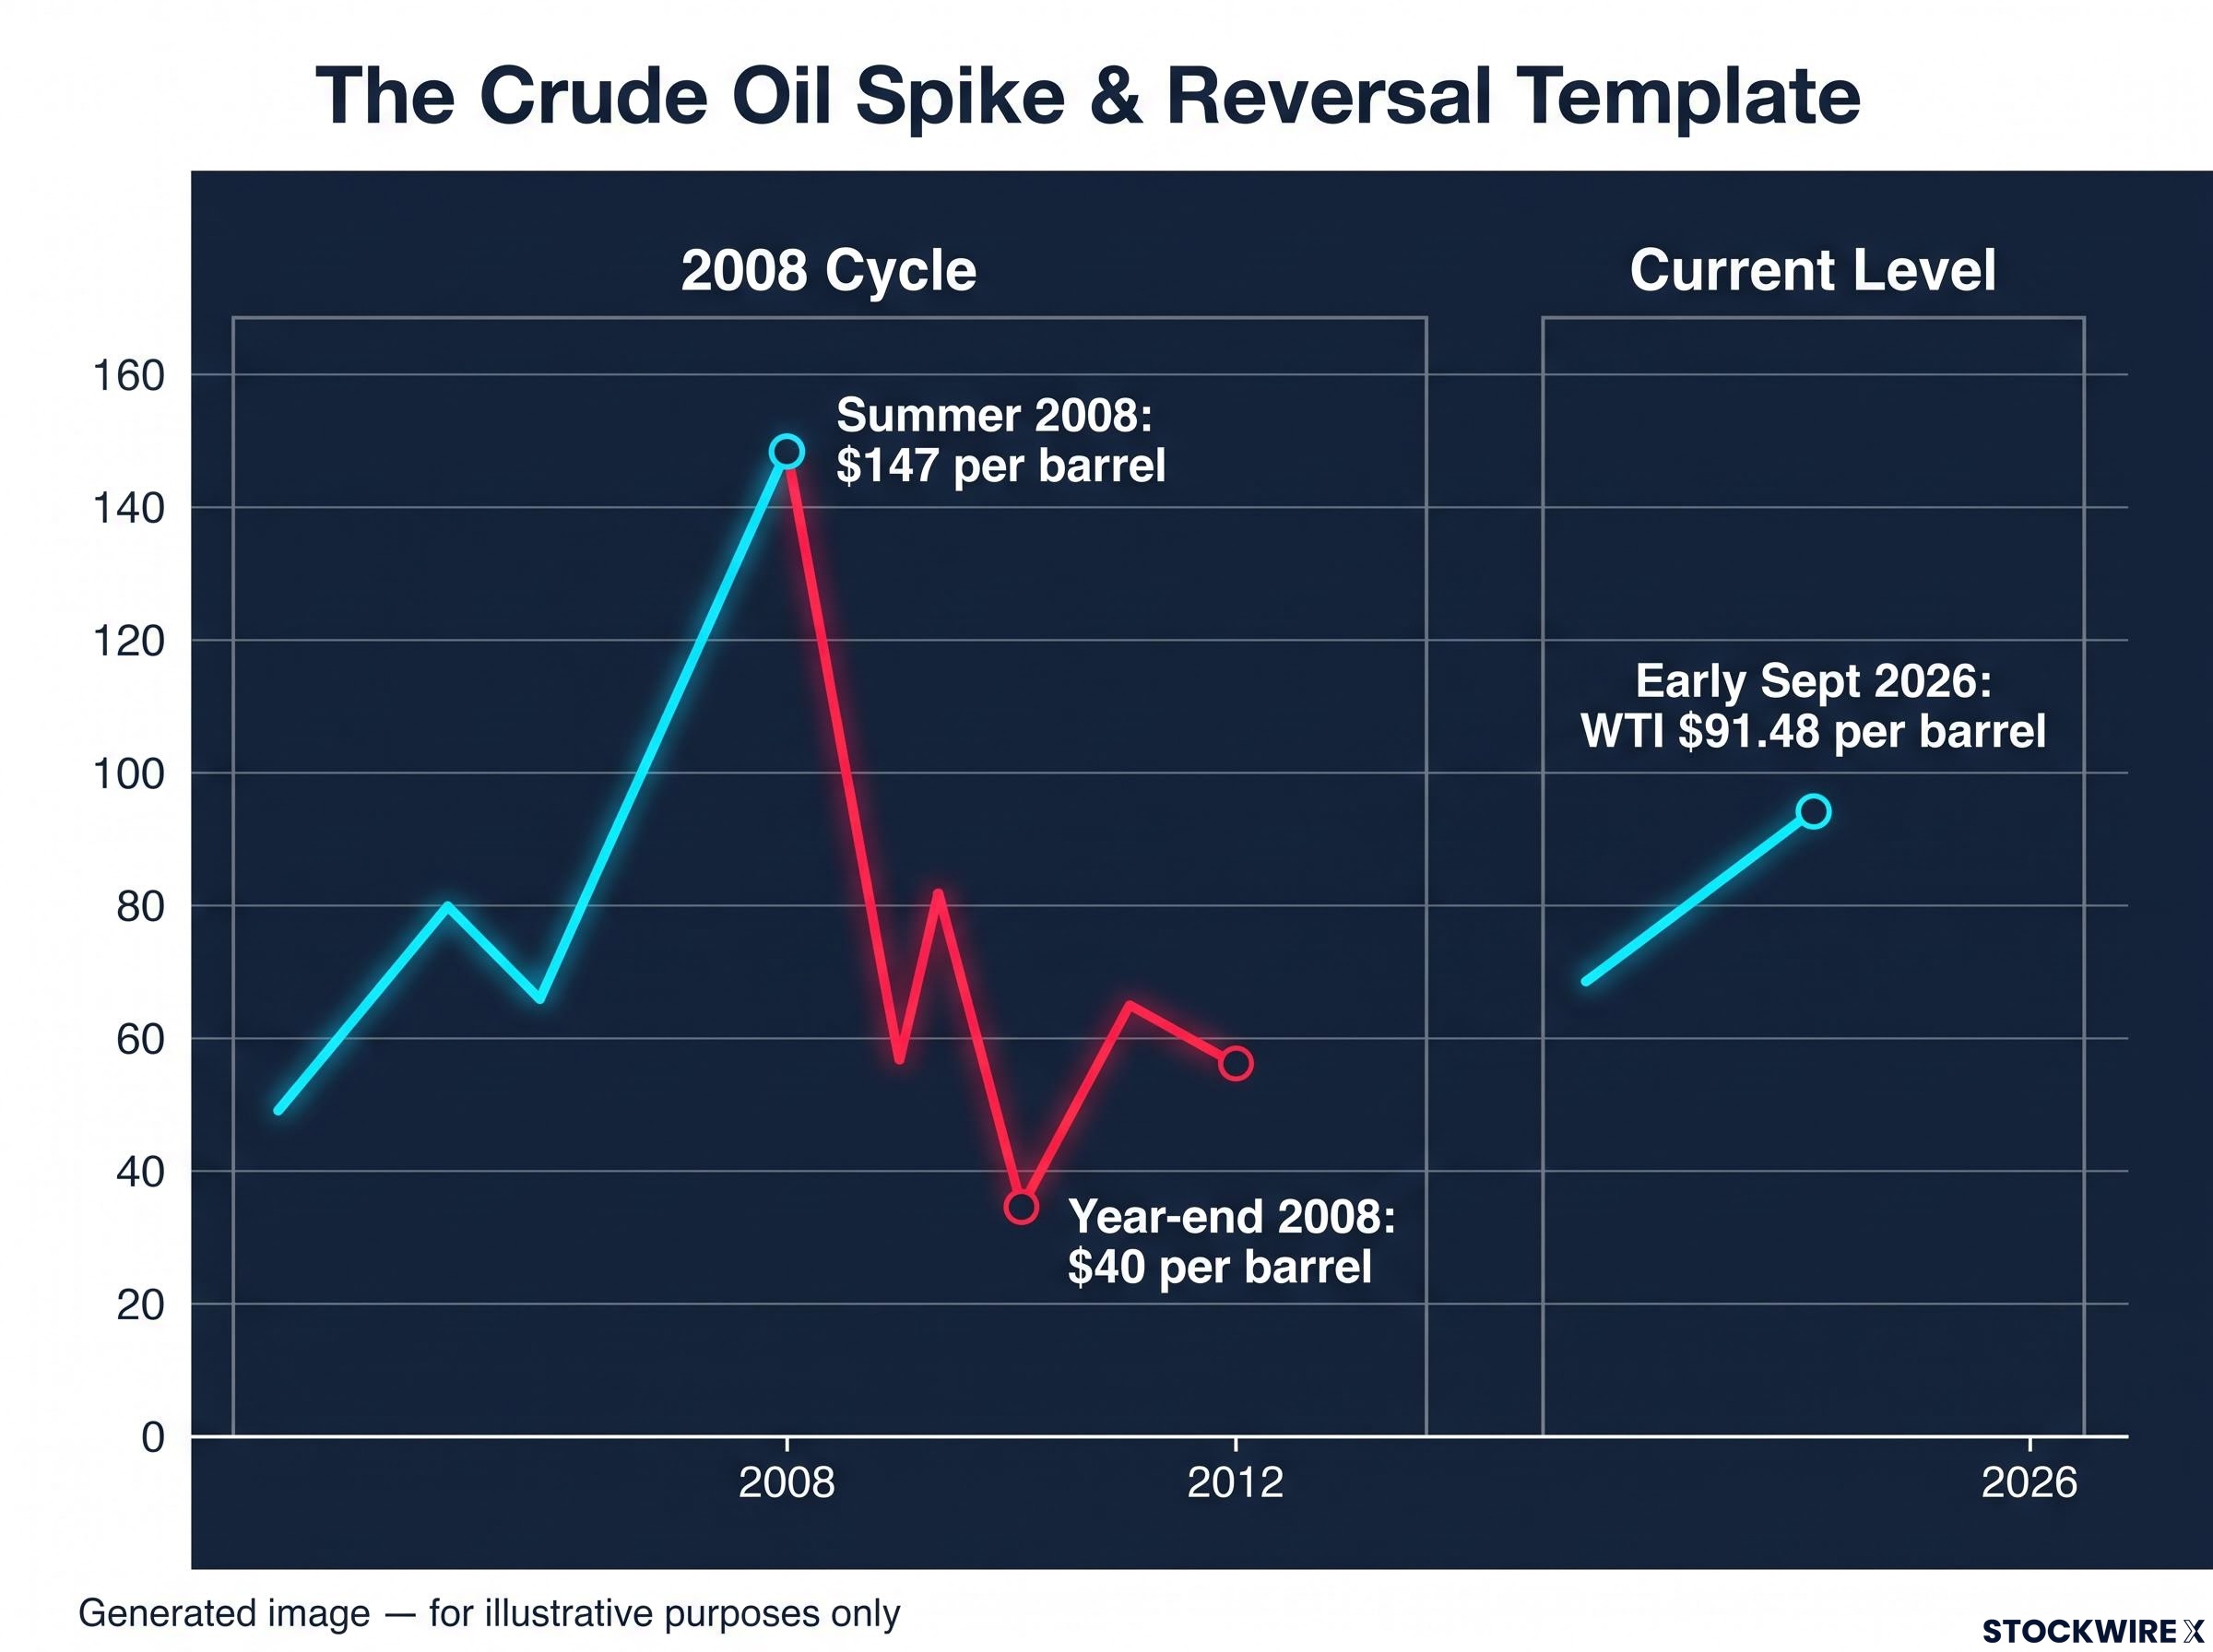
With crude up around 75% in 2026 and sitting near $91.48, the current spike is not an anomaly demanding a fresh explanation. It is the latest instance of a well-documented sequence. That reframes the question you should be asking: not whether a reversal is coming, but how severe it will be and how long it takes to arrive.
The oil shock precedents from 2008, 2011, and 2022 each produced S&P 500 returns materially below the index’s long-run average in the following 12 months, reinforcing McGlone’s thesis that the current cycle is pattern-consistent rather than anomalous.
When big ASX news breaks, our subscribers know first
Why diesel at $6 is the most important number in the global economy right now
You rarely buy diesel directly. You pay for it constantly.
Diesel is what McGlone calls “the grease of the global economy,” and the description is literal. Freight, agriculture, manufacturing, and logistics all run on it, which makes its price a systemic variable rather than a sector-specific one. When diesel moves, the cost of moving everything moves with it.
The propagation runs in a straight line. Near-$6 diesel raises per-mile trucking costs, which raises freight rates, which raises the delivered cost of goods, which raises retail prices, which compresses household real income, which finally reduces the discretionary spending that drives corporate revenue. One input, six steps, an entire consumer economy downstream.
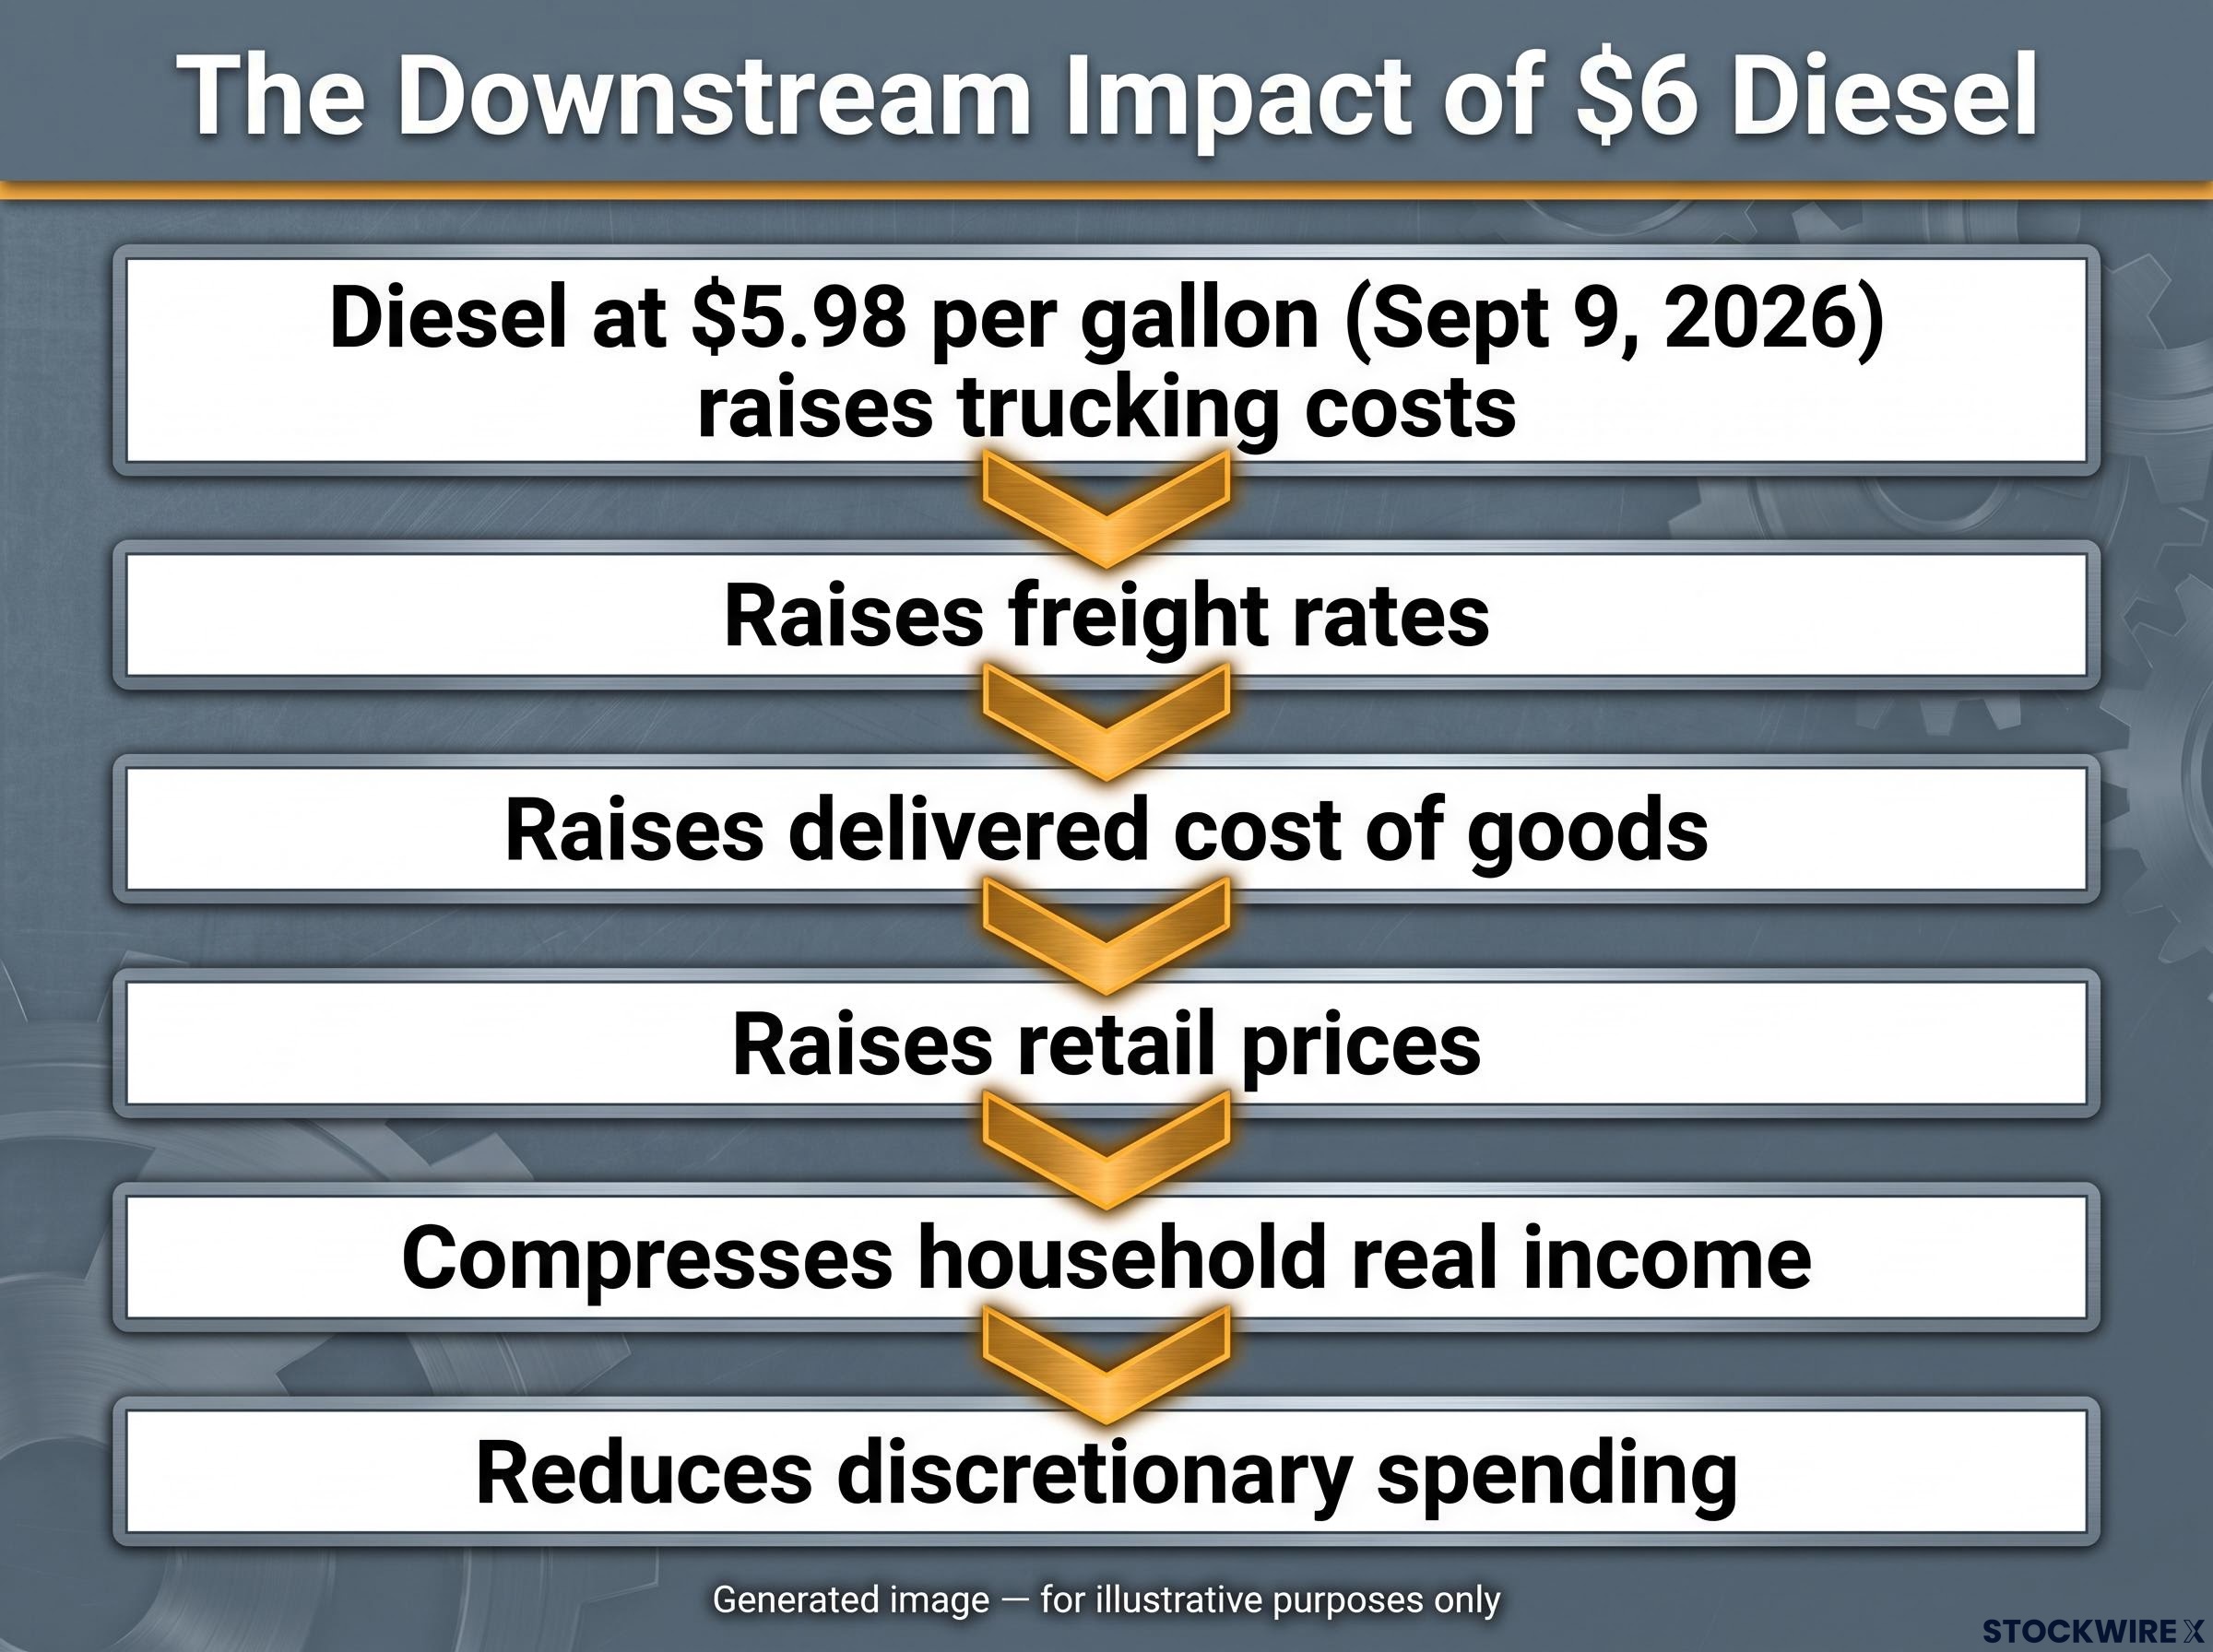
The numbers behind this are stark. EIA data put U.S. on-highway diesel at $5.98 per gallon on 9 September 2026, with the weekly average at $5.967 on 7 September, up $2.201 year-over-year, an annual increase of more than 60%. Regular unleaded gasoline sat at $4.28 per gallon, up 96.5 cents over the same period.
That $2.20 annual rise in diesel is not a trucking industry problem. It is a tax on every physical good that moves, and it compresses corporate margins and household budgets before either effect shows up in an earnings report or a CPI print.
This is also why diesel is a sharper signal than gasoline. Gasoline hits consumer wallets directly and visibly, so it generates headlines fast. Diesel hits producer cost structures first, which makes its stress less visible early on but more systemically damaging by the time it surfaces. And none of this is a supply story: North American crude and liquid fuel surpluses are running at roughly 8 million barrels per day. The constraint is price transmission, not availability.
The diesel price paradox, record domestic prices coexisting with record export volumes, illustrates how price transmission rather than raw availability is the operative constraint: North American surpluses of roughly 8 million barrels per day are not suppressing pump prices because refinery capacity, shipping lane disruptions, and crack spread dynamics determine what domestic consumers actually pay.
| Sector | Diesel dependency | Primary stress mechanism | Downstream effect |
|---|---|---|---|
| Freight and trucking | Very high | Higher per-mile operating costs compress carrier margins | Rising freight rates feed into delivered cost of all goods |
| Agriculture | High | Fuel for machinery, irrigation and transport raises per-acre costs | Higher food prices, lower net farm incomes |
| Manufacturing and logistics | High | Inbound and outbound freight surcharges squeeze margins | Cost pressure passed to consumers or absorbed as margin loss |
| Consumer goods | Indirect but pervasive | Compounded logistics costs embedded in retail prices | Households trade down, pressuring consumer-facing revenues |
The same stress, applied globally
Do not mentally ring-fence this as a U.S. domestic issue. Europe and Asia face structurally similar diesel cost escalation, and with fewer domestic energy buffers than the United States, they absorb the pressure with less cushion. Diesel stress is a global transmission mechanism, not a national one.
How energy inflation becomes its own cure, and why that cure is deflationary
Here is the contradiction at the centre of this whole framework: the inflation caused by energy tends to reverse into deflation. Understanding why is what separates investors who see a correction coming from those caught off guard by its severity.
McGlone’s thesis rests on a distinction between transient and structural inflation. Energy-driven inflation, in his framing, is rooted in “the geopolitical decisions of a single leader” rather than a structural excess of demand. Because the cause is temporary, the inflation self-corrects. The catch is that the correction mechanism is a stock market decline, not a gradual softening.
The link from high energy costs to falling equities runs through three channels:
- Earnings compression: Rising fuel and feedstock costs erode margins in energy-intensive sectors such as industrials, chemicals, and airlines.
- Demand destruction: Higher fuel costs cut household real income, squeezing discretionary spending and weakening corporate revenue guidance.
- Monetary policy reaction: Energy-driven headline inflation pushes central banks to tighten, raising discount rates and risk premia, which directly compresses equity multiples.
This transmission is not new. Economic research, including work by James Hamilton, shows that rapid oil price spikes have preceded most U.S. recessions since the Second World War, acting at once as a tax on consumers and a cost shock on producers.
James Hamilton’s NBER research on oil shocks documents that rapid oil price spikes have preceded most U.S. recessions since the Second World War, functioning simultaneously as a consumer tax and a producer cost shock that compresses output before conventional economic indicators register the damage.
What makes the current cycle more dangerous is the delay. McGlone points to asset price inflation, driven by accumulated wealth rather than energy alone, which prevents central banks from cutting rates without re-igniting broader inflation. That constraint keeps the pressure building for longer, and a correction that builds for longer tends to release harder. It is the 2011 ECB error in reverse: policy trapped by inflation it cannot easily ease.
The disinflation is already visible where you would expect it first. Natural gas, a leading indicator for heat, electricity, and fertiliser input costs, has fallen sharply from its recent peak.
Henry Hub natural gas has fallen from a 2022 monthly peak of approximately $9 per MMBtu to roughly $2.90 per MMBtu in September 2026, a decline of more than 50%.
The implication for your positioning is direct. If history holds, the deflationary reversal is not a tail risk to hedge against. It is the central case. And because its arrival is delayed by the monetary constraints above, the eventual correction is likely to be sharper than the gradual softening many investors are currently pricing in.
Three signals that will tell you whether the reversal has started
Pattern and mechanism are useful, but neither tells you when. For that you need observable evidence. These three variables either confirm or challenge the deflationary reversal thesis in real time, which means you can watch them instead of waiting on lagged economic data.
- Bitcoin below $80,000. McGlone treats Bitcoin as a forward-looking liquidity and risk-appetite indicator rather than a speculative asset in isolation. A sustained move below $80,000 is his critical bearish macro signal. It was down roughly 2% on 10 September 2026.
- Long-duration Treasury bonds (TLT). The iShares 20+ Year Treasury Bond ETF offers positive carry with no time decay, making it a structural hedge that becomes more attractive precisely as equity risk premiums rise. Strength here would signal capital rotating toward safety.
- Crude oil directional momentum. A sustained move back toward lower levels in WTI would represent the deflationary signal within the energy complex itself, consistent with the 2008 reversal pattern from $147 to $40.
The thesis has genuine opponents, and the honest read acknowledges them. In late March 2026, Goldman Sachs raised its 2026 Brent forecast to $85 per barrel, citing Strait of Hormuz disruption as the largest-ever supply shock. Structural inflation proponents argue that upstream underinvestment and OPEC+ discipline will keep energy elevated longer than deflationists expect.
Oil intensity in modern economies has fallen roughly 56% since 1973, meaning the same nominal crude price delivers a materially smaller structural blow than it did in prior decades, a point that forms the strongest empirical counterargument to the automatic deflationary reversal thesis and explains why Goldman Sachs and others see elevated prices persisting without triggering the historical collapse sequence.
Goldman Sachs forecast Brent averaging roughly $56 per barrel in December 2025, then revised that to $85 by late March 2026. The swing shows how quickly institutional views can shift on a geopolitical shock.
There are supply-side counterweights too. Venezuelan output is up roughly 30% year-over-year, with projections to double within about a year, feeding the surplus that supports eventual price normalisation. The point of the watchlist is not to predict the exact timing of a reversal. It is to know which levels will confirm or invalidate the thesis early enough for you to act ahead of consensus rather than after it.
What the historical pattern demands from investors right now
Pull the threads together and they point the same way. The $40-surge rule, the diesel stress signal, and the natural gas disinflation already underway are aligned, which makes the deflationary reversal the base case rather than the tail risk.
The figures anchoring that case are current: WTI near $91.48, diesel near $5.98 per gallon, natural gas near $2.90 per MMBtu, all as of September 2026. The 2008 collapse from $147 to $40 is the historical template, and the $40-surge rule is the empirical spine.
What is not knowable is the timing. The pattern is historically consistent, but the Hormuz-driven supply shock is a genuine geopolitical variable that could delay the reversal, and Goldman’s forecast range of $56 to $85 for Brent captures how real that uncertainty is. Underneath it all, the combined U.S. and Canadian surplus of roughly 8 million barrels per day remains the supply foundation that supports eventual normalisation.
Because the timing is uncertain, the resolution comes from the signals, not from waiting on lagged CPI or GDP prints. Watch these three:
- Bitcoin sustained below $80,000 as a bearish liquidity and risk-appetite confirmation.
- Long-duration Treasuries (TLT) strengthening as capital rotates toward positive-carry safety.
- Crude oil momentum turning back toward $70 or below as the energy complex confirms the reversal.
For investors who want to track crude oil directional momentum in real time rather than waiting on lagged economic reports, our comprehensive walkthrough of WTI price signals explains how to use weekly EIA inventory data, key technical levels, and momentum indicators to build an updating scenario map around the reversal thesis.
The question is no longer whether to take the deflationary thesis seriously. It is how to size your exposure to it given the timing uncertainty and the Hormuz wildcard. On the current evidence, a defensive tilt toward long-duration Treasuries and reduced energy-intensive equity exposure is the position most consistent with the pattern, pending confirmation from the signals above.
This article is for informational purposes only and should not be considered financial advice. Investors should conduct their own research and consult with financial professionals before making investment decisions.
Past performance does not guarantee future results. Financial projections are subject to market conditions and various risk factors, and these statements are speculative and subject to change based on market developments.