The European Central Bank raises its deposit rate, and the euro falls anyway. If that sounds like a contradiction, it points to the single most important thing about how currencies respond to macro events: the announcement itself is rarely the story.
Three forces sit at the centre of this: ECB rate decisions, US Treasury buybacks of long-dated debt, and the sequencing of the two big US inflation reports, the Producer Price Index (PPI) and the Consumer Price Index (CPI). These are not separate topics. They feed into the same pricing engine, and EUR/USD is the cleanest lens through which to watch them work, because it sits at the intersection of all three.
Here is the uncomfortable part. As a finance-literate retail investor, you have access to the exact same data releases as the biggest institutional trading desks. What you often lack is the interpretive framework to know which signal actually matters, and why it matters at that precise moment.
That is what this covers. After reading, you will know what to watch for before each type of announcement, how to read the market’s reaction relative to what was already expected, and why the same data print can send a currency in opposite directions depending on the conditions around it.
Why the same rate hike can send a currency in either direction
Start with the paradox, because solving it gives you the mental model that everything else in this guide rests on. A central bank raises rates, which should make its currency more attractive, yet the currency drops. The resolution is simple once you see it.
Foreign exchange markets do not price the current level of rates. They price the expected future path of rates. A hike that was fully anticipated before the announcement carries almost no new information, because the market already moved to reflect it days or weeks earlier.
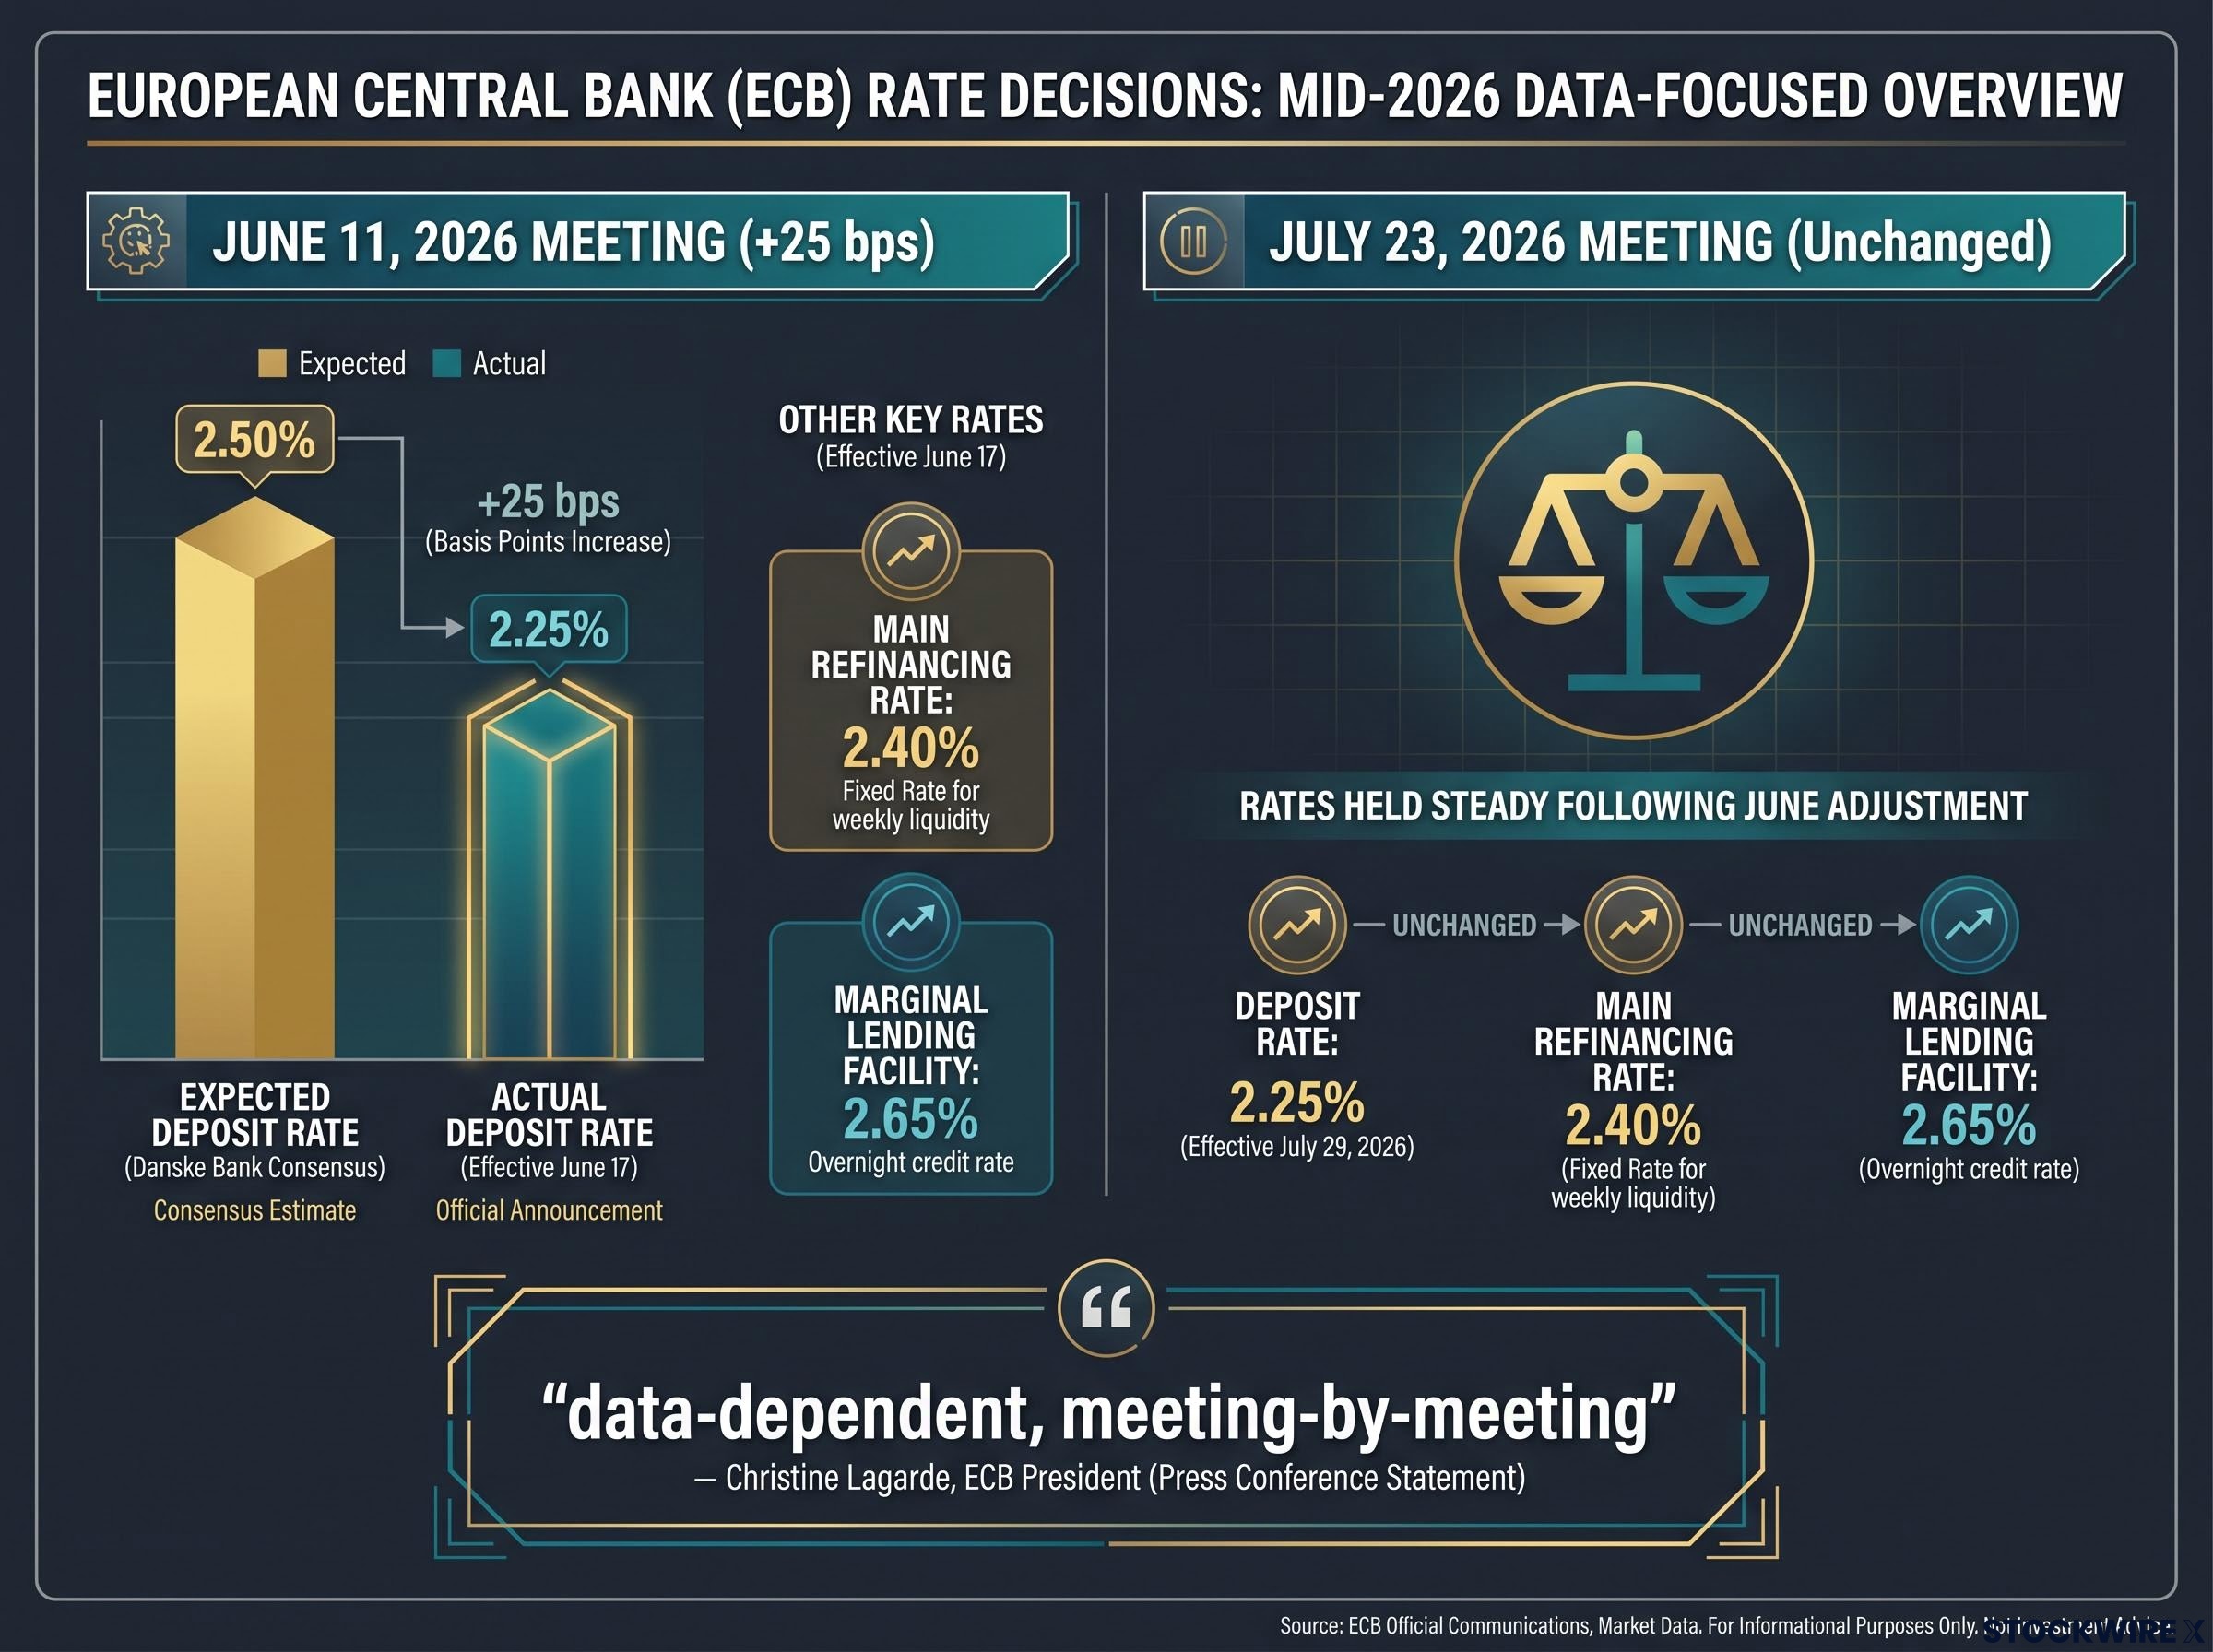
This is the “buy the rumour, sell the fact” dynamic, and the ECB’s June 2026 decision is a clean example. The Governing Council raised all three key rates by 25 basis points at its 11 June 2026 meeting, lifting the deposit facility rate to 2.25% effective 17 June 2026, with the main refinancing rate at 2.40% and the marginal lending facility at 2.65%.
Here is the tell. Pre-decision analyst consensus, including Danske Bank, had centred on a 2.50% deposit rate target. The ECB moved less than the market expected.
If you were holding a long euro position into that announcement on the assumption of a more aggressive hike, you faced a predictable reversal. That is the whole point: tracking the consensus expectation is as important as tracking the data itself.
Three distinct channels carry an ECB decision into EUR/USD, and sell-side strategists at Deutsche Bank, ING, and Rabobank tend to group them the same way:
The deposit facility rate sits at the centre of this, but ECB monetary policy tools also include quantitative tightening and balance sheet guidance, each of which shapes the euro yield curve independently of the rate headline and compounds or offsets the FX signal from any single meeting decision.
- Short-rate differentials: the gap between expected ECB and Fed policy rates over the next one to two years, working through standard uncovered interest-parity logic (higher relative rates should attract capital into the currency).
- Term-structure and risk-premium effects: ECB guidance moves the entire euro yield curve, pulling in foreign capital if credit risk stays contained, or pushing the euro lower if hikes are read as growth-negative.
- Portfolio rebalancing: because the deposit rate sets the return on banks’ excess reserves, changes shift incentives to hold euro cash versus other assets, influencing currency demand indirectly.
The forward guidance effect: when words outweigh numbers
The rate level is only half the message. The words around it are the other half, and often the more important one.
The ECB’s “data-dependent, meeting-by-meeting” language is itself a rate-path signal. By declining to commit to a forward path, President Christine Lagarde constrained how far the market could reprice future rates, which in turn limited post-announcement volatility. The July 2026 meeting on 23 July 2026 reinforced this by holding all three rates unchanged.
The practical trap is this. A hike delivered alongside dovish language, stressing downside growth risks or hinting at a pause, can send the euro lower even as the policy rate rises.
Research from ING and Bloomberg Economics highlights that communication surprises, shifts in the central bank’s reaction function or inflation narrative, can generate larger FX moves than the actual rate change itself, because they reshape the expected future path of rates.
Richmond Fed research on forward guidance documents how central bank communication signals reshape expected rate paths independently of the policy rate itself, the same mechanism that makes Lagarde’s press conference language as consequential as the ECB’s rate decision for EUR/USD pricing.
So read the full statement and the Lagarde press conference summary, not just the rate headline. The number is where you start. The guidance is where the currency move often lives.
Identifying forward guidance signals in ECB statement language, particularly phrases referencing second-round inflation effects or Council divisions on pace, has historically produced larger EUR moves than the rate number itself, because they shift market-implied terminal rate expectations before the next meeting has even been scheduled.
When big ASX news breaks, our subscribers know first
What US Treasury buybacks actually do to the dollar
The second force is easy to over-read, so it pays to build the mechanism from first principles and keep the scale honest. On 19 August 2026, the US Treasury announced it was raising the maximum size of its liquidity-support buyback operations for longer-dated debt, lifting the per-operation cap from USD 2 billion to at least USD 4 billion for the 10-to-20-year and 20-to-30-year maturity sectors.
Notice the framing. Treasury explicitly describes these as liquidity-support operations for off-the-run issues, older bonds that trade less actively. They are not a monetary policy tool, and they are not quantitative easing.
| Maturity Sector | Prior Per-Operation Cap | New Per-Operation Floor | Effective Date | Program End Date |
|---|---|---|---|---|
| 10-to-20-year | USD 2 billion | At least USD 4 billion | 9 September 2026 | 4 November 2026 |
| 20-to-30-year | USD 2 billion | At least USD 4 billion | 9 September 2026 | 4 November 2026 |
The first buybacks in the 10- and 20-year sectors were scheduled to begin 10 September 2026, and Danske Bank analysis reported the inaugural expanded operation at USD 6 billion, consistent with the “at least USD 4 billion” floor rather than in conflict with it. Treasury set a minimum per operation, not a ceiling.
Three channels connect these operations to the dollar:
- Duration supply: buying up long-dated Treasuries reduces the net duration available to private investors, which can compress long-end yields or term premiums at the margin.
- Liquidity and market functioning: narrower spreads in long Treasuries reinforce the dollar’s role as safe, tradeable collateral, supporting USD demand in global funding markets.
- Dollar-funding and collateral dynamics: better functioning in long-dated Treasuries supports cross-currency basis and FX swap markets, indirectly touching EUR/USD through hedging decisions.
Now the calibration, because this is where investors most often go wrong. EUR/USD edged upward alongside higher long-dated US Treasury yields after the announcement, but the magnitude of the yield move stayed contained.
A jump from USD 2 billion to at least USD 4 billion per operation sounds large in percentage terms. Set against a multi-trillion-dollar Treasury market, with regular auctions continuing on their scheduled cadence, it functions as market-structure maintenance, not a macro driver.
If you build a strong dollar view primarily on a buyback headline, you are almost certainly over-weighting it. Knowing the difference between a liquidity-support operation and a policy signal keeps you from misreading these announcements as Treasury taking a view on rates or debt sustainability. That misread is a common way to get mispositioned around these events.
How PPI and CPI sequencing shapes bond and currency markets
The third force is the least familiar, so build it up in stages. Start with why the Producer Price Index matters at all before worrying about the order of release.
PPI measures the prices producers receive at the wholesale level, before goods reach the shelf. Those producer costs feed into consumer prices with varying lags, which makes PPI a leading indicator that professional forecasters embed directly into their CPI models. The Consumer Price Index, by contrast, measures what households actually pay.
The mechanics of PPI-CPI transmission
The pass-through is not uniform. It works through specific channels that forecasters weight differently.
Goods CPI often responds to changes in wholesale prices captured by PPI, so a declining PPI for finished and intermediate goods can foreshadow slower goods inflation at the consumer level. Sector-specific reads sharpen the signal: lower PPI for energy or transportation points to future easing in fuel, airline fares, and freight-related CPI components.
The historical record supports the framework. In mid-2022, US PPI growth began slowing before CPI, particularly in core goods, giving markets an early read that supply-chain-driven inflation had peaked.
In late 2022 and early 2023, research from Goldman Sachs, JPMorgan, and Nomura pointed to falling PPI for used cars and durable goods as an early indicator that CPI for those categories would decelerate, helping anchor expectations for a slower pace of Fed rate hikes.
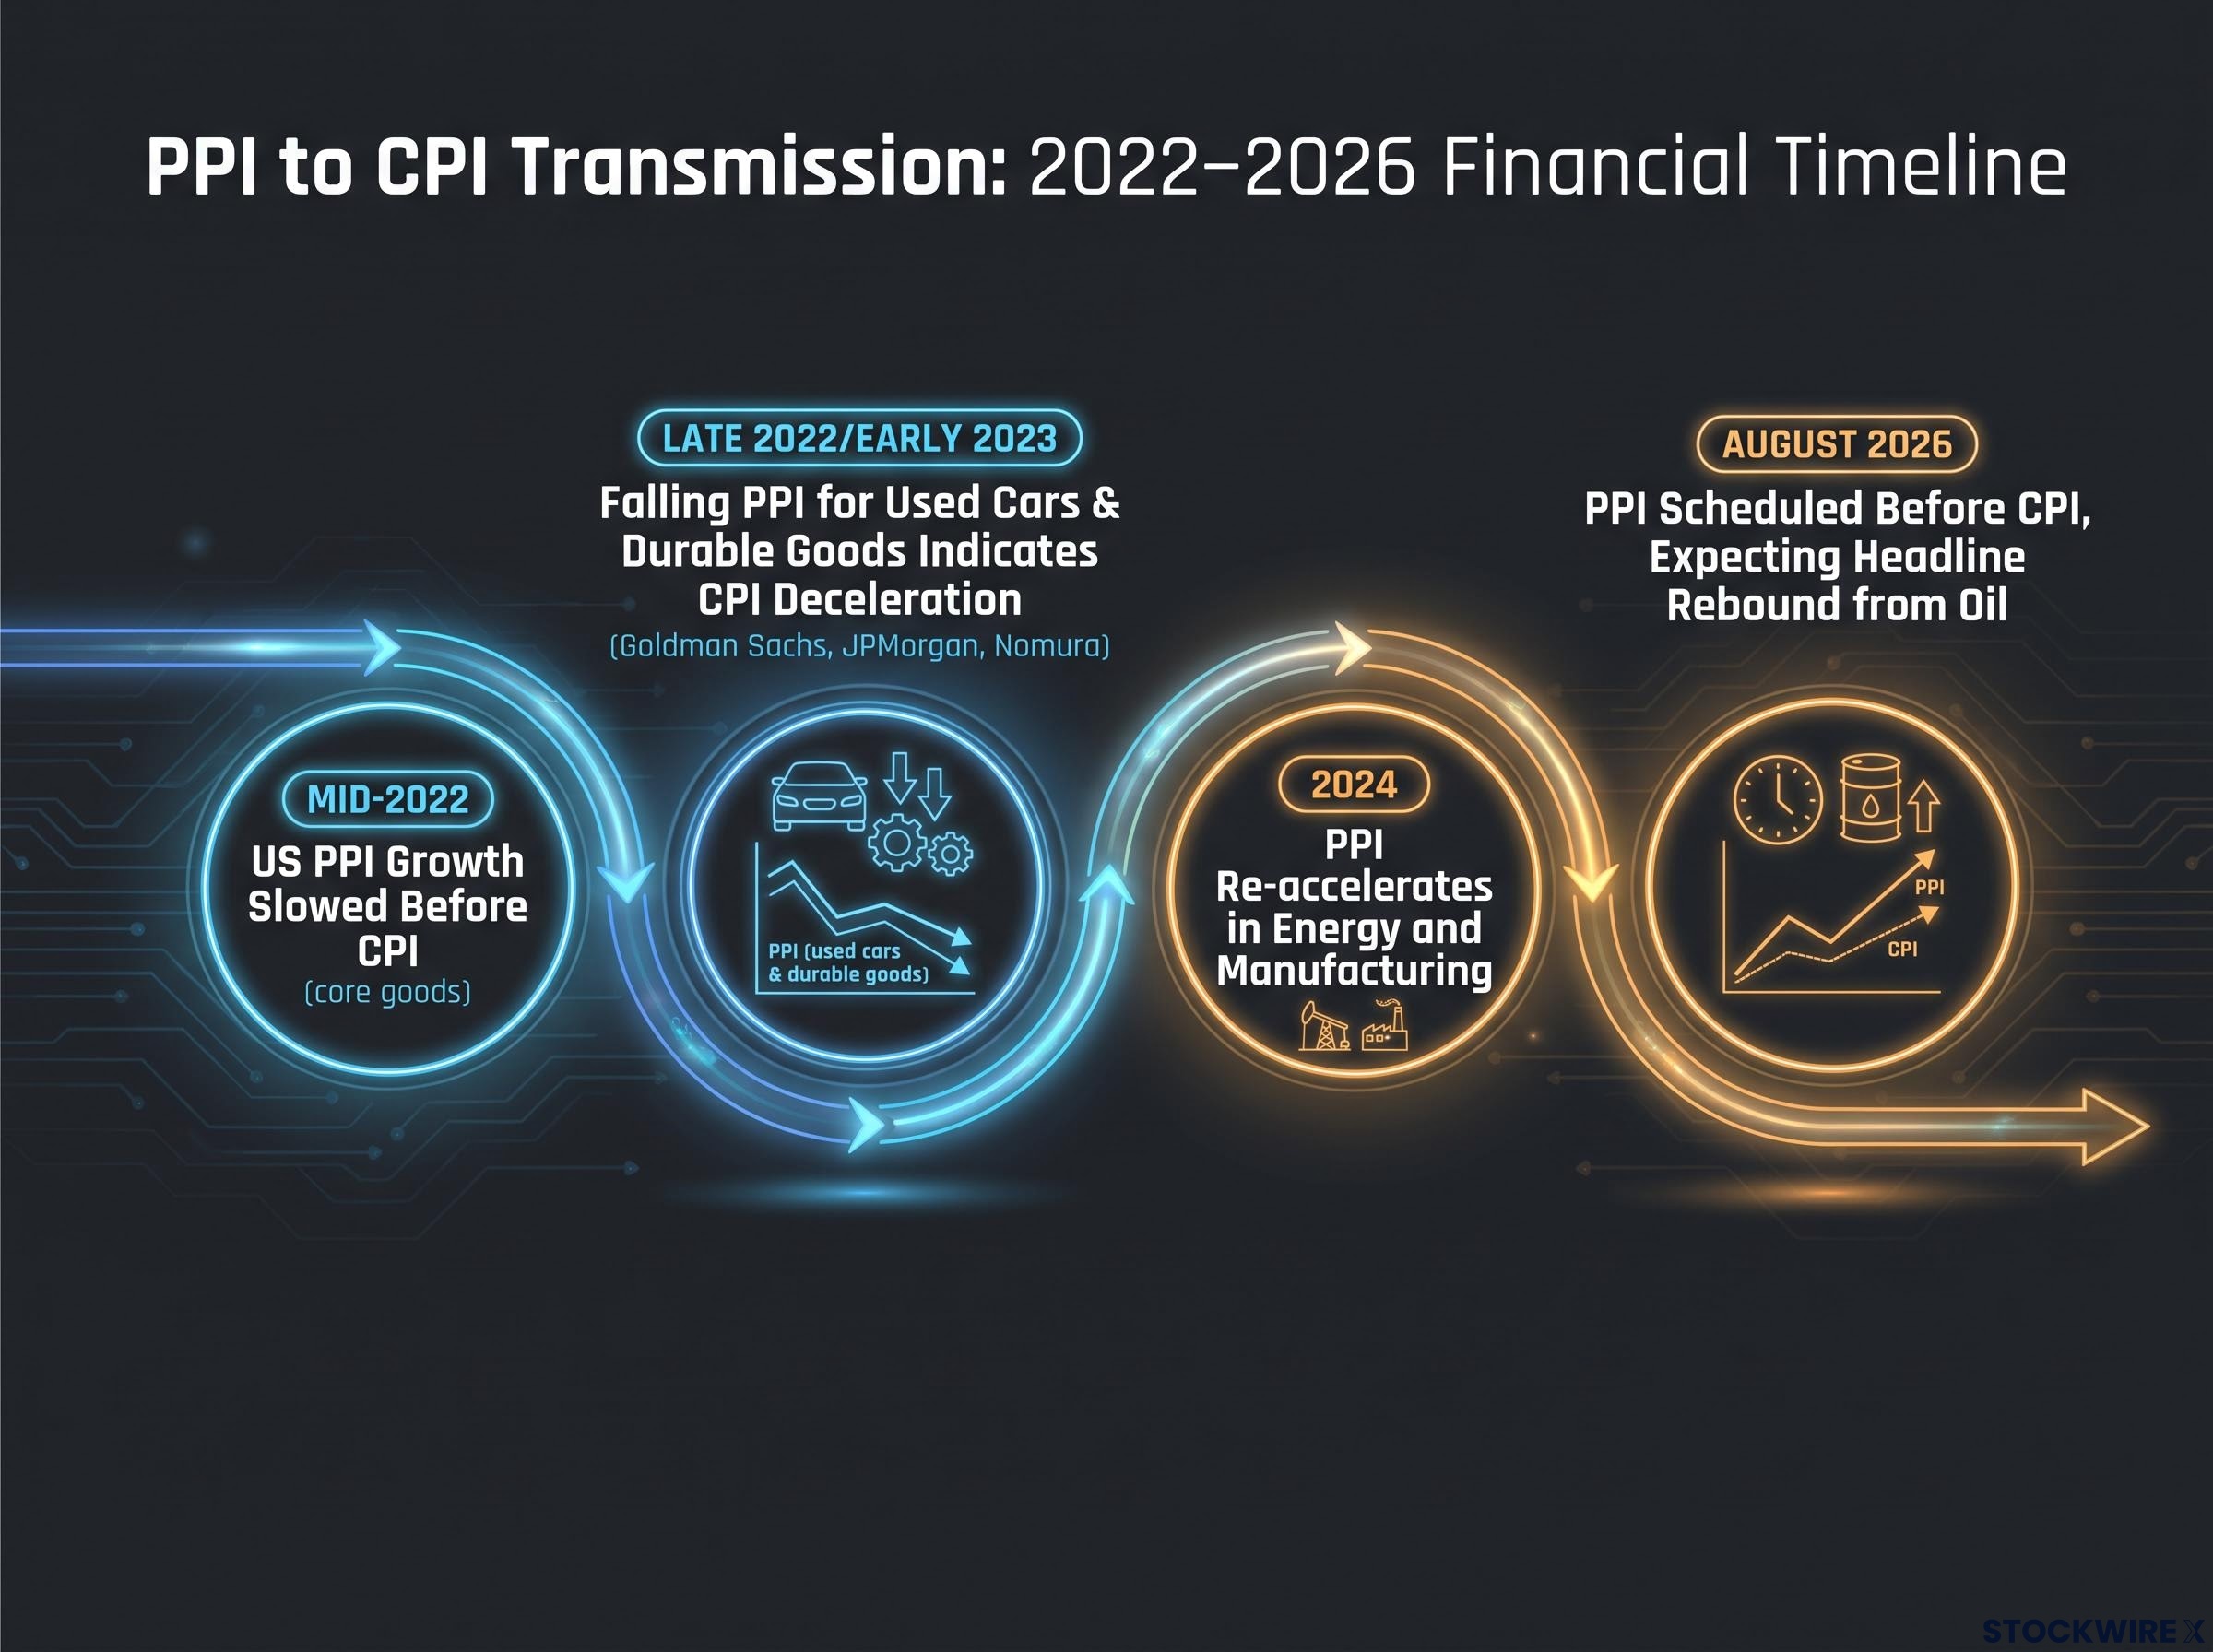
In 2024, the pattern ran the other way, with PPI re-accelerating in energy and certain manufacturing categories, warning of renewed CPI pressure and lifting the dollar through fresh expectations of Fed hawkishness.
Global fund flows data from August 2026 illustrates this interplay directly: the Federal Reserve pause anchored by moderating CPI and PPI prints was identified as the primary engine driving both equity and bond inflows simultaneously, because lower-than-expected inflation data compressed the opportunity cost of deploying cash into duration.
Sector-specific signals to watch inside the PPI release
Not every part of PPI passes through equally, and this is where you gain your edge. The categories with the strongest and fastest pass-through to CPI are energy, transportation, and finished consumer goods.
The catch is volatility. Energy and one-off supply-chain shocks can produce a dramatic headline PPI move that never reliably reaches core CPI, which is why such spikes tend to have less sustained FX impact.
For that reason, professional forecasters weight core PPI, the figure that strips out food and energy, most heavily when estimating the underlying CPI trajectory.
Sequencing turns all of this into a tactical signal. The August 2026 PPI report carried elevated significance precisely because it was scheduled before CPI, with the CPI print due the following day. The report was expected to show a headline rebound driven by higher oil prices, interrupting a prior declining year-on-year trend in both headline and core readings.
Here is how to use that one-day head start:
- Read the PPI release for which sectors are driving the move, not just the headline number.
- Apply sector-specific pass-through rates to forecast the likely CPI components.
- Assess whether that implied CPI path shifts Fed rate expectations, and therefore dollar positioning, before CPI even drops.
Checking PPI this way gives you a preview of how CPI is likely to print and how the dollar may react when it does.
When the framework breaks: positioning, sentiment, and the limits of macro releases
Now the counterweight, and this is the most actionable part of the guide. Knowing when the macro framework is likely to fail is itself an edge, because it stops you acting on information the market has already absorbed.
The core limitation runs through everything above. Macro releases are a necessary but not sufficient framework for anticipating EUR/USD, because the same print can produce opposite reactions in different positioning environments.
Surprise relative to expectations, not the level of the data itself, is what drives currency moves.
Four failure modes recur:
- Pre-pricing: if an ECB hike, buyback increase, or inflation print is already anticipated, the actual release can produce little reaction or a reversal. The June 2026 ECB decision, aligning with analyst consensus and market pricing, is exactly this case.
- Crowded-trade reversals: when EUR-long or USD-long positioning is extreme, even a small disappointment can trigger an outsized contrarian move as traders unwind rather than extend.
- Cross-market regime shifts: an ECB hike read as threatening growth can weaken the euro if European equities sell off and capital flows to safe havens, overriding the rate-differential logic entirely.
- Data revisions and noise: PPI and CPI are subject to revisions, seasonal quirks, and energy-driven spikes, so professional forecasters lean on core figures and multi-month averages rather than single prints.
Institutional research at Deutsche Bank, ING, and Rabobank treats positioning data, CFTC reports, options skew, and flow, as an essential overlay on any macro release. The same inflation print can trigger different policy responses depending on labour market conditions, the growth outlook, and financial stability concerns.
How to check whether a release is already in the price
Before any scheduled release, three public signals tell you whether the market has already moved:
- Compare the OIS curve to consensus surveys: overnight index swap pricing shows the market-implied path for Fed and ECB terminal rates, which you can measure against the Bloomberg consensus forecast for CPI or the rate decision. A gap is where surprise potential lives.
- Read the CFTC Commitments of Traders report: this public data reveals aggregate EUR and USD positioning, telling you whether a trade is crowded and therefore vulnerable to a reversal.
- Check the options market risk-reversal skew: this shows whether traders are paying up for protection in one direction, a directional sentiment read.
Run these three checks and you sidestep the most common way retail investors lose on macro trades: acting on data the market has already priced in.
For investors wanting to understand how structural FX drivers beyond rate differentials are reshaping currency frameworks in 2026, our full explainer on AI capex and corporate FX flows details how hyperscaler procurement schedules and non-USD bond issuance are creating recurring multi-currency flows that traditional macro models are not built to capture.
Putting the three forces together before the next macro event
The value comes when you fold all three forces into one repeatable pre-event process rather than reacting to each headline in isolation. The three anchors stay the same: the ECB at 2.25% with meeting-by-meeting guidance, the Treasury buyback floor at at least USD 4 billion per operation running from 9 September through 4 November 2026, and PPI-before-CPI sequencing as a live dynamic in the August-September 2026 window.
| Macro Force | Key Signal to Monitor | Where to Find It | What a Genuine Surprise Looks Like |
|---|---|---|---|
| ECB rate path | Deposit rate vs Fed path, plus guidance tone | OIS curve, ECB statement, Lagarde press conference | Rate or guidance diverging from consensus pricing |
| Treasury buybacks | Long-end term premiums and dollar funding | Treasury announcements, long-dated yields | Operation scale or framing that shifts term premium |
| PPI-CPI sequencing | Core PPI and driving sectors | BLS releases, Bloomberg consensus | Core rebound signalling a CPI shift the market missed |
The workflow that ties it together is three steps:
- Check OIS pricing and consensus surveys to establish what is already in the price.
- Check CFTC positioning and options skew to gauge how crowded the trade is.
- Identify the asymmetric setup, where one-sided positioning, real surprise potential, and a supportive cross-market environment all line up.
These three forces explain a meaningful share of EUR/USD moves over days to weeks, but intraday volatility, geopolitical shocks, and shifting risk sentiment can overwhelm them in the short term. Use macro analysis to narrow the range of likely outcomes, not to predict a single direction with certainty.
Approach the next ECB meeting, buyback operation, or PPI print with that structured process, and you become an investor who understands macro markets rather than one simply exposed to them.
This article is for informational purposes only and should not be considered financial advice. Investors should conduct their own research and consult with financial professionals before making investment decisions. Past performance does not guarantee future results, and forward-looking market interpretations are speculative and subject to change based on market developments.