Something unusual is happening in currency markets right now. The US Dollar Index is trading below 99.00, yet US Treasury yields have actually been recovering. Under normal conditions, those two things do not happen together, and the fact that they are tells you the pressure on the dollar is coming from somewhere more structural than a routine risk-off move.
Three forces are pushing the dollar in the same direction at once, each through a completely different channel: a Treasury liquidity operation quietly compressing long-end yields, a widening gap between the Federal Reserve and other major central banks, and a market holding its breath ahead of back-to-back inflation prints this Thursday and Friday. These forces are not separate stories. They feed off one another.
After reading this, you will know which of these three forces matters most for the currency pairs you are actually watching, and exactly what to look for in this week’s inflation data that would change the entire picture. This is orientation for a multi-variable moment, not a forecast.
What the Treasury’s $6 billion bond buyback is actually doing to the dollar
Start with the piece that is hardest to see intuitively. The US Treasury runs a buyback programme, and its original scope covered repurchases of up to $6 billion in bonds maturing between 10 and 20 years. On paper, this is plumbing. The Treasury steps in as a standing buyer for older, less actively traded long-maturity bonds, which improves exit liquidity for the big institutions holding them.
That is the stated goal: better market functioning. But there is a mechanical side effect that has nothing to do with the intention. When the Treasury becomes a reliable buyer at the long end, it lowers yields there.
Here is the chain, step by step:
- The buyback creates a dependable bid in off-the-run long bonds, those older 10-to-30-year issues that trade less frequently.
- That institutional demand compresses yields at the long end of the curve.
- A narrower yield differential makes the dollar less attractive relative to currencies whose central banks are still holding or raising rates.
Follow that logic to its end and you arrive at the point on your own: the buyback is eroding the dollar’s interest-rate advantage from the inside.
The programme has since been scaled up. The Treasury is doubling per-operation sizes for 10-to-30-year securities to at least $4 billion, up from $2 billion, across both the 10-to-20-year and 20-to-30-year sectors. This expansion runs from 9 September through 4 November 2026.
The US Treasury press release confirms the expanded operation scope, specifying that per-operation sizes for 10-to-30-year securities are doubling to at least $4 billion and that the programme runs from 9 September through 4 November 2026.
The full scope: The total long-sector programme could reach up to $83 billion in repurchases over the two-month window, according to a US Treasury press release.
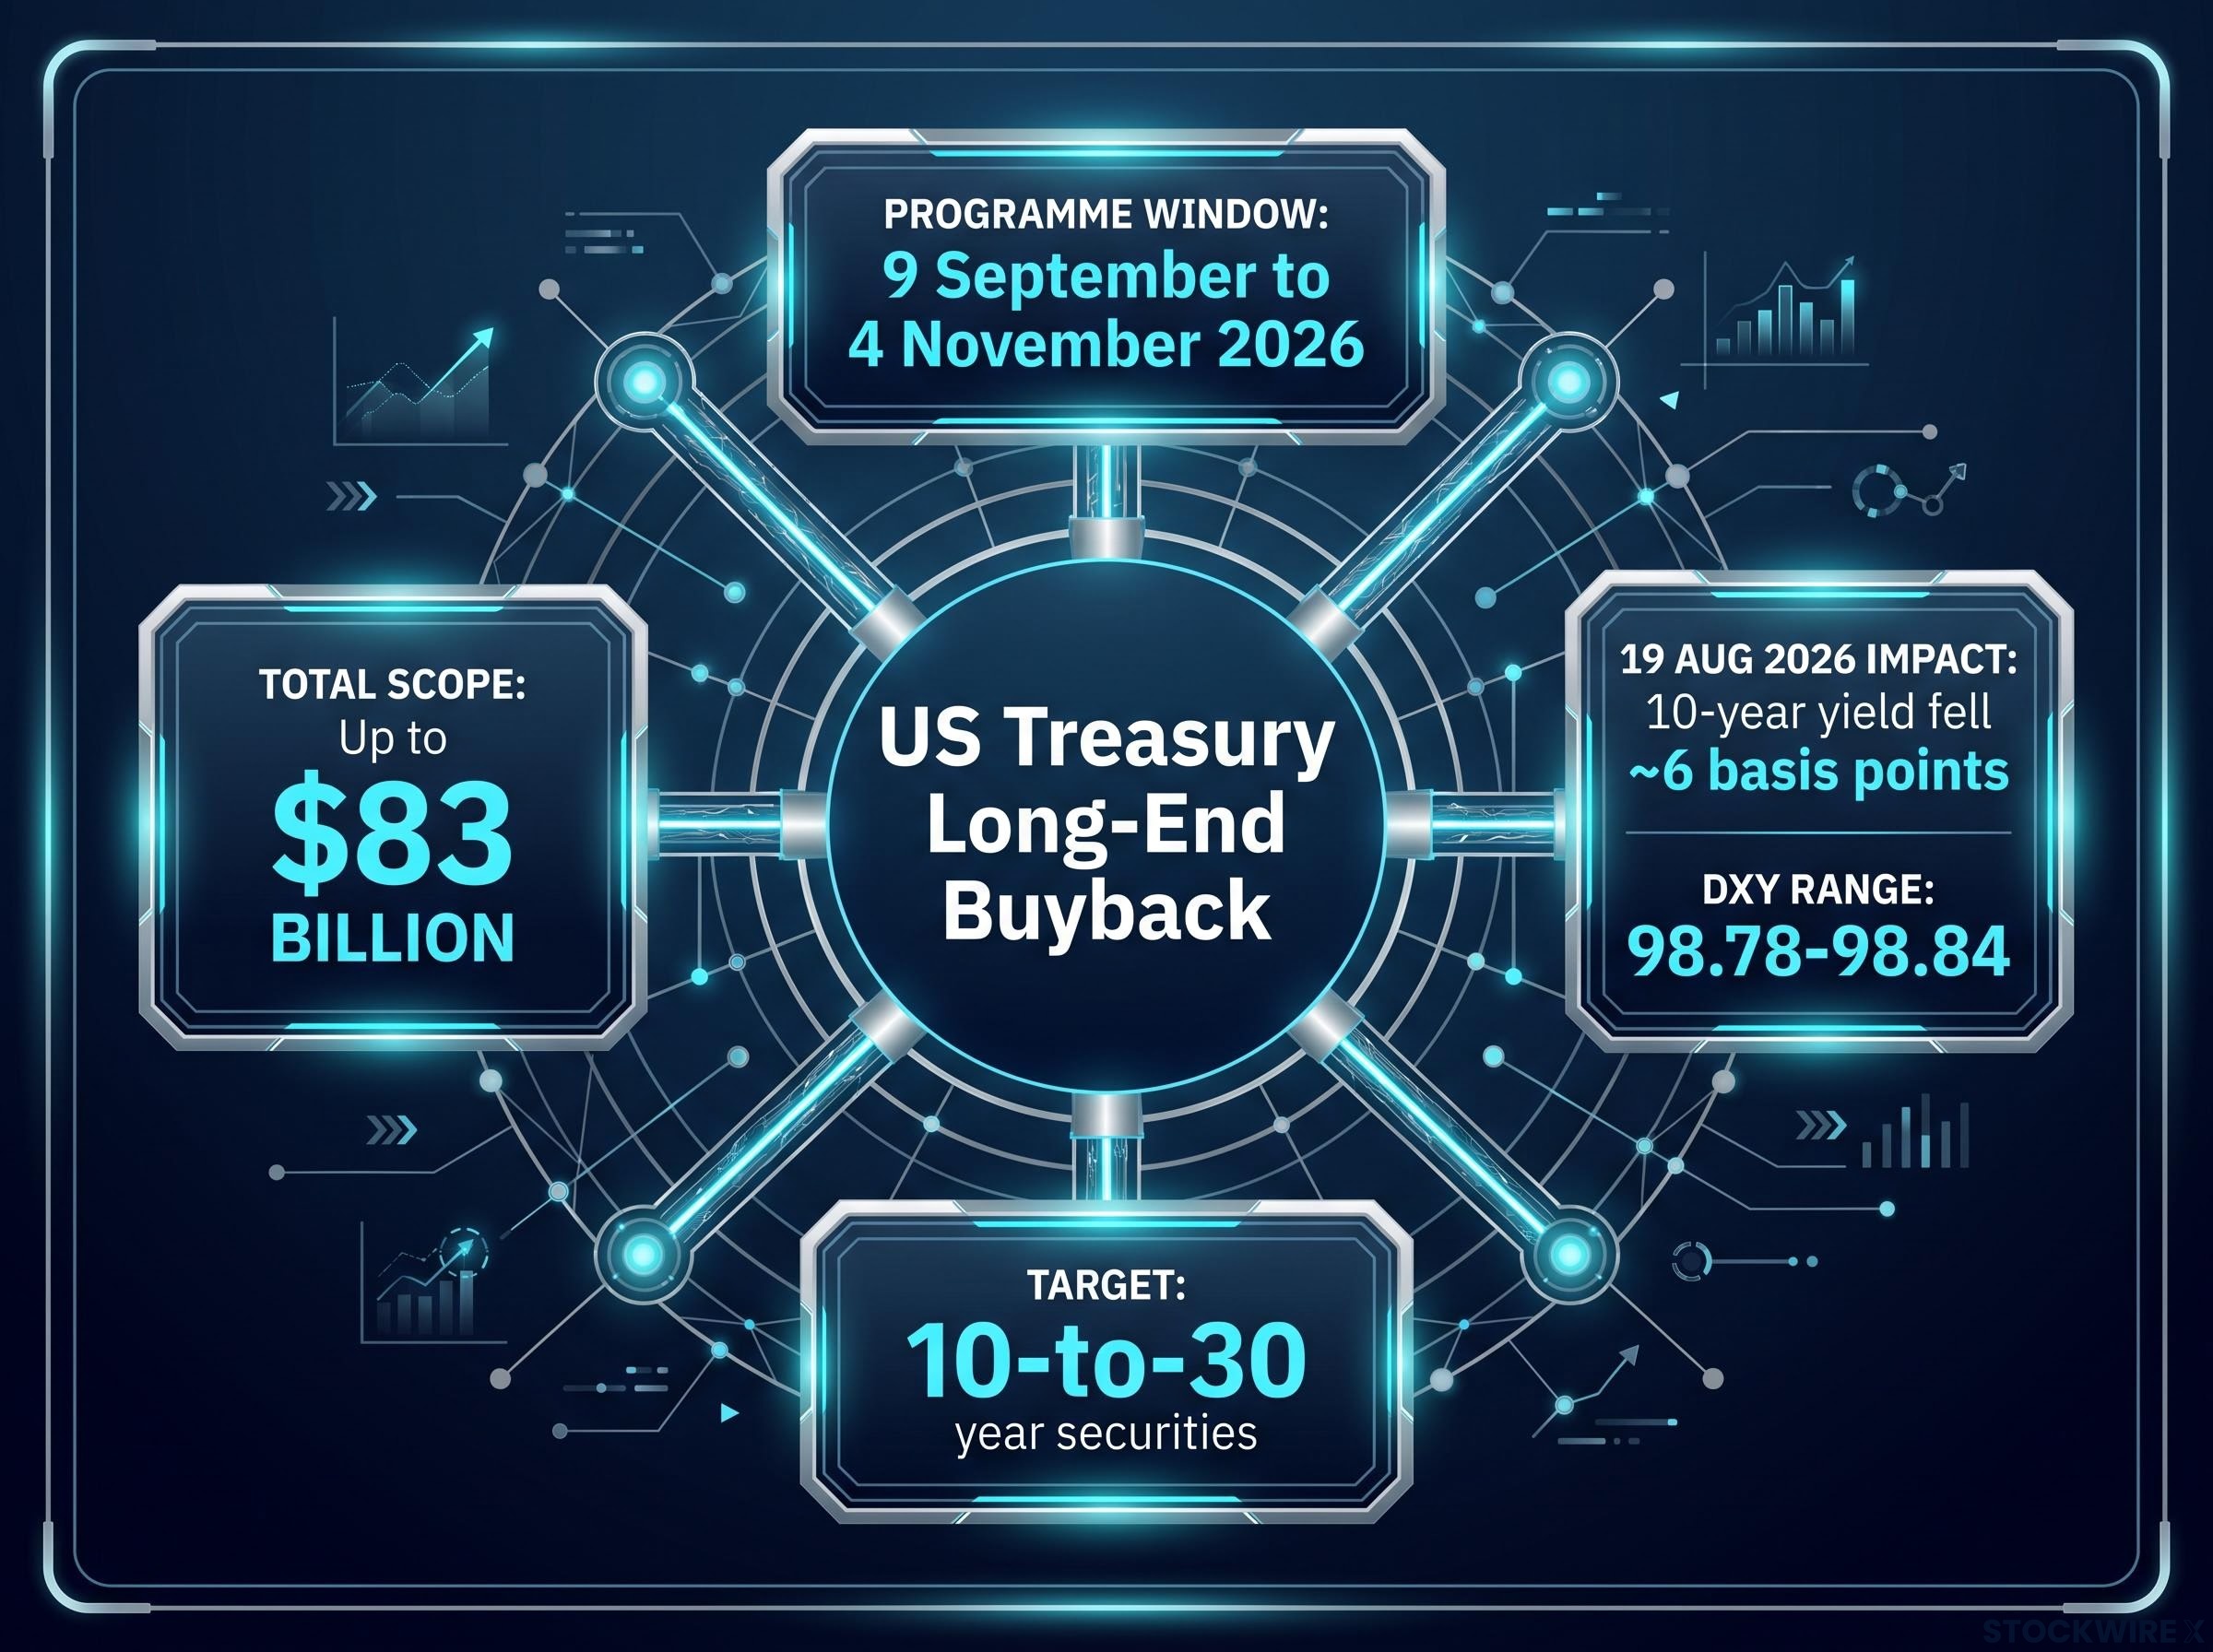
Watch what markets did with the news. Following the 19 August 2026 expansion announcement, the benchmark 10-year Treasury yield fell roughly 6 basis points almost immediately.
The market reaction to the 19 August 2026 announcement illustrates why the Treasury buyback signal matters far more than the raw dollar volume: the incremental liquidity support represents roughly 0.04% of the overall Treasury market, yet the 30-year yield fell 9-14 basis points in a single session and gold gained 3%, a cross-asset response scaled to a policy message, not a mechanical supply shift.
That reaction tells you institutional investors did not treat this as a plumbing operation. They read it as a rate-suppression signal, and that same logic is now pressing on the dollar’s yield advantage against currencies backed by central banks still in tightening mode. The DXY has settled accordingly, closing in the 98.78-98.84 range, with ICE September 2026 futures quoted around 98.73-98.80.
This matters because it explains a puzzle. The dollar can weaken even when geopolitical uncertainty might normally support it, because the buyback is a home-grown headwind that operates independently of risk sentiment.
When big ASX news breaks, our subscribers know first
How central bank divergence is amplifying dollar weakness across four currency pairs
The buyback is the abstract force. Central bank divergence is where you can see it play out in named prices.
The thesis is simple. The Fed is perceived as closer to pausing or cutting, while the European Central Bank (ECB) has been tightening, the Reserve Bank of Australia (RBA) is fuelling hike expectations, and the Bank of Japan (BoJ) is normalising policy after years of ultra-loose settings. That alignment produces a structural bid for almost everything that is not the dollar.
Global central bank divergence in mid-2026 has produced three irreconcilable policy paths: the Fed frozen at 3.50-3.75%, the ECB hiking into near-recession conditions, and the BoJ tightening faster than expected, a configuration that creates structurally distinct risk profiles across bond, equity, and currency allocations beyond the four FX pairs this article focuses on.
Look at each pair and the same pattern surfaces four times.
EUR/USD traded around 1.1590-1.1630 on 9 September, with the pair targeting multi-day highs above 1.1650. The driver is the ECB, which raised rates by 25 basis points on 11 June 2026, lifting the deposit facility to 2.25%, and has kept its focus on returning inflation to its 2% target.
GBP/USD sat around 1.3545-1.3551 on 9 September, moving broadly in sympathy with the wider dollar-down theme.
AUD/USD climbed to roughly 0.7240, its highest since early May, holding above 0.7200 through the Asian session. The direct catalyst here is rising expectation of further RBA rate hikes.
USD/JPY told the most revealing story. The pair retreated to around 153.00, a seven-month low, as the BoJ’s normalisation closes the historical policy gap with the Fed, before recovering above 153.50 on the Treasury buyback announcement.
| Currency Pair | 9 September Level | Key Driver | Fragility Condition |
|---|---|---|---|
| EUR/USD | 1.1590-1.1630 | ECB tightening, deposit rate at 2.25% | Hawkish Fed repricing narrows the rate gap |
| GBP/USD | 1.3545-1.3551 | Broad dollar weakness | Fed re-widens yield premium |
| AUD/USD | ~0.7240 | Rising RBA hike expectations | US CPI surprise revives Fed hikes |
| USD/JPY | ~153.00 | BoJ normalisation closing policy gap | Dollar catalysts trigger short-covering |
That USD/JPY bounce is worth pausing on. It recovered above 153.50 specifically on the buyback announcement, not on any change in Fed guidance. That tells you even within a broad dollar-weakness trend, individual catalysts can trigger sharp short-covering, and timing around programme announcements matters more than you might assume.
The fragility condition that could unwind all four trades at once
Each pair runs on a different central bank engine, which means a single macro event will hit them with different velocity and magnitude.
The shared vulnerability is this: divergence trades depend on the relative policy gap staying wide, not the absolute one. A single upside inflation print reprices Fed expectations and mechanically narrows that gap, regardless of what the ECB, RBA or BoJ do.
The fragility warning: Any hawkish Fed repricing compresses the divergence trade across all four pairs simultaneously.
FX strategist polls from late 2025 through mid-2026 flagged this repeatedly. The “end of US exceptionalism” narrative holds only as long as disinflation continues, both abroad and at home.
Why the CPI and PPI sequence matters more than either number alone
This week the data arrives in a deliberate order. Producer Price Index (PPI) figures come Thursday, Consumer Price Index (CPI) figures come Friday. The sequence itself carries information.
Here is the relationship. PPI measures prices at the wholesale, producer level; CPI measures prices consumers actually pay. Producer prices tend to feed into consumer prices with a lag, so the gap between the two tells you whether inflation is being absorbed upstream or passed through to households.
The most recently confirmed figures, the July 2026 datasets, show a striking divergence.
The headline versus core divergence that defined June 2026 data tells the same underlying story as the July figures: a 1.3 percentage-point gap between headline CPI at 4.2% and core CPI at 2.9% confirmed an energy-driven uptick rather than a demand-fuelled spiral, establishing the baseline against which September’s prints will be read.
| Metric | July 2026 Reading | Dollar Implication |
|---|---|---|
| Headline CPI | +3.4% year-over-year | Cooling; modestly dollar-negative |
| Core CPI | +2.5% year-over-year | Nearing target; supports rate-cut view |
| Headline PPI | +4.7% year-over-year | Hot; latent upside pressure |
| Core PPI | +4.7% year-over-year | Unabsorbed pipeline inflation |
Headline CPI rose just 0.1% month-over-month in July after a 0.4% decline in June, landing at 3.4% year-over-year. Headline PPI was flat at 0.0% month-over-month, but core PPI rose 0.4% month-over-month and held at 4.7% annually.
The core spread: The gap between core PPI at 4.7% and core CPI at 2.5% is a 220 basis point spread of unabsorbed upstream inflation.
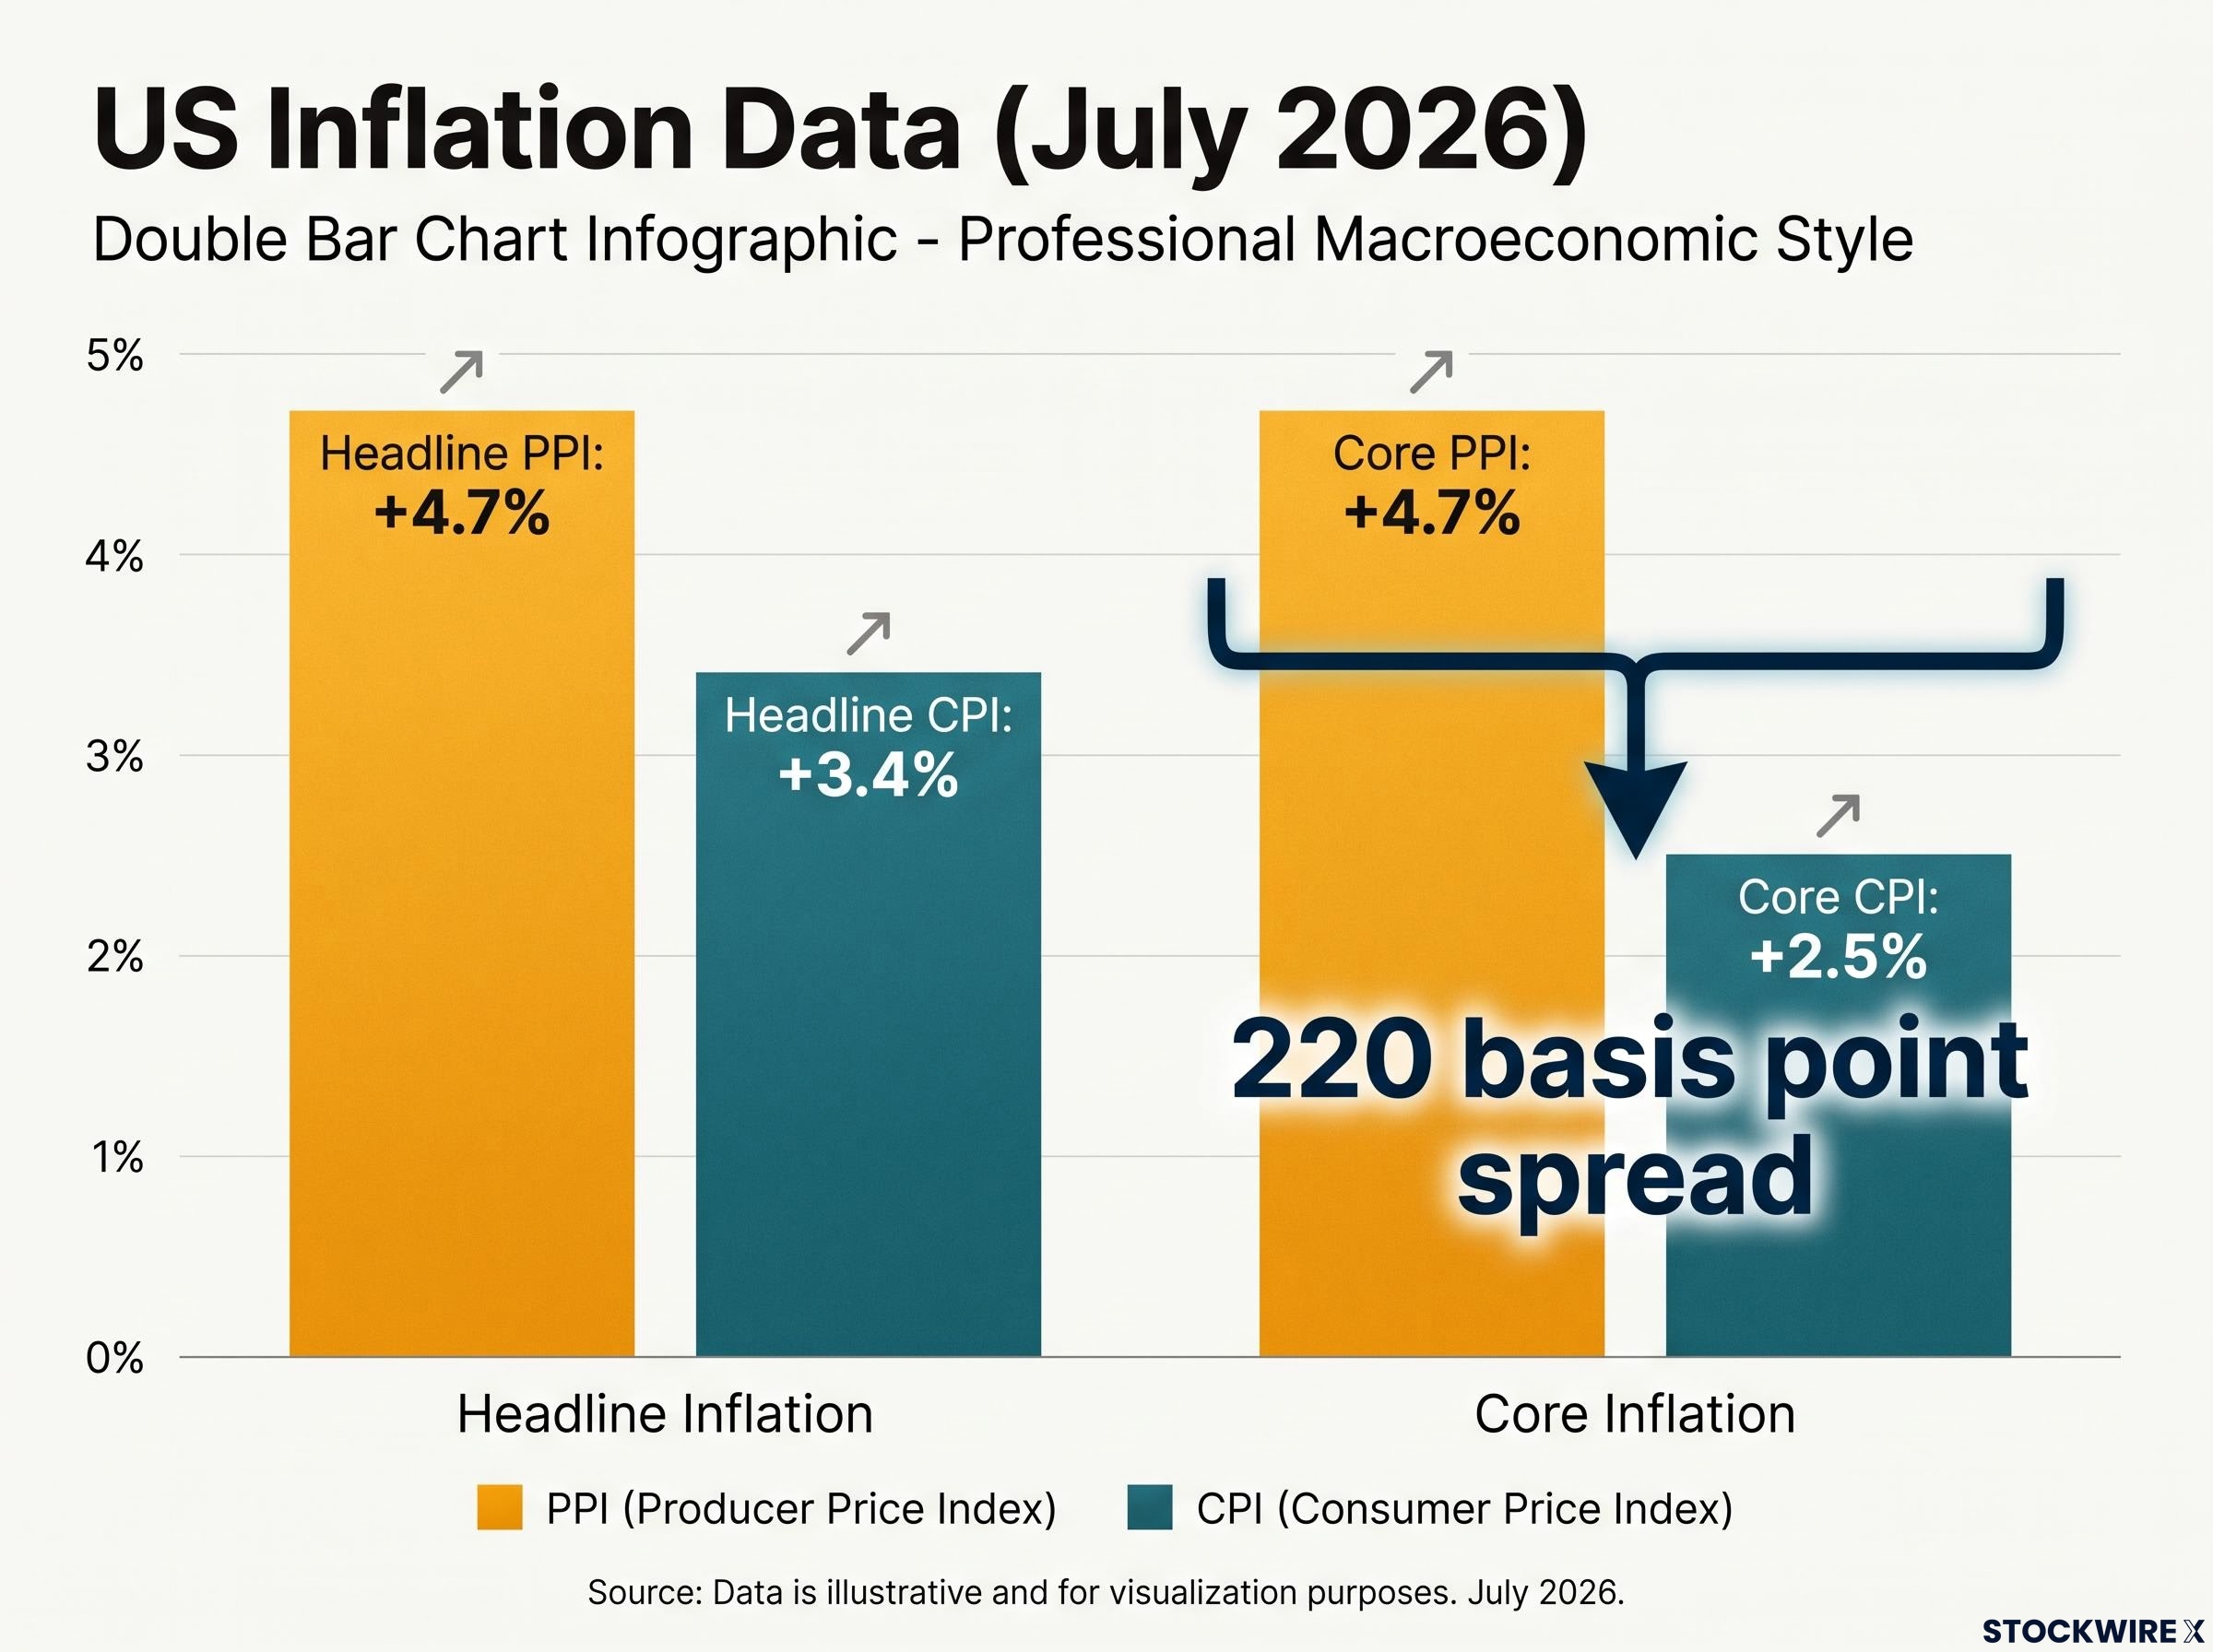
That spread means businesses are currently eating margin pressure rather than passing it on. Any sign in the September prints that pass-through is accelerating would be the single most dollar-bullish data signal in the current environment.
This is why reading them in sequence beats treating each as a coin flip. Here is the framework for Thursday and Friday:
- PPI falls and CPI holds. Pipeline pressure is easing without hitting consumers. Dollar-negative, it confirms the disinflation story.
- Both rise together. Inflation is broadening and pass-through is happening. Strongly dollar-positive, it revives Fed hike odds.
- PPI rises but CPI disappoints. The spread widens further; margin compression continues but the pass-through has not arrived yet. Ambiguous, and the market leans on Friday’s CPI to break the tie.
Knowing this turns a two-day data window into a structured sequence. You read Thursday’s PPI first, then interpret Friday’s CPI in light of it, rather than reacting to two isolated numbers.
The structural case for dollar weakness beyond this week’s data
Step back from the data calendar and a longer architecture comes into view. The current pressure is not just a pre-CPI positioning trade. It is part of a wider shift often described as the end of US yield exceptionalism.
The thesis runs like this. The structural yield advantage that powered dollar strength in 2022-2023 depended on the Fed being far ahead of everyone else. As global growth firms and foreign central banks hold or tighten, that gap converges, and the special appeal of dollar assets erodes with it.
The buyback belongs to this story too. An $83 billion long-end liquidity operation running through 4 November is a persistent yield-suppressive backdrop, not a one-week event.
The cyclical evidence supports the direction. FX strategist polls through late 2025 and 2026 repeatedly cited Fed independence concerns and softer labour data, including jobs declines in early July and August 2026, as the main drags on the dollar’s yield advantage. The DXY holding below 99.00 in the 98.73-98.84 range reflects that positioning.
The persistent floor: The buyback programme creates a yield-suppressive ceiling on the dollar that runs through 4 November, independent of any single data print.
The two-month duration is the point to hold onto. Even if this week’s CPI comes in hot and sparks a dollar bounce, the structural compression stays in place through early November and will keep capping any sustained recovery.
Four conditions that would flip the dollar’s trajectory
The narrative is real, but it is not unbreakable. Four specific conditions would reverse it:
- An upside CPI or PPI surprise. Hotter prints revive Fed hike expectations and re-widen the yield premium overnight.
- A hawkish Fed guidance shift. Sparse forward guidance leaves room for a repricing if the Fed signals a more aggressive path than markets expect.
- Geopolitical escalation. The dollar keeps its safe-haven role; recent flashpoints have spiked the DXY to multi-month highs on demand for shelter.
- Fiscal or trade policy resolution. Reduced uncertainty around US trade and fiscal discipline could rapidly support the currency.
These are not equally likely. Given the data calendar, the upside inflation surprise is the most proximate and immediately testable risk of the four.
Reading this week’s data with a framework, not a forecast
The three forces now connect into one usable map: the buyback compressing long yields, central bank divergence widening the non-dollar bid, and the inflation sequence testing whether that picture holds. Over the next 48 hours, they resolve together.
This is not a directional call on the dollar. It is a map of which inputs matter most and in what order to read them.
- Read Thursday’s PPI against the July core PPI baseline of 4.7%. A cooler print eases the pipeline pressure; a hotter one raises the pass-through risk.
- Read Friday’s CPI against the July core CPI baseline of 2.5%, then check whether it converges with or diverges from Thursday’s PPI signal.
- Overlay the ECB’s 11 September rate decision on EUR/USD as a confirmation or contradiction of the divergence thesis.
The convergence of the ECB decision, US PPI and US CPI inside one 48-hour window means you are watching a correlation test, not a single event. If all three confirm the divergence narrative, the move in EUR/USD will be far more durable than any one data point could produce alone.
The framework’s value: Its worth is in identifying which data combinations would change the structural case, not in predicting outcomes.
The consensus leans toward broad dollar weakness. But as this piece has shown, that consensus rests on conditions that can be invalidated fast, which is precisely why a framework beats a forecast right now.
For investors wanting to model how this week’s CPI outcome would interact with options positioning, our full explainer on DXY at 100 examines the concentrated option strikes, stop-loss clusters, and algorithmic triggers that amplify macro catalysts when the dollar index trades near that mechanically loaded level.
This article is for informational purposes only and should not be considered financial advice. Investors should conduct their own research and consult with financial professionals before making investment decisions. Past performance does not guarantee future results, and financial projections are subject to market conditions and various risk factors.