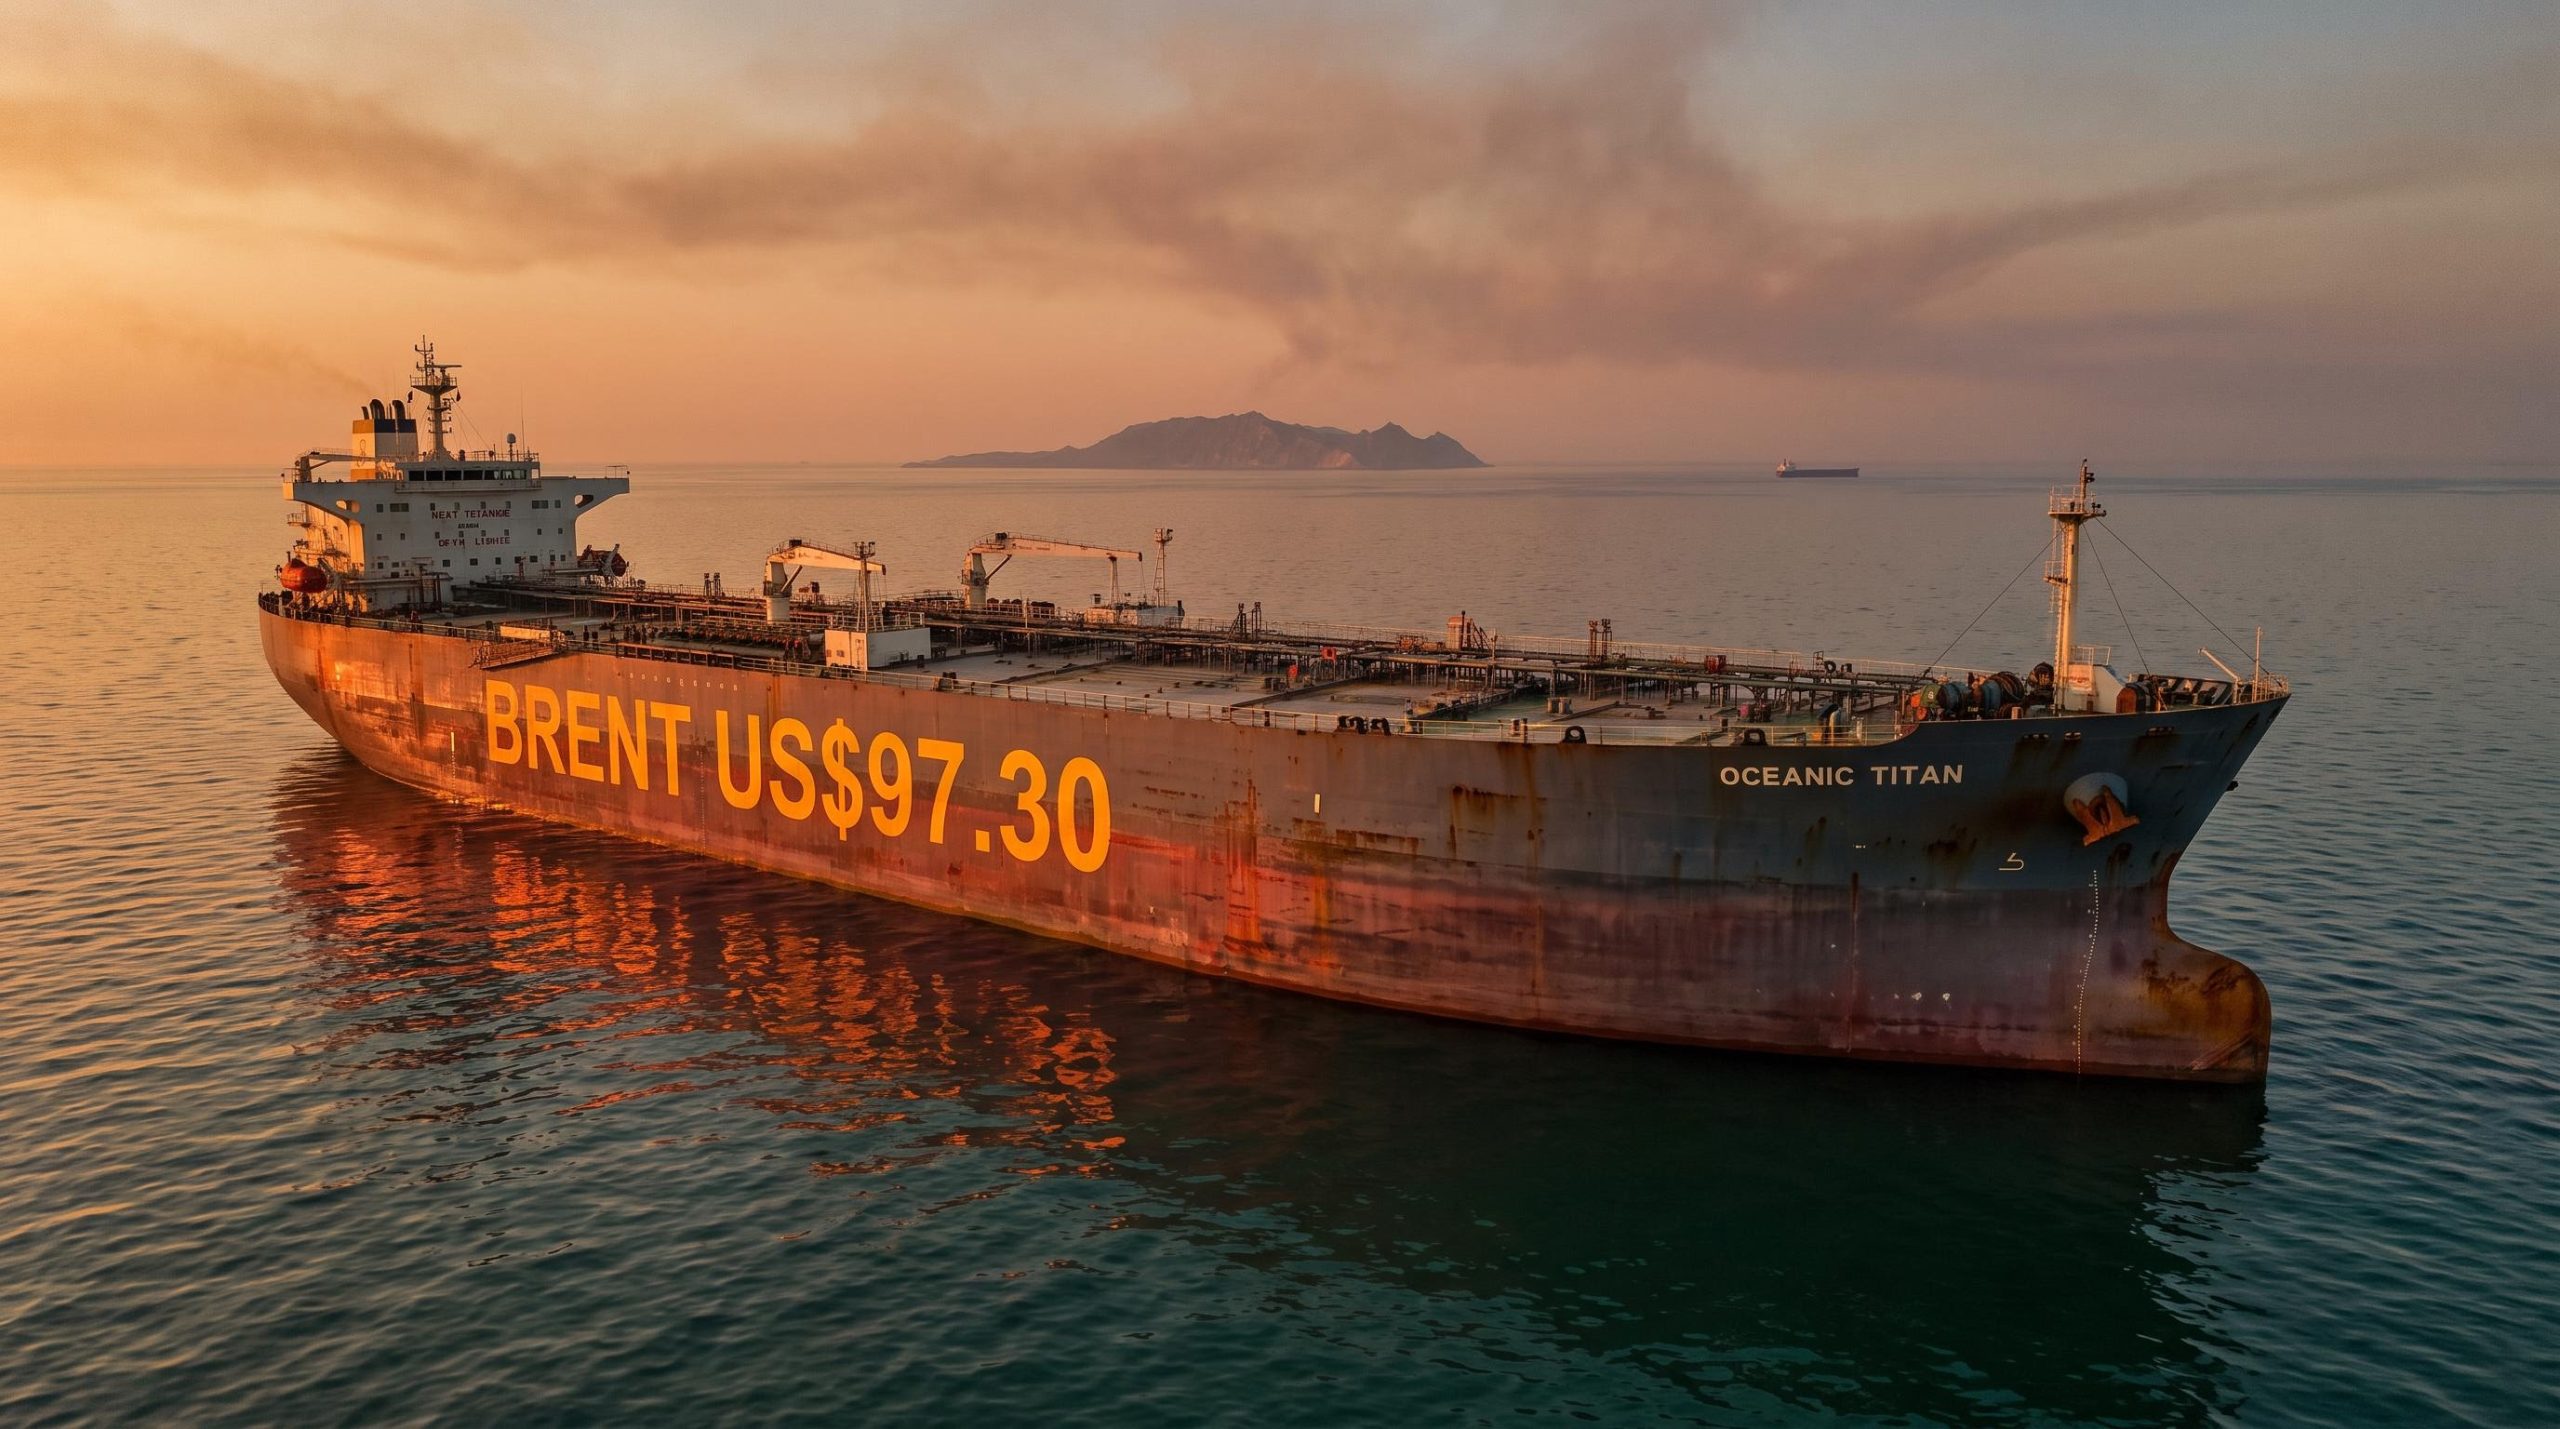
Brent crude traded at US$97.30 per barrel during the overnight session on Monday 7 September 2026, up 1.5%, after a weekend of military exchanges between the United States and Iran targeting Gulf shipping routes. In the same session, copper set a fresh record on the London Metal Exchange (LME).
Two records, one trading day. One driven by a physical supply disruption in the world’s most important oil corridor, the other by a structural squeeze that has been tightening for the better part of a year.
That combination is what makes this session unusual. Oil at this level reflects barrels that cannot move, not a fleeting sentiment trade. Copper at a record reflects industrial demand meeting the lowest exchange inventories in months.
For anyone holding Australian resource stocks or watching the ASX open on Tuesday, the two moves point in the same direction. Here is what changed in commodity markets over the weekend, what is actually driving each move, and what it means for energy and copper names on the local market.
What the weekend’s US-Iran strikes did to oil markets
The escalation came in three parts reported on 1 September 2026. US forces struck Iran’s Larak Island, a site used to support Iranian maritime activity. Iran hit two tankers leaving the Strait of Hormuz and launched strikes on bases used by US forces in Jordan.
Each of those actions targeted the same chokepoint. The Strait of Hormuz carries roughly 20% of global oil and liquefied natural gas trade under normal conditions, and it has been severely disrupted since the US-Iran war broke out in late February 2026.
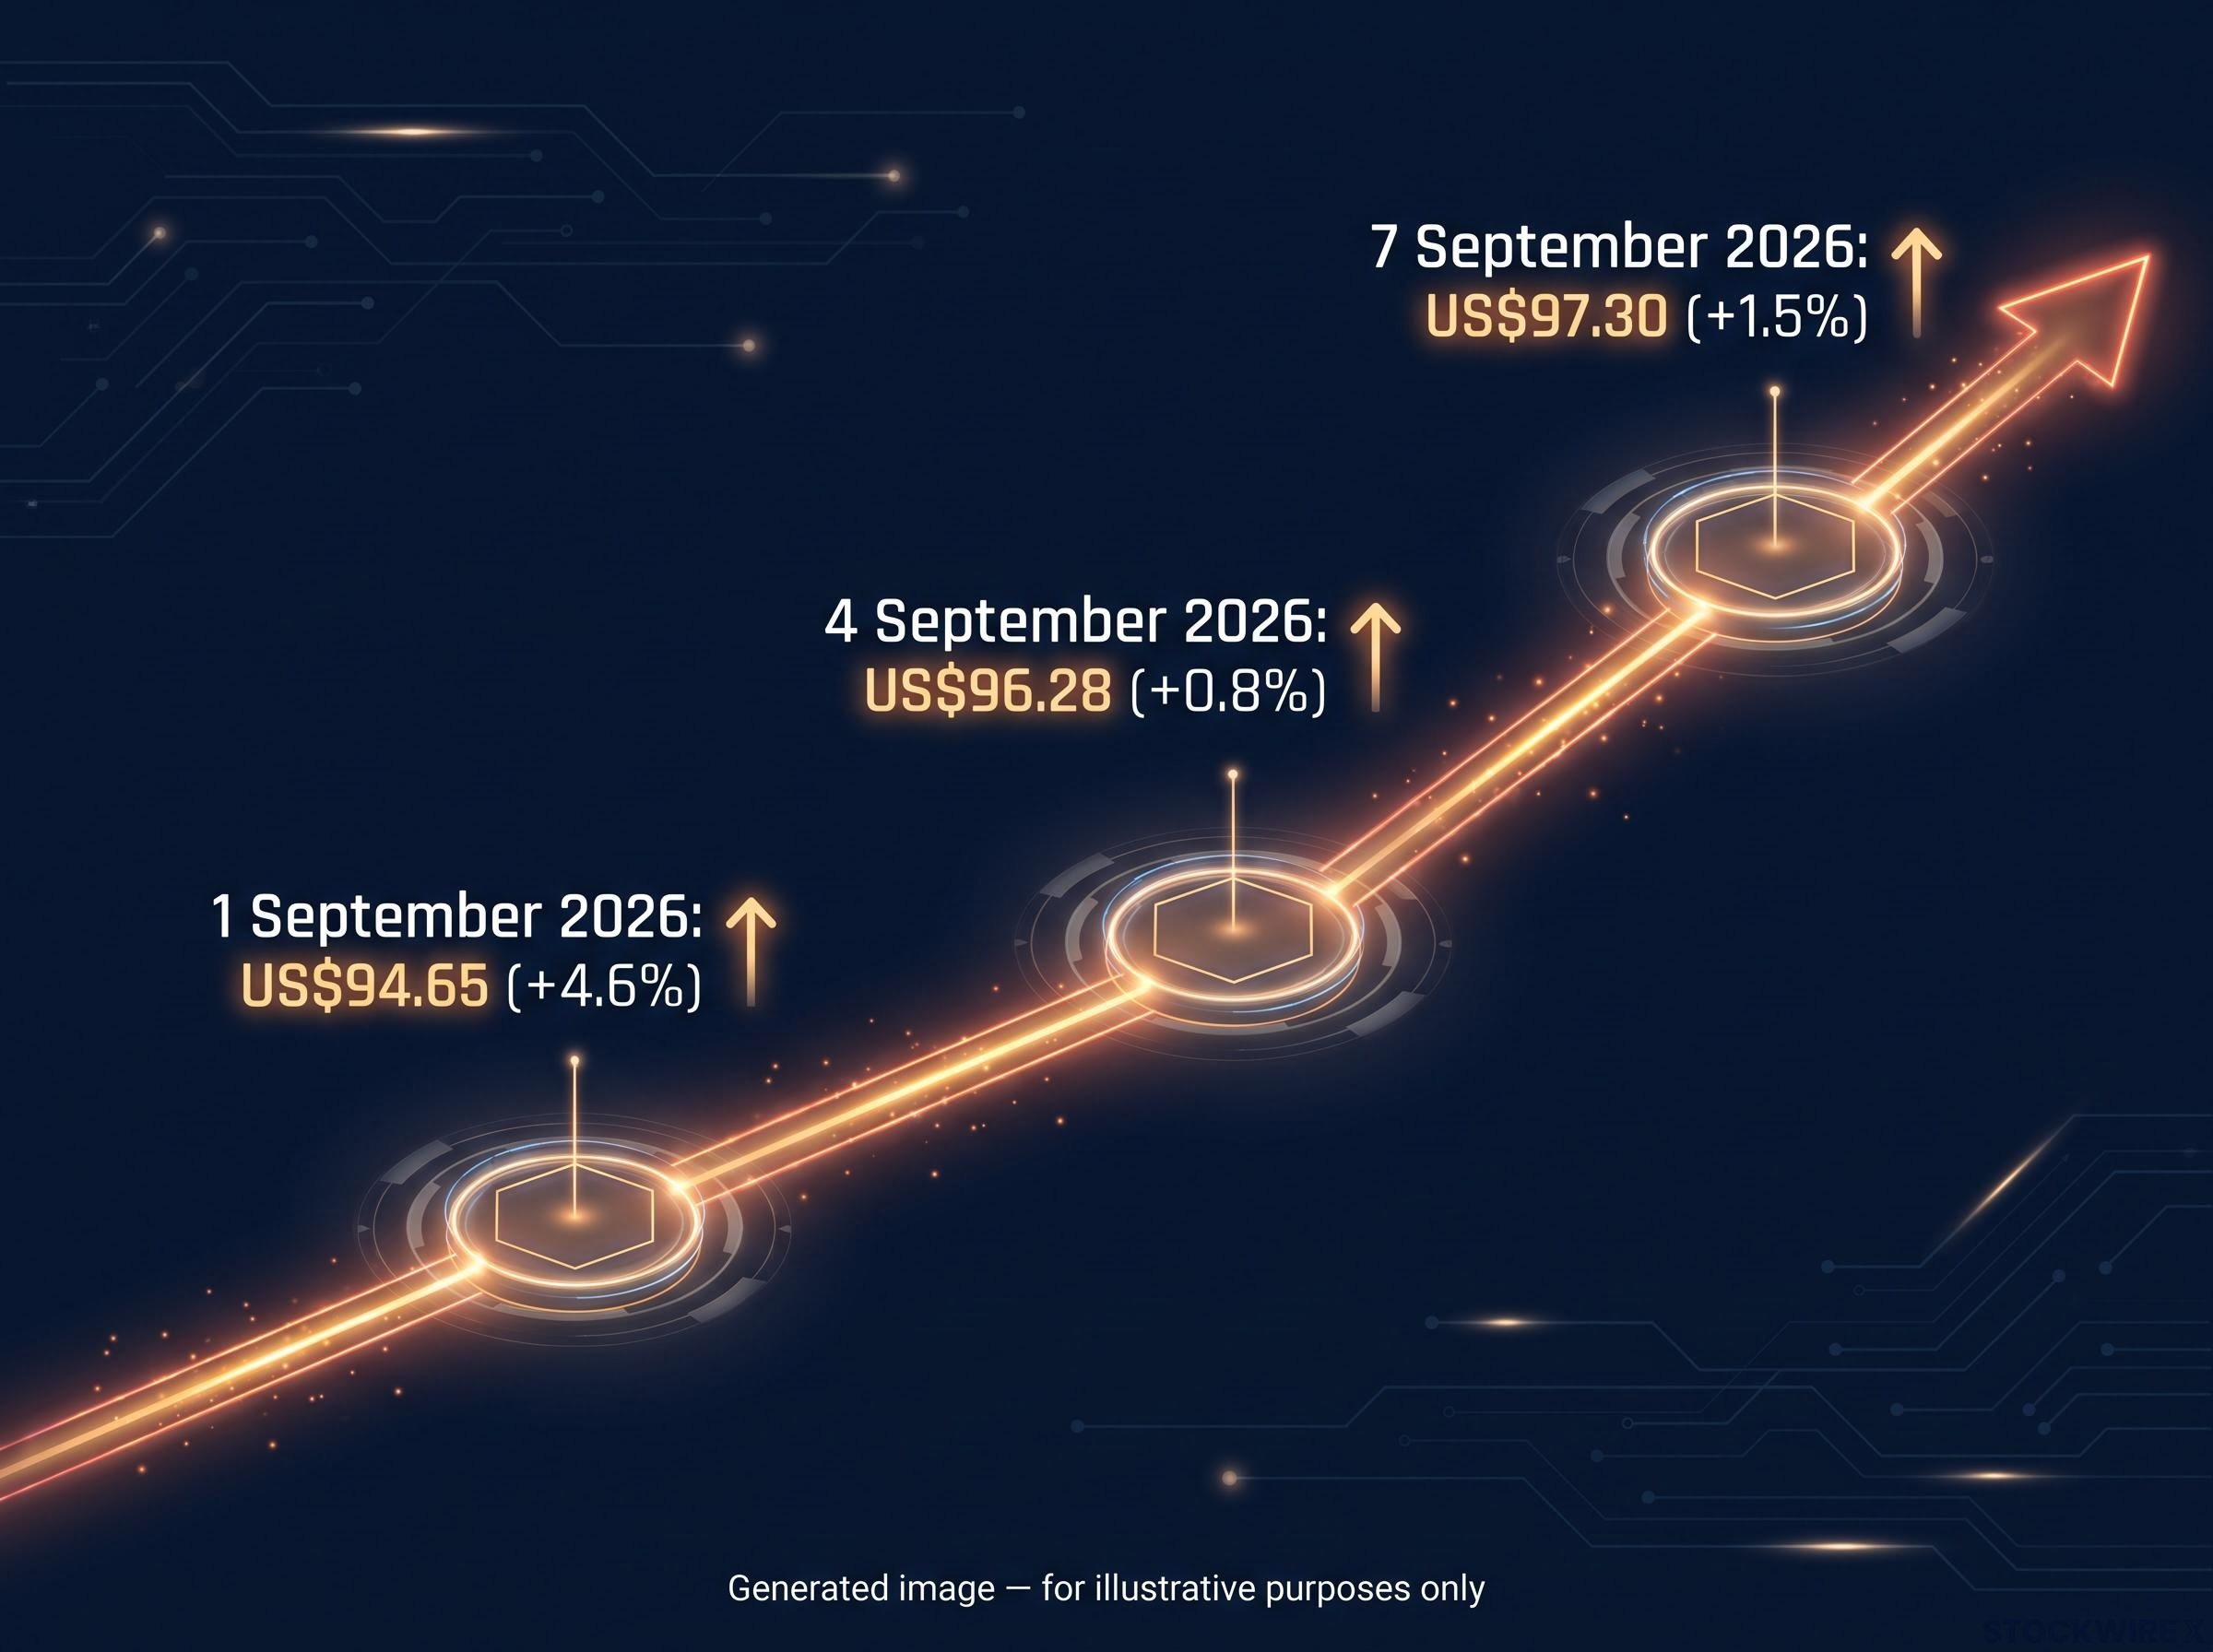
The price trajectory tells the story of a supply squeeze building session by session, not a one-off spike:
- 1 September 2026: Brent rose US$4.16 (4.6%) to US$94.65 after renewed strikes and reports of two tankers hit near Hormuz (Reuters).
- 4 September 2026: Brent settled at US$96.28, up 0.8% on the day (Reuters).
- 7 September 2026: Brent traded at US$97.30, up 1.5% overnight after the weekend exchanges.
The disruption is measurable in vessel traffic. Reuters reported on 17 July 2026 that only three commodity vessels crossed the Strait of Hormuz in a single day, the fewest since May, as attacks and a resumed US blockade largely halted movement through the route.
Hormuz shipping data published in mid-August 2026 showed commercial transits running at just 5-12% of pre-war capacity, with war-risk insurance premiums at roughly 30 times normal rates and maritime unions classifying the strait as an active war zone, conditions that no ceasefire declaration alone can reverse.
Analysts from UBS and Saxo Bank, cited by Reuters, argued that global inventories were already declining and the market was tight before this weekend, meaning fresh tensions add a risk premium on top of an undersupplied base.
“US strikes and the prospect of Iranian retaliation raise the prospect of damage to energy infrastructure around the Gulf and add fresh uncertainty for shipping through the Strait of Hormuz,” said Tim Waterer, chief market analyst at KCM Trade, whose assessment was reported by CNBC on 1 September 2026.
The read for you is straightforward. The oil price is not pricing a single weekend event; it is pricing an ongoing conflict that has structurally degraded one of the world’s most critical shipping routes. Every further escalation adds price risk on top of an already-elevated floor, which is why the conflict timeline now matters as much as the price chart for anyone holding energy exposure.
When big ASX news breaks, our subscribers know first
Copper’s LME record and what is actually driving it
Monday’s copper record did not arrive out of nowhere. It sits at the top of a sequence of new highs stretching back to January 2026, when the metal first broke above US$13,000 per tonne and then kept climbing.
Two distinct forces are behind the move, and separating them matters for judging how durable the price is.
The first is trade flow. A US tariff threat has pulled copper toward American ports, draining LME warehouses in the process. CruxInvestor noted that US copper imports hit a 12-year high, cutting LME stocks by 14% and pushing delivery premiums higher.
The second is structural demand: electrification, AI infrastructure build-out, and the broader energy transition, all against a backdrop of negative mining growth. Analysis from Gate.com attributed the record to this structural tightening, with treatment charges (the fees smelters earn to process ore) sitting at all-time lows and inventories at multi-year lows.
The copper market deficit underpinning Monday’s record is now independently confirmed by UBS, Goldman Sachs, and J.P. Morgan, with refined shortfalls for 2026 estimated at 300,000 to 600,000 tonnes; benchmark treatment charges have turned negative, a real-time physical signal that concentrate scarcity is already present rather than merely projected.
| Date | LME Copper (US$/tonne) | Notable event | LME inventory |
|---|---|---|---|
| 29 January 2026 | US$14,527.50 intraday | All-time high, largest single-day rise since 2008 (Benchmark Minerals) | Not specified |
| 25 August 2026 | US$14,343 intraday | Record close amid 65,400-tonne withdrawal (Reuters) | ~90,000 tonnes available |
| 7 September 2026 | New record (level unspecified) | Fresh LME record on same session as oil spike | Structurally low |
Why inventories and treatment charges matter
Available LME inventories dropped to around 90,000 tonnes after withdrawals of 65,400 tonnes, per Reuters on 25 August 2026. ING analysts Ewa Manthey and Warren Patterson noted inventories at their lowest since February and a soaring cash-to-three-month premium, a signal of acute near-term scarcity.
For an investor in ASX-listed copper producers, that combination changes the risk calculus. Record-low treatment charges and record-low exchange inventories signal that the price support is structural, not speculative, which gives this record a more durable foundation than a sentiment-driven rally would have.
ASX energy and copper stocks in the frame
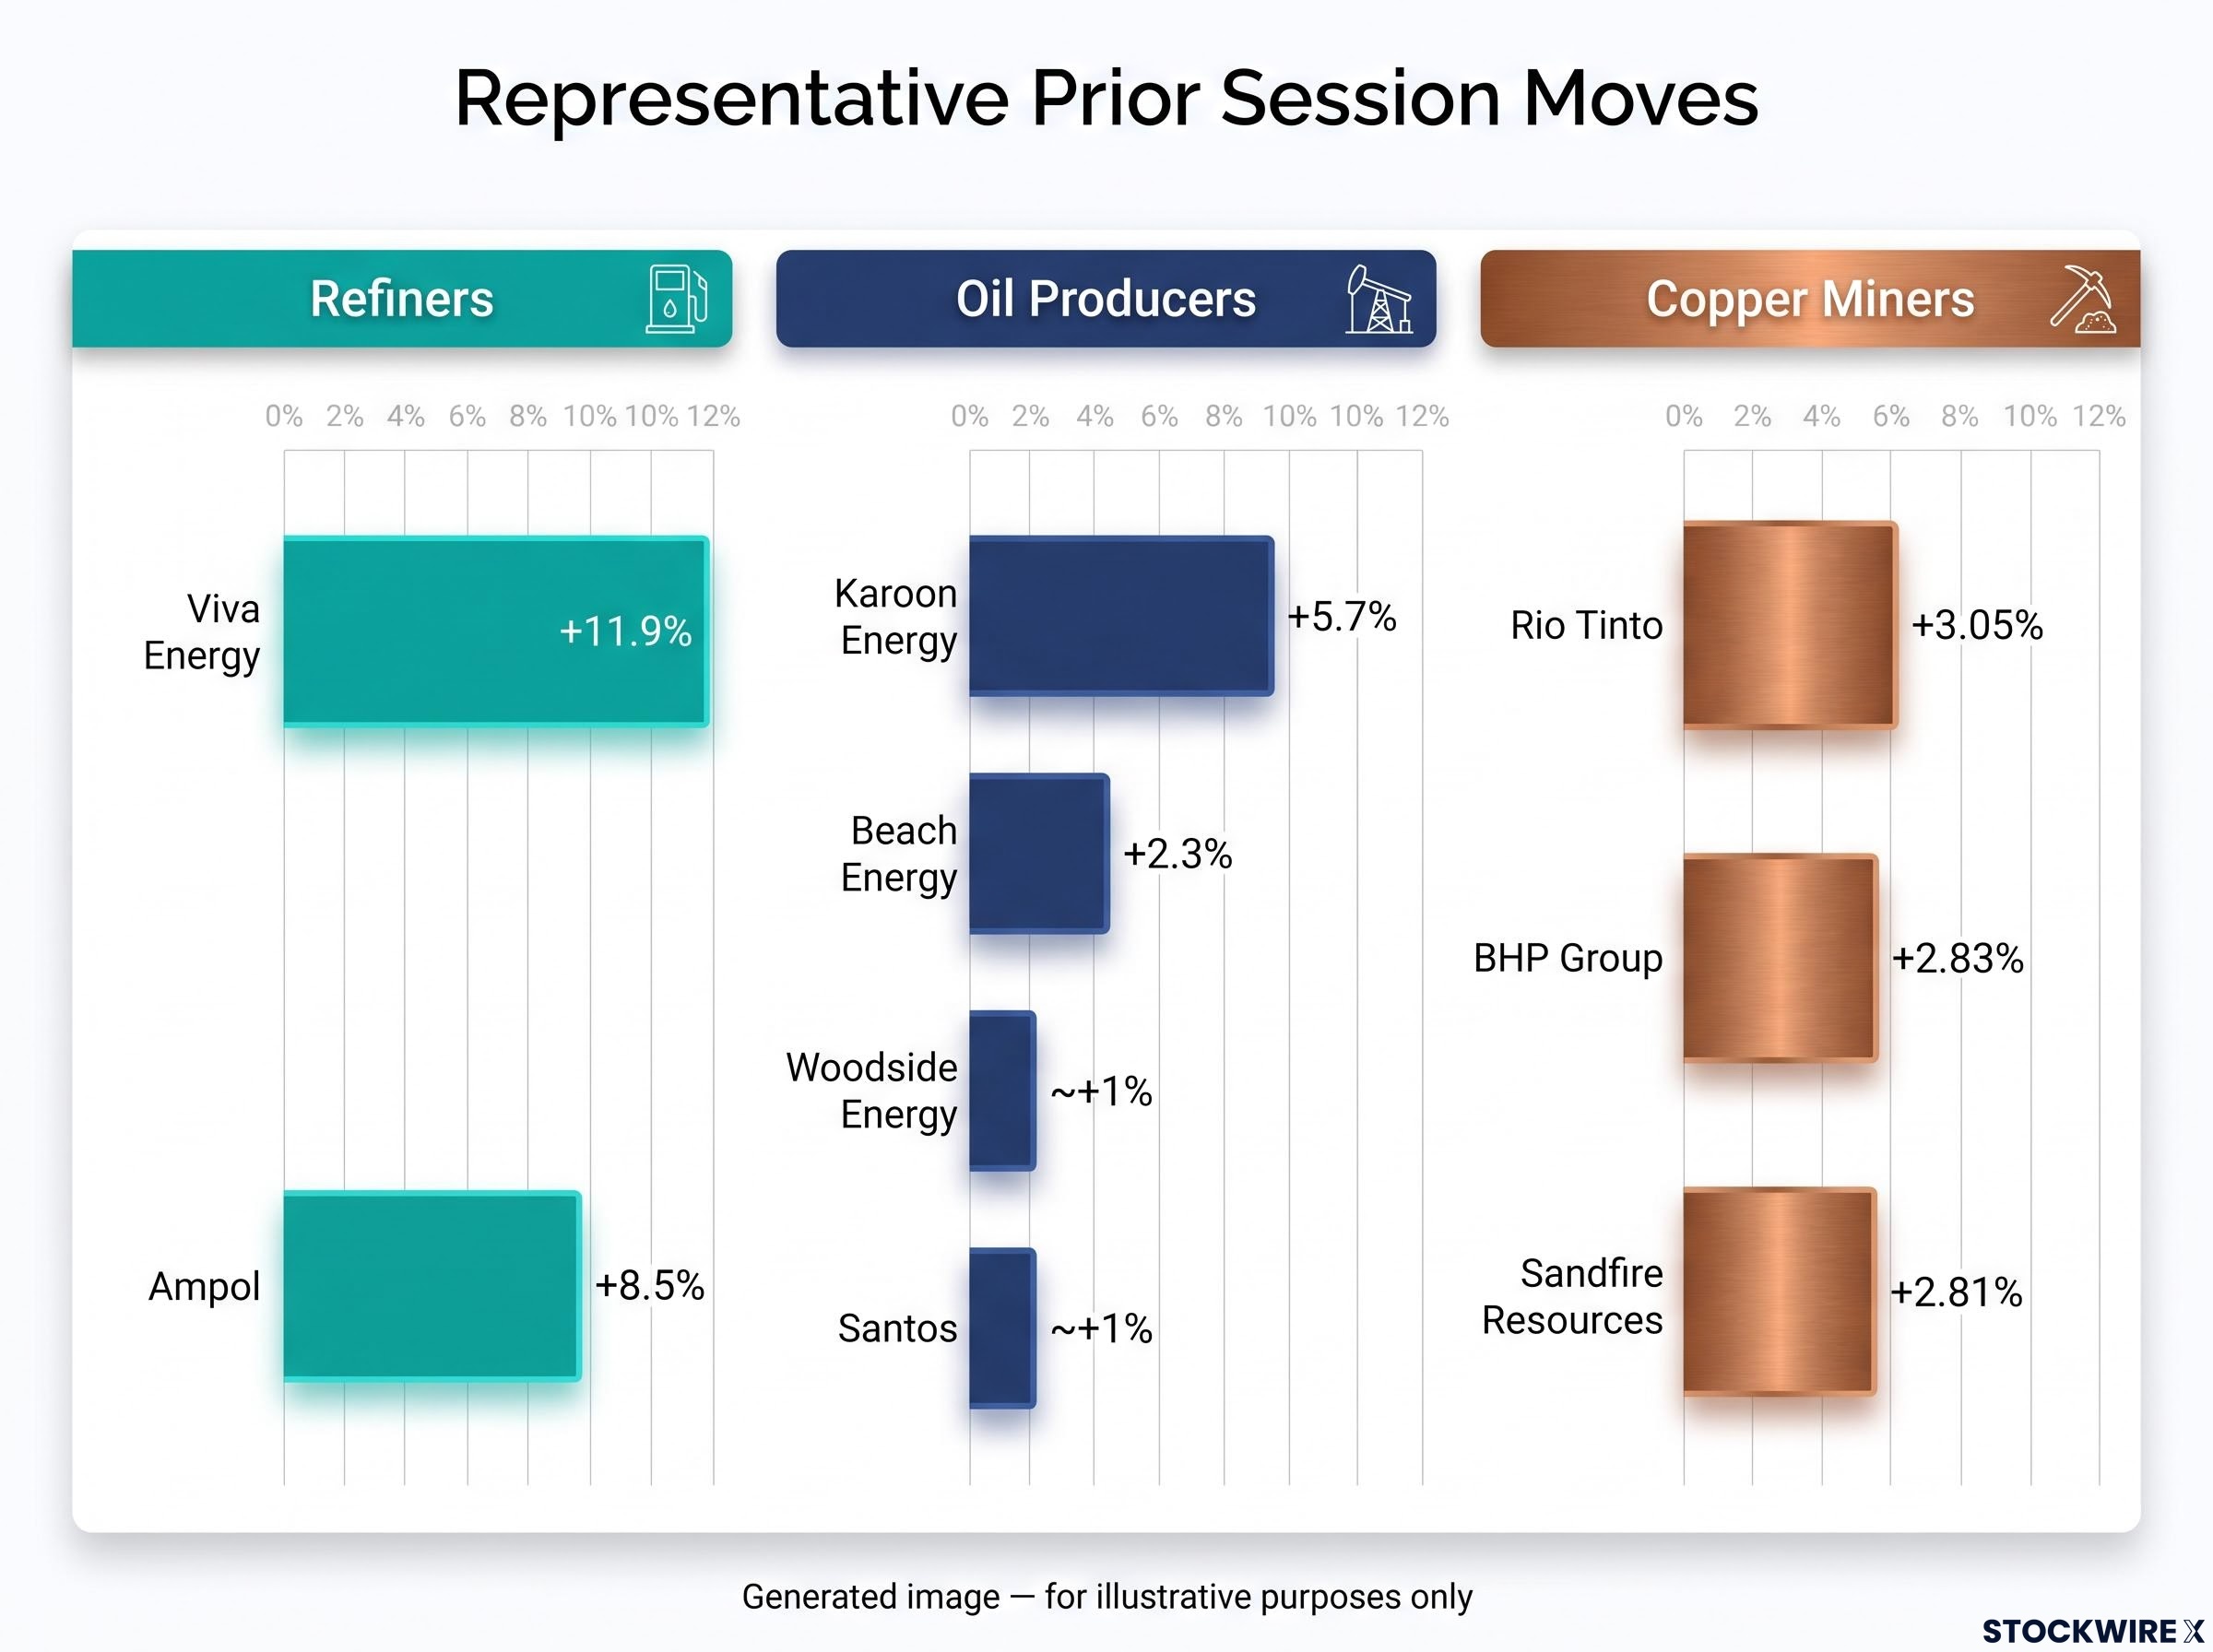
The global price signal has a direct local consequence, and prior sessions give you a clear read on which names move and by how much.
On the energy side, Woodside Energy and Santos are the most cited beneficiaries, with the Australian Financial Review noting roughly 1% gains for both during a comparable session on 21 July 2026. Smaller producers moved harder: ABC News reported Karoon Energy up 5.7% and Beach Energy up 2.3% during the major oil spike session on 13 July 2026.
The refiners are a separate sub-story. Viva Energy and Ampol benefit through margins rather than pure production exposure, and the moves have at times been larger. The Sydney Morning Herald recorded Viva up 11.9% and Ampol up 8.5% during a major oil event on 5 March 2026.
On the materials side, Motley Fool Australia captured the copper read-through during a rally session on 12 May 2026:
| Stock | Exposure type | Representative prior session move |
|---|---|---|
| Woodside Energy | Oil producer | ~+1% (AFR, 21 Jul 2026) |
| Santos | Oil producer | ~+1% (AFR, 21 Jul 2026) |
| Karoon Energy | Oil producer | +5.7% (ABC, 13 Jul 2026) |
| Beach Energy | Oil producer | +2.3% (ABC, 13 Jul 2026) |
| Viva Energy | Refiner | +11.9% (SMH, 5 Mar 2026) |
| Ampol | Refiner | +8.5% (SMH, 5 Mar 2026) |
| BHP Group | Copper miner | +2.83% to A$59.98 (Motley Fool, 12 May 2026) |
| Rio Tinto | Copper miner | +3.05% to A$185.27 (Motley Fool, 12 May 2026) |
| Sandfire Resources | Copper miner | +2.81% to A$19.05 (Motley Fool, 12 May 2026) |
At the index level, the moves have been broad rather than isolated:
- ASX Energy sector up 1.8% on 13 July 2026 (ABC News).
- S&P/ASX 200 Energy Index up 1.98% on 14 July 2026 (Sharetrader.com.au).
The AFR noted on 21 July 2026 that energy and materials were the only ASX sectors higher during a day when copper surged and oil sat elevated. The pattern across those sessions suggests the move is likely to be broad, which means an investor with diversified resources exposure may see tailwinds across both energy and materials holdings at once.
ASX sector rotation during the February to March 2026 oil shock produced a 63-percentage-point spread between the best and worst performers, with the Energy index gaining 16.1% while gold, uranium, and copper stocks accounted for 19 of the 20 worst-performing ASX 200 names, a reminder that commodity price direction and equity performance can diverge sharply depending on which part of the resource complex is moving.
What could reverse the rally, and how fast
The downside case is not a hedging formality. It has a documented precedent from just weeks ago.
In late July 2026, oil fell 8-9% in a single stretch when the US abruptly paused air strikes on Iran. Brent dropped 4.9% to US$92.02 on Sunday 26 July, then a further 8.7% to roughly US$88.36 the next day (AP and Reuters).
The trigger was a headline, not a fundamental shift. The de-escalation risk here is asymmetric, and the timeline shows how fast a risk premium can deflate:
- Late July 2026: The US paused air strikes on Iran, raising hopes of a diplomatic solution.
- 27 July 2026: President Trump commented on “good talks” with Iran, and Brent fell 9% to below US$88, having traded above US$100 the week before (The Guardian).
- 28 July 2026: Brent settled near US$88.36 as the strike pause held (Reuters).
- Late August to early September 2026: Re-escalation returned prices to the current US$97 region.
“Part of the rally is a weekend risk trade on tanker attacks and stalled cease-fire talks,” said Andrew Lipow of Lipow Oil Associates, whose comments were reported by Reuters on 14 August 2026, implying that portions of the premium are headline-driven rather than reflecting a permanent shortage.
There is also a floor to consider. A Reuters poll found analysts broadly expect Brent above US$80 per barrel in 2026 regardless of near-term moves, given ongoing shipping disruption, while CNBC reported on 9 March 2026 that some analysts see scope for Brent above US$110 under sustained war conditions. Copper carries its own caveat: Benchmark Minerals noted the 29 January all-time high of US$14,527.50 was short-lived, with prices falling sharply before that session closed.
The July precedent is the data point to hold onto. A premium large enough to push oil above US$100 vanished in a single trading window, which means the current level carries real event risk in both directions. The floor may be structurally elevated, but the ceiling is set by headlines, not fundamentals.
How exposed is Australia, and what to watch next
Australia sits on the favourable side of this configuration. As a major copper exporter and oil producer, it captures revenue upside from both moves, a dynamic Mining Australia framed as an export windfall for the country’s terms of trade.
The scale of the oil shock underlines that upside. The World Bank characterised the 2026 Strait of Hormuz disruption as the largest oil market shock in history, with Brent rising roughly US$46 per barrel in March 2026 alone.
The World Bank Commodity Markets Outlook from April 2026 documented the near cessation of Strait of Hormuz shipping as the largest oil supply shock on record, with Brent climbing from US$72 at end-February to US$118 at end-March, a move that frames the current US$97 level as elevated but still below the conflict’s peak.
Whether the current position holds depends on the conflict, not the price chart. Analysts estimate a full Hormuz closure would remove 8-10 million barrels per day of crude, with limited alternative infrastructure able to offset a complete shutdown (Reuters, March 2026). Rystad Energy’s Jorge León noted that once export routes are restored, existing spare capacity can be deployed more effectively, moderating prices from current levels.
Here is the forward watch-list that will move both commodities from here:
- Strait of Hormuz shipping data and any resumption of tanker traffic.
- US-Iran diplomatic signals from Washington or Tehran.
- Weekly LME copper inventory reports; the current 90,000-tonne level is the number to watch for any rebuild.
- US tariff policy on copper imports, the key swing variable for trade flow direction.
- RBA commentary on imported inflation as fuel costs feed through.
The single variable that matters most is Hormuz shipping. If tankers start moving freely again, it would deflate the oil risk premium and signal a change in global supply conditions in one stroke. Knowing which signal to watch is worth more than knowing today’s price.
For readers wanting to place the current dual-commodity rally in a longer structural context, our dedicated guide to commodity supercycles examines the supply-side lag mechanics and institutional positioning shifts, including Societe Generale quadrupling its commodities allocation in a single step, that signal whether today’s moves are a cyclical episode or the early stage of a decade-long regime.
Two records, one session, and what Australian markets open to on Tuesday
Both stories point the same way for the ASX open on Tuesday 8 September 2026. The oil move is a geopolitical risk premium layered on a structurally tight market. The copper record is a supply squeeze amplified by tariff-driven trade flows. Both carry real read-through for Australian equities.
Prior comparable sessions offer the template. ASX energy names have tracked oil spikes with 1.5-3% session gains, and the big copper miners, BHP, Rio Tinto and Sandfire, moved 2-3% during comparable copper rallies. If Wall Street energy stocks closed higher and futures hold, resources sectors are positioned for a constructive open.
The risk is speed. The July precedent showed an 8-9% oil reversal in 48 hours on a single diplomatic signal. Copper’s structural support is more durable but not immune to positioning-driven corrections.
Two commodity records in one session create an unusual set of tailwinds for Australian resource investors. Knowing both the opportunity and the speed at which the geopolitical premium can reverse is what separates an informed position from a reactive one, and the week’s risk calendar is dominated by headlines, not economic data.
This article is for informational purposes only and should not be considered financial advice. Investors should conduct their own research and consult with financial professionals before making investment decisions. Past performance does not guarantee future results. Financial projections are subject to market conditions and various risk factors, and forward-looking statements are speculative and subject to change based on market developments.