Two of the world’s most closely watched central banks are expected to raise rates within 24 hours of each other this week, yet the currency pair most sensitive to both decisions may barely register the hikes themselves. That is the paradox sitting at the centre of USD/JPY right now.
The pair has pulled back from 159.84 on 1 September 2026 to 156.25 as of 6 September, even as markets price a near-certain Bank of Japan (BoJ) move and a coin-flip Federal Reserve hike. USD/JPY is not trading on what rates are today. It is trading on where they are going, and at what speed.
The clearest structural signal of how much has changed came on 1 September, when the 10-year Japanese Government Bond (JGB) yield crossed 3.0% for the first time since 1996. This piece walks through why the rate differential staying flat can still support the yen, what that JGB milestone tells you about the structural shift underway, and which of this week’s data releases actually has the power to move the pair.
Why the rate differential stays flat even as two central banks move at once
Start with the arithmetic. Japan’s policy rate sits at 1.0% and the US federal funds target range is 3.50-3.75%, leaving a differential of roughly 2.6 percentage points. Deliver the expected BoJ hike to 1.25% and the expected Fed hike to 3.75-4.00%, and that gap barely moves. It remains near 2.6 percentage points.
So two central banks tighten within a day of each other, and the spread that supposedly drives the pair ends the week almost exactly where it started.
That is why the math is beside the point. Currency markets are not pricing today’s differential; they are pricing the expected path of that differential over the next 12 to 24 months. The trade is directional, and direction depends on which bank reaches its terminal rate first.
The convergence trade sits within a broader analytical structure: a four-driver framework covering BoJ policy, yield differentials, safe-haven flows, and Japan’s net creditor position maps how each force operates across different time horizons and helps separate short-term noise from structural yen direction.
Here the two paths diverge sharply. Under the base case laid out in FX strategy commentary, the BoJ keeps hiking toward 1.00-1.25% by year-end 2026 while the Fed pivots to cuts toward 3.00-3.25%. That compresses the policy-rate gap from roughly 325 basis points today toward approximately 250 basis points.
The rule of thumb that frames the trade A 100 basis point change in the US-Japan policy-rate gap is estimated to be worth 5-8 yen in USD/JPY, according to FX strategy analysis. The directional trade is therefore a bet on convergence speed, not today’s spread.
Set the two trajectories side by side and the logic becomes clear:
- BoJ path: currently 1.0%, expected to rise toward 1.00-1.25% by year-end. Direction: tightening.
- Fed path: currently 3.50-3.75%, expected to fall toward 3.00-3.25% by year-end. Direction: easing.
- Implied gap: narrowing from roughly 325 bp to roughly 250 bp under the base case.
| Central Bank | Current Rate | Projected Year-End Rate |
|---|---|---|
| Bank of Japan | 1.0% | 1.00-1.25% |
| US Federal Reserve | 3.50-3.75% | 3.00-3.25% |
So the unchanged differential after simultaneous hikes is not a reason for the pair to stall. It is a reason to look past this week’s decisions entirely and focus on which bank is approaching the end of its cycle. Once you hold that framework, the fall from 159.84 to 156.25 in the same week both banks are expected to hike stops looking random. It looks like the market pricing convergence before it arrives.
When big ASX news breaks, our subscribers know first
What Japan’s first 3% JGB yield since 1996 actually signals
The number is 3.02%. That is where the 10-year JGB yield sat by 2-3 September 2026, after crossing 3.0% on 1 September for the first time since September 1996. On its own, it reads like a data point.
It is not. It is the surface of a regime change.
The yield did not drift there overnight. Coverage through July and August tracked the climb through 2.88-2.93%, then 2.935-2.945%, before the break above 3.0%:
- 2.88-2.93% through July and August
- 2.935-2.945% in late August
- 3.0% first crossed on 1 September
- 3.02% by 2-3 September
Japan’s Ministry of Finance auction result for the new 10-year issue on 1 September confirmed the level, showing a lowest-accepted-price yield of 3.011% and a weighted-average of 2.995%.
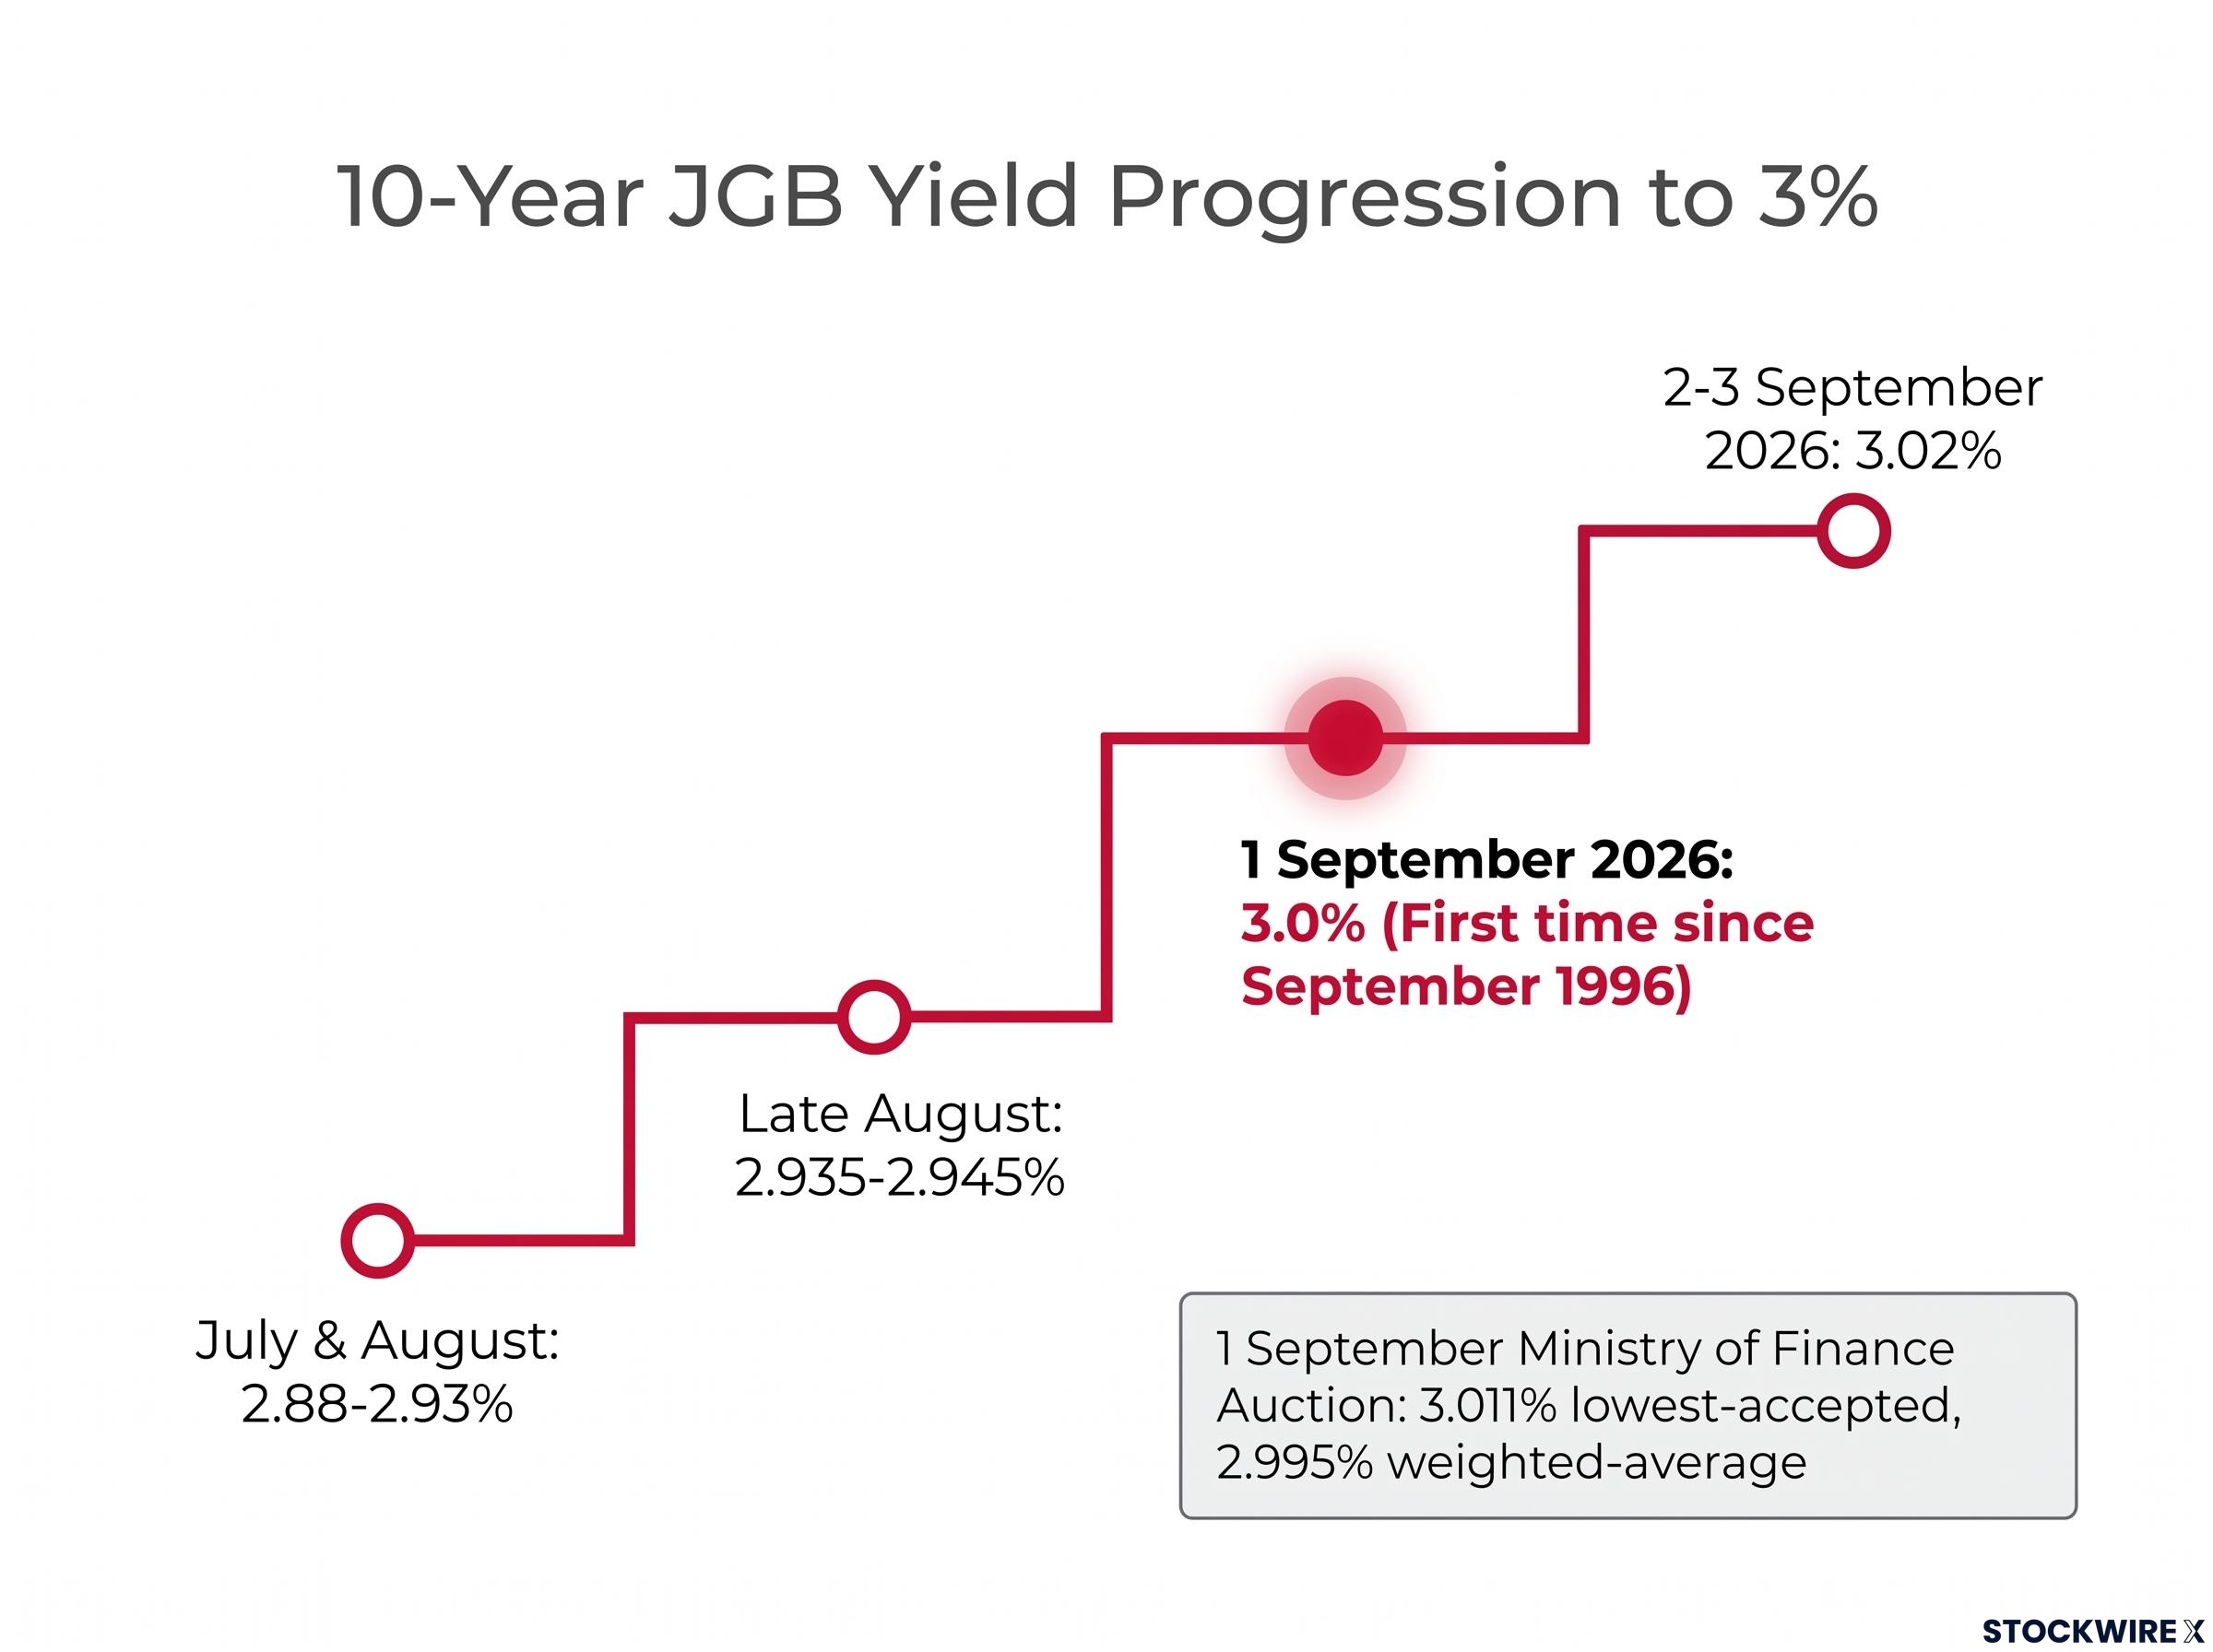
The first time in nearly three decades Reuters reported the benchmark 10-year yield hitting 3.0% on 1 September, the first time since September 1996, attributing the move to concerns about inflation, fiscal health, and mounting pressure on the BoJ to raise rates faster.
What sits behind the number is structural, not cyclical. The end of Yield Curve Control, the central bank’s policy of capping long-term yields, combined with ongoing quantitative tightening and domestic inflation, has moved Japan from ultra-low-yield status to a market where long rates are repricing term premia. As Wolf Street and CNBC frame it, decades of suppressed yields are being undone.
Why the steepening yield curve matters beyond the headline number
The headline yield is only half the story. The gap between 10-year and 2-year JGB yields, the 10s2s spread, has widened to its most since 2004, according to Reuters. That steepening carries a specific message about where inflation risk is being priced.
The long end is pricing persistent inflation. The short end is pricing a more moderate near-term BoJ hike pace. That tension, long-run inflation expectations rising while near-term tightening bets ease, is exactly what a widening 10s2s spread encodes.
For the carry trade, this changes the economics directly. Higher long-term JGB yields raise the cost of yen-funded positions, where investors borrow cheaply in yen to buy higher-yielding assets elsewhere. When the funding currency starts paying real yield, the trade that suppressed the yen for years becomes less attractive.
So the 3.0% crossing is not a number to note and move past. It tells you Japan’s bond market is repricing decades of compressed yields, and the yen’s long-term structural discount is narrowing whether or not the BoJ hikes again next week. If you are watching only short-rate forecasts, you are missing the dimension actually driving yen strength.
JGB yield normalisation carries consequences beyond the yen: Japanese institutional investors, including the near-2 trillion dollar GPIF, now face a credible domestic yield alternative, and even partial repatriation of capital toward domestic assets removes a major stable long-duration buyer from US, European, and Australian sovereign bond markets.
This week’s US data carries more weight than the BoJ meeting itself
The instinct this week is to treat the BoJ meeting on 17-18 September as the main event. That instinct is wrong.
Market-implied odds of a September BoJ hike have moderated to 62.9% as of 7 September 2026, according to CentralBank Watch, down from a peak reading near 97% in swap markets earlier in the reporting period. But here is the point: this week’s Japanese data releases are not expected to shift that probability materially. The BoJ decision is close to priced. The genuine binary sits on the US side.
The reason is straightforward. A hotter-than-expected US inflation print is the main scenario that could support USD/JPY, because it would push back Fed easing expectations and widen the projected future differential, the exact variable that drives the convergence trade. Two releases carry that weight this week:
| Release | Date/Time (GMT) | Consensus | Prior Reading |
|---|---|---|---|
| US PPI | Thursday, 12:30 | +0.4% MoM, 5.3% YoY | Flat MoM, 4.7% YoY |
| US CPI | Friday, 12:30 | +0.4% MoM, 3.4% YoY (core 2.4%) | +0.1% MoM |
All consensus figures are drawn from FXStreet analysis. For context, Fed funds futures placed the probability of a 25 bp Fed hike on 16 September at roughly 58% at the time of reporting, a genuine coin flip that these inflation prints could tip either way.
The framework for reading the week comes down to two scenarios:
- Hot inflation print (PPI and CPI both above consensus): expect USD/JPY to recover toward recent highs, and watch the 158-160 range closely, where Ministry of Finance intervention risk becomes material.
- Soft inflation print (both below consensus): the convergence trade accelerates as Fed-easing expectations rise faster than priced, pulling the pair lower.
The intervention watch level Above roughly 158-160, the risk of Japanese Ministry of Finance intervention becomes material. Any USD/JPY recovery driven by hot US inflation data runs into that ceiling.
The coordinated intervention precedent from August 2026, when the US joined Japan in selling reserves to arrest the yen’s slide to 40-year lows, is part of why the 158-160 ceiling is not just a technical resistance zone but a diplomatically sensitive threshold where both governments have demonstrated willingness to act.
Japan’s own calendar this week, labour cash earnings at a consensus 3.9% YoY, a current account surplus near ¥2.87 trillion, and a Q2 GDP second estimate of +0.4% QoQ, or 1.1% annualised, is context rather than catalyst. None of it is expected to move BoJ pricing. Knowing that lets you calibrate attention correctly. The central bank meeting is the backdrop this week. The US inflation prints are the trigger.
How far the BoJ can actually go, and why that caps the yen trade
Read the prior sections and it is tempting to conclude the yen has an open runway. It does not. The BoJ’s hiking path is credible, but it is also constrained, and the constraint matters for how the convergence trade actually plays out.
Start with the credibility. Former BoJ Policy Board member Seiji Adachi has described a September increase as highly likely, and a Yomiuri Shimbun survey found 8 of 14 economists expecting a 25 bp hike to 1.25% at the September meeting. That is a working majority, and it lines up with the market pricing.
The insider read Former BoJ Policy Board member Seiji Adachi described the central bank as “boxed in,” characterising a September rate increase as highly likely, according to reporting in the Japan Times.
But the same survey carries the other half of the picture. The voices split cleanly:
- Supporting the hike: Seiji Adachi, describing the BoJ as “boxed in”; 8 of 14 economists forecasting a September move; a board member arguing that back-to-back hikes are now possible, breaking the prior roughly six-month cadence.
- Urging caution: 6 of 14 economists in the same survey not forecasting a September hike; the Prime Minister’s chief economic adviser, a former tightening opponent now expecting hikes, cautioning that the accelerated pace may carry economic consequences.
External risks that could accelerate or derail the BoJ path
The structural ceiling is fiscal. With the 10-year JGB yield at 3.0% and longer maturities above 4.0%, government debt-service costs are climbing, alongside corporate borrowing and mortgage costs that have already repriced since Yield Curve Control ended. The BoJ has to weigh currency and inflation objectives against fiscal health and real-economy strain.
Oil adds another variable. Japan imports nearly all of its crude, and Middle East tensions have influenced prices since February, worsening the country’s terms of trade and lifting imported inflation. That simultaneously pressures the BoJ to act and raises the economic cost of acting.
Then there is the tail risk. A risk-off shock could trigger an unwinding of yen-funded carry positions, producing sharper USD/JPY moves than the rate differential alone would imply. Treat these as scenario-specific risks, not the base case.
For investors wanting to stress-test the tail scenario in more depth, our deep-dive into yen carry unwind risk examines the three-question diagnostic framework that separates genuine systemic risk from headline noise, using the 2024 unwind and Japan’s 2026 intervention as case studies.
The read for you is this. The BoJ path is credible enough to trade against the dollar, but the fiscal and economic constraints mean the convergence is unlikely to be a straight line. The pace of narrowing is itself uncertain and subject to reversal, which argues for positioning around a gradual, volatile move rather than a clean appreciation trend.
Where the convergence trade goes from here
Pull the threads together and the picture is not a clean directional call. It is a set of variables moving at once.
USD/JPY has already travelled from 159.84 on 1 September toward 156.25 by 6 September, which reflects the market pre-pricing the convergence path rather than reacting to any single data point. The base case still points toward the Fed-BoJ differential narrowing from roughly 325 basis points today to approximately 250 basis points by year-end 2026. That is the structural direction of travel.
Three variables will determine whether the trade continues, accelerates, or reverses:
- This week’s US inflation prints. Thursday’s PPI and Friday’s CPI are the actual decision-point, more so than either central bank meeting.
- The pace of BoJ hikes beyond September. Back-to-back moves accelerate the yen; a cautious, constrained path slows it.
- The timing of the first Fed cut. The sooner the Fed pivots, the faster the differential compresses.
Japan’s bond market is back in play CNBC and Wolf Street frame the 3.02% JGB yield as the end of decades of suppression, a structural signal that the yen is more supported now than at any point since the mid-1990s, subject to the fiscal and geopolitical ceiling on how fast that support builds.
The direction from here is not a question this week’s central bank meetings will settle alone. Treat Thursday’s PPI and Friday’s CPI as the trigger, with the BoJ and Fed decisions functioning as confirmation rather than catalyst, and watch 158-160 as the upside cap on any inflation-driven recovery.
This article is for informational purposes only and should not be considered financial advice. Investors should conduct their own research and consult with financial professionals before making investment decisions.
Past performance does not guarantee future results. Financial projections are subject to market conditions and various risk factors. These statements are speculative and subject to change based on market developments and central bank decisions.