On Monday, three corners of the ASX with almost nothing in common fell in the same session. The information technology sector dropped 2.6%, the worst-performing category of the day. COMEX gold slid 0.8% to US$4,441 per ounce, adding to a 1.4% fall the session before and dragging the ASX gold sub-index down 1.2%.
Software firms, gold miners, and yield-sensitive defensives do not share customers, products, or business models. Yet they moved together, and most investors could not tell you why.
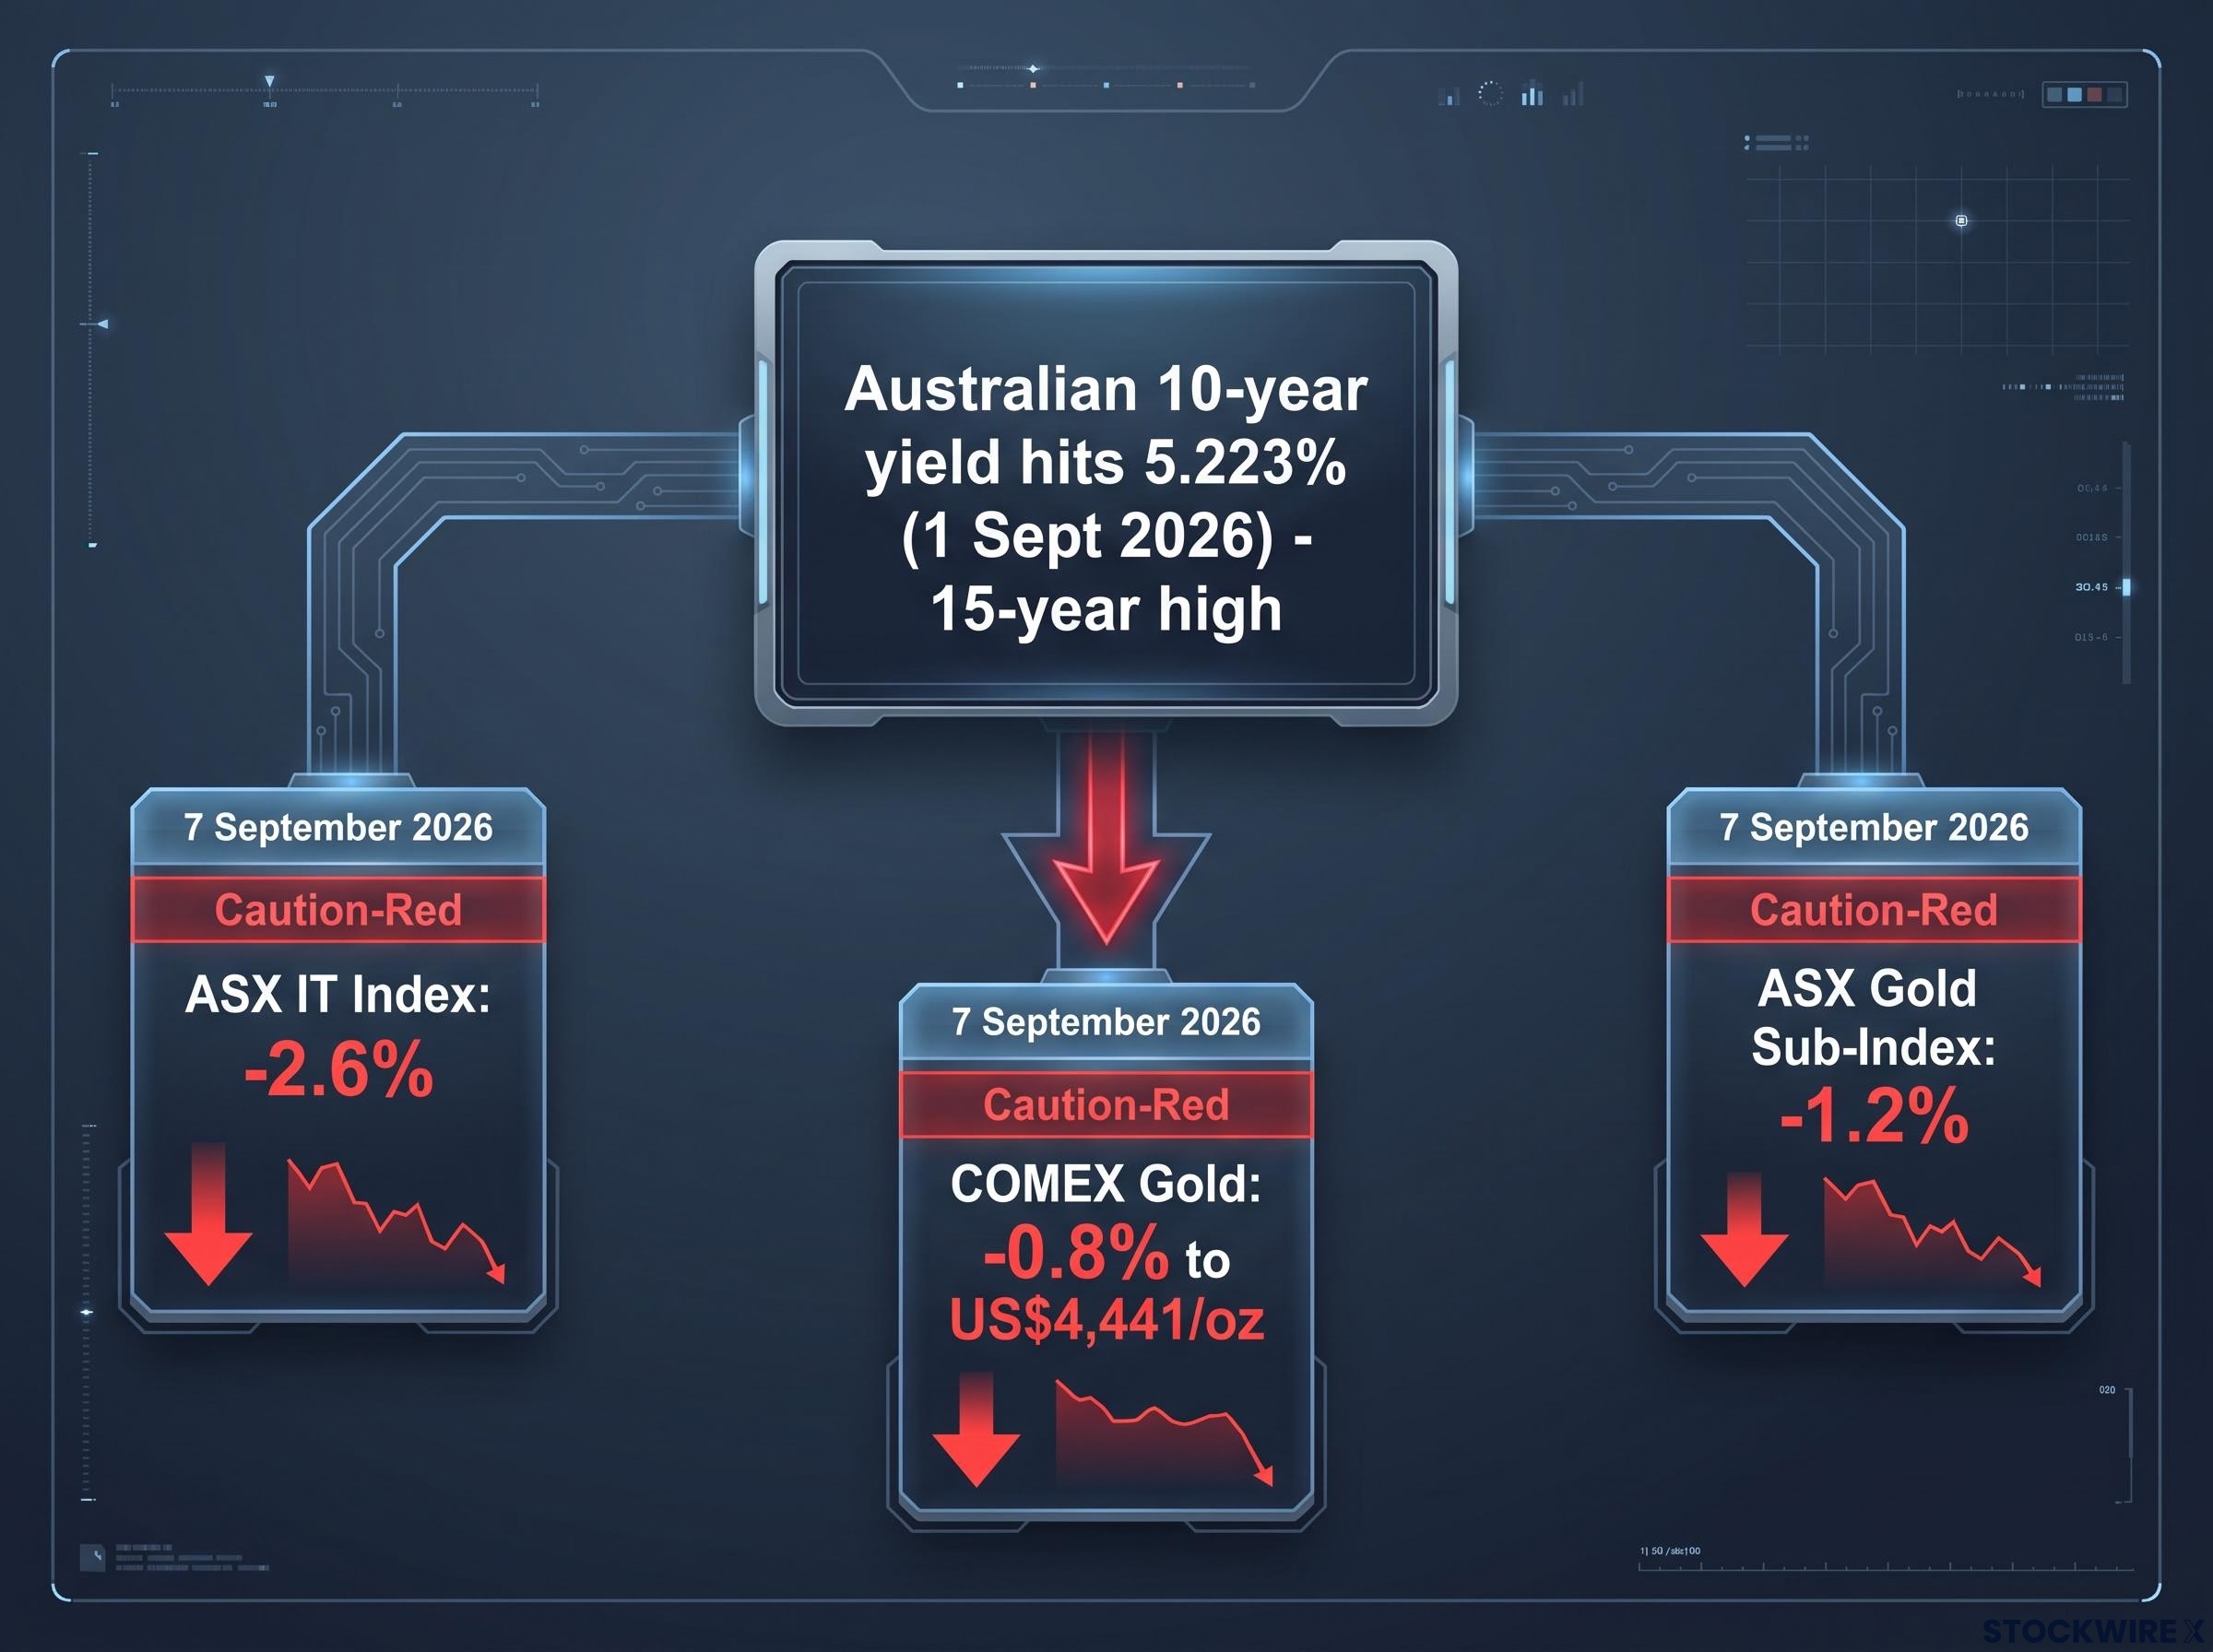
The reason sits in the bond market. US 10-year Treasury yields are at 4.789%, and Australian 10-year yields touched 5.223% on 1 September 2026, a 15-year high. These are not background numbers. They are actively rewriting which ASX assets investors want to own and what they will pay for them.
After this, you will understand the single mechanism connecting all three sell-offs, and you will know which parts of your own portfolio stay exposed if yields hold at these levels.
Three sectors, one bad day, and the same mechanism underneath
Start with the facts of the session on 7 September 2026. The ASX IT index shed 2.6%, the steepest decline of any sector that day. COMEX gold contracts fell 0.8% to US$4,441 per ounce, compounding the prior session’s 1.4% drop, which pushed the ASX gold sub-index down 1.2%.
Utilities and regulated infrastructure sit in the same yield-sensitive bucket as IT and healthcare. Their single-day moves were quieter on this date, but they belong to the same category of assets under pressure.
Now sit with the strangeness of it. A software business, a power network, and a gold miner have nothing in common operationally. One sells subscriptions, one runs regulated grids, one digs metal out of the ground.
They sold off in the same window anyway. That is the puzzle this article exists to solve.
| Segment | Reference Date Move | Yield Context |
|---|---|---|
| ASX IT sector | -2.6% (7 September 2026) | Worst-performing sector of the day |
| COMEX gold | -0.8% to US$4,441/oz | Following a -1.4% prior session |
| ASX gold sub-index | -1.2% (7 September 2026) | Driven by falling bullion |
The context underneath all three is a repricing in government debt. US 10-year yields sat at 4.789% on 6 September 2026, and Australian 10-year yields closed in the 5.152%-5.19% range on 4 September 2026, having risen roughly 0.17-0.27 percentage points over the month across both markets.
Australian 10-year yields hit 5.223% on 1 September 2026, a 15-year high.
Here is what the data tells you. No single company or earnings miss drove these moves. One macro variable did the work, and if you hold any of these three sectors, that variable is now the most important number on your dashboard.
When big ASX news breaks, our subscribers know first
What the discount rate actually does to a stock’s value
Picture a company whose earnings outlook has not changed at all, whose management said nothing new, whose customers are behaving exactly as expected. Its share price still falls. That is the discount rate at work, and it explains almost everything above.
A stock’s price is, in theory, the present value of all the profits the company will earn in the future. To turn future profits into a value today, you have to discount them, because a dollar earned in five years is worth less than a dollar in hand now. The rate you use for that discounting is anchored to what risk-free government bonds pay.
When bond yields rise, the discount rate rises with them. Every future dollar of profit becomes worth less today. The share price falls even though the business is unchanged.
The penalty is not spread evenly. A company earning most of its profit next year barely feels a higher discount rate, because there are few periods to compound the penalty across. A company earning most of its profit five years out feels it heavily, because the discounting bites over many more periods.
The concept of equity duration formalises exactly this penalty: Morgan Stanley estimates that a 100 basis point increase in real yields drives 3-4 turns of multiple compression in growth stocks with no change to underlying fundamentals, meaning the drawdown is mechanical rather than a signal of business deterioration.
This is why unprofitable or expensively valued tech sits at the most exposed end. Its cash flows are furthest in the future, so its valuation is most sensitive to any move in yields. Profitable, modestly priced names hold up far better, and some, like Computershare (CPU), actually benefit from higher rates because they earn interest on client cash balances.
If your ASX tech holdings are clustered in high-multiple, loss-making names, this mechanism means each additional rise in yields creates a headwind that no near-term operational improvement can offset.
This is not a one-session blip. Yields have risen roughly 0.71-0.84 percentage points over the past year across both markets, a sustained repricing rather than a bad Monday.
What the historical episodes show
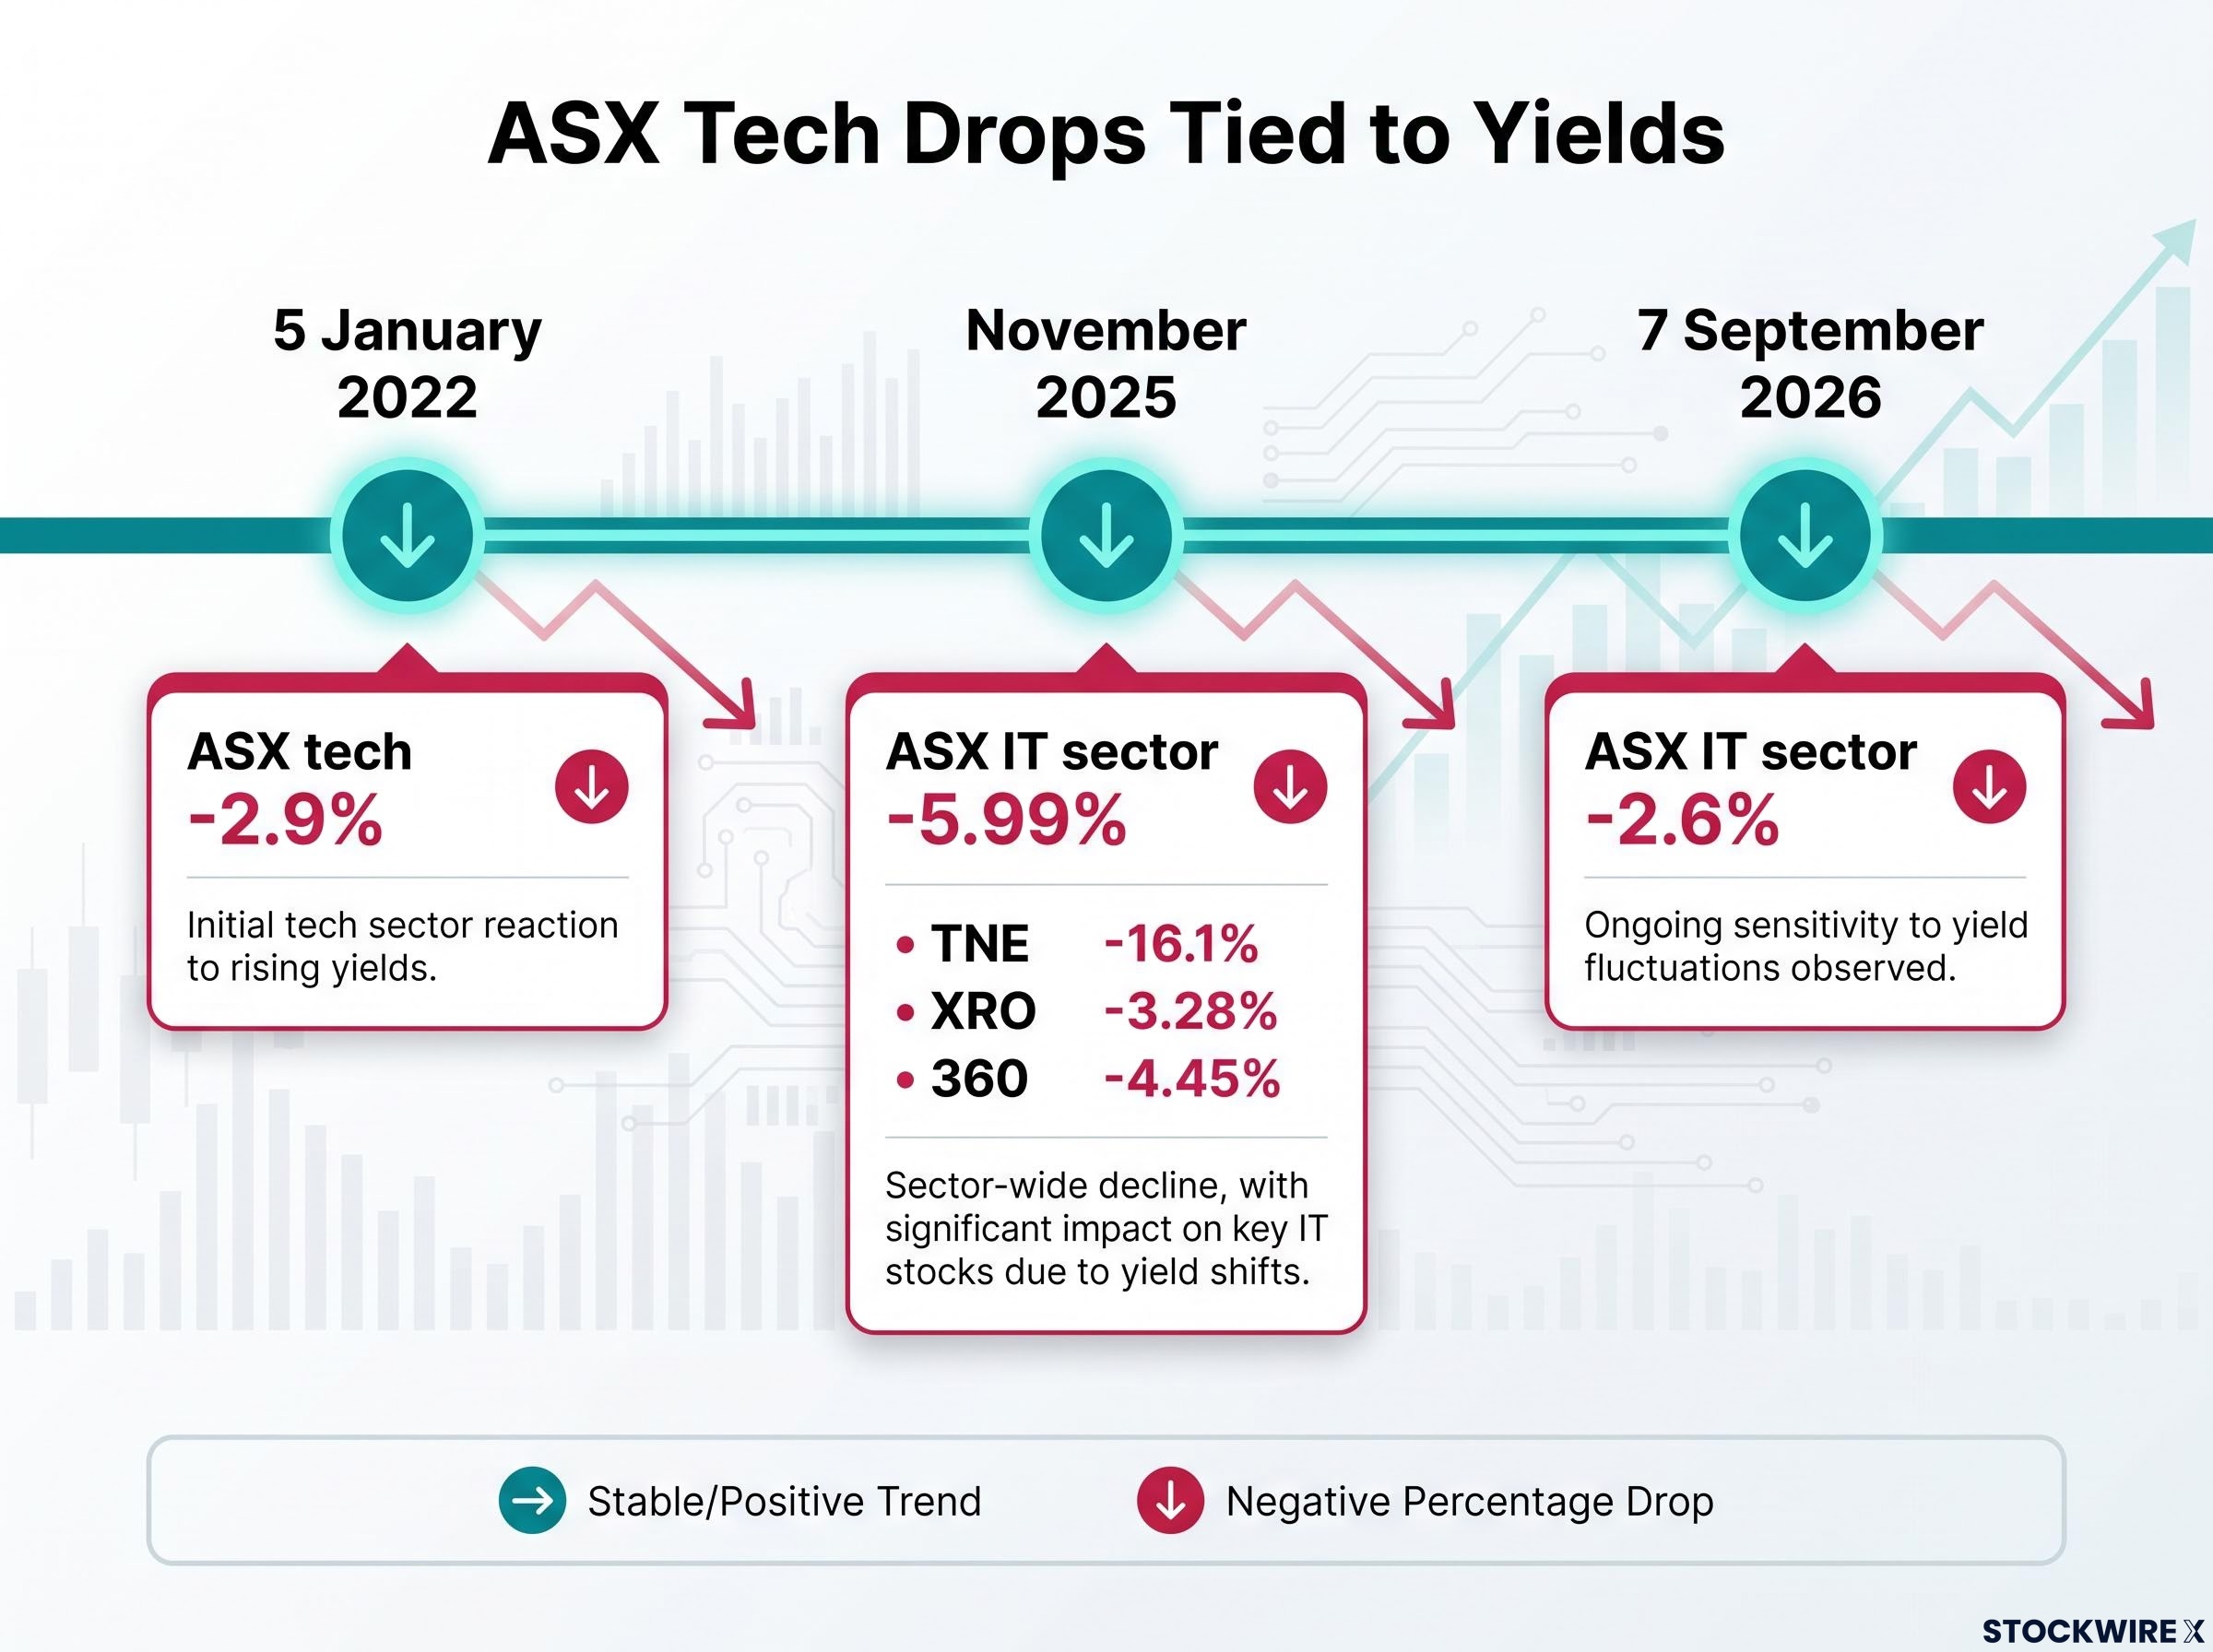
The mechanism is not theoretical. Named analysts and yield spikes have been tied to ASX IT declines repeatedly:
- 5 January 2022: ASX tech fell 2.9%, its worst session in over two weeks, which analyst Mathan Somasundaram attributed directly to rising US bond yields ahead of Fed minutes.
- November 2025: The ASX IT sector dropped 5.99% in a single session, with Technology One (TNE) down 16.1%, Xero (XRO) down 3.28%, and Life360 (360) down 4.45%.
- 7 September 2026: The ASX IT sector fell 2.6%, the worst sector of the day, amid elevated yields.
Each episode lines up with a move in yields, not a sudden collapse in the underlying businesses. The same period offers a preview of the leverage still to come: across the full year of 2022, ASX gold miners underperformed by more than 27% while the broader ASX fell roughly 12%. That gap is the next section’s story.
Why utilities and gold miners get hit by the same wave
Utilities have their own version of the duration problem. Their cash flows are long-lived and largely fixed by regulated returns, which means the discounted cash flow penalty applies in full when the discount rate rises, even though the business performs exactly as planned. A steady, dependable earnings stream is precisely the kind of asset a higher risk-free rate punishes.
Gold and gold miners face a two-layer sensitivity, and understanding the difference between them matters.
The first layer is opportunity cost. Gold pays no income. When real bond yields climb, the appeal of holding a non-yielding metal drops relative to assets that pay you to own them, and money rotates out.
The opportunity-cost argument for gold is more precisely an argument about real yields, the nominal yield minus inflation expectations, because gold held its ground through much of the 2022-2023 Fed hiking cycle when surging inflation kept real yields negative even as nominal rates climbed aggressively.
The second layer is operating leverage, and it applies specifically to the miners. Fixed operating costs mean a percentage fall in the gold price produces a larger-than-proportional fall in miner margins and valuations. The equity amplifies the metal’s move.
The 1 July 2026 session showed both layers at once. Hawkish RBA June minutes and gold falling below US$4,000 per ounce intraday triggered a sharp sell-off:
- Northern Star Resources (NST): down 8.8%
- Evolution Mining (EVN): down 5.6%
- Regis Resources (RRL): down 9.8%
The bullion price itself was volatile in the lead-up to the September reference date. COMEX gold fell 3.25% to US$4,478 per ounce in the week ending 28 August 2026, its largest weekly decline since early June, then dropped further to US$4,348 on 1 September 2026 on a third consecutive daily fall, before settling at US$4,441 on 7 September 2026.
In 2022, ASX gold miners underperformed by more than 27% in a year the broader ASX fell roughly 12%.
There is a genuine caveat here. The inverse relationship between yields and gold is a strong tendency, not an iron rule. Central-bank buying and safe-haven demand have at times pushed gold higher even as real yields rose, so the correlation depends on which force is dominant in a given period.
The miner data tells you something specific: holding gold-miner equities is not the same as holding gold. The operating-leverage layer means yield-driven falls in the metal produce larger-than-linear drawdowns in the miners. If you treat utilities as safe defensives and gold miners as an inflation hedge without accounting for their discount-rate sensitivity, you are carrying more yield risk than you realise, especially with Australian 10-year yields near 15-year highs.
What stays elevated and what can shift the pressure
The dominant view among strategists is that this rate environment is here to stay. Morningstar declared in April 2026 that “higher-for-longer interest rates is now the market consensus.” Vanguard Australia expected in March 2026 that elevated policy and bond rates would persist, and Fidelity has argued that because the RBA’s peak is lower than peer central banks, local policy is less restrictive than it looks, leaving room for rates to stay high.
The synchronised global yield repricing that hit simultaneous multi-decade highs across the US, UK, Japan, and Australia in May 2026 confirms that the pressure on ASX yield-sensitive sectors is not a local anomaly: it reflects a single, coordinated reset in what global capital demands as a risk-free return.
The counterpoint is live. An AFR survey of economists showed split views on whether the RBA is finished, and Praemium has flagged that the sustainability of the higher-for-longer thesis is actively questioned, with rate stabilisation possible if inflation moderates.
Domestic data currently leans toward the structural camp. ANZ job advertisements rose 2.5% in August 2026, accelerating from an upwardly revised 1.9% in July 2026, a sign the labour market remains resilient enough to support the RBA’s elevated settings.
Three near-term catalysts will move the yield needle:
- ECB rate decision: A Reuters poll of 3 September 2026 projected a 10 September 2026 hike, widely expected to be the final move in the cycle. The deposit facility sits at 2.25% after a 25 basis point rise on 11 June 2026, and ING’s Carsten Brzeski called a September hike “almost a done deal.”
- US core inflation: A hotter print reinforces higher-for-longer; a softer one begins to ease yield pressure.
- Chinese CPI and PPI: Feeds into global growth and rate expectations.
These are not distant macro events. The ECB decision and US inflation figures due this month are the next two inputs that will either reinforce or start to relieve the yield pressure sitting on every ASX IT stock, utility, and gold miner you hold.
Is this a temporary spike or a new rate regime?
The honest answer is that the question is open. The structural case is well-argued by Morningstar, Vanguard, and Fidelity; the cyclical case is credibly held by the economists in the AFR survey and by Praemium. The RBA’s March 2026 Financial Stability Review adds a tail risk to both, warning of disorderly repricing in global bond markets if sovereign debt-sustainability concerns escalate.
The practical takeaway is that positioning should account for both scenarios rather than betting entirely on one. Wilsons Advisory points to healthcare and certain global franchises, and Vanguard points to cash and high-quality fixed income as more resilient or directly advantaged in a higher-rate regime, an implicit contrast with the yield-sensitive holdings this article has covered.
Positioning when the risk-free rate has teeth again
The three-sector vulnerability is really a prompt to audit your own book. High-multiple IT, regulated utilities, and gold miners should be assessed not only on their individual investment case but on their combined yield-rate exposure, particularly with Australian 10-year yields near a 15-year high of 5.223%.
The opportunity-cost maths has shifted underneath all of them. Cash and high-quality fixed income now pay meaningfully more than in recent years, which raises the bar for holding low-yield or non-yielding equities, gold miners included.
Morningstar noted in April 2026 that real estate, energy, communication services, utilities, and financials offered more attractive prospective yields than technology in this environment, a reminder that yield sensitivity varies across sectors that all look “defensive” at a glance.
ASX equity concentration risk compounds the yield-sensitivity problem: financials and materials account for an estimated 55-60% of the ASX 200, meaning a standard Australian equity portfolio is far more exposed to rate and commodity price swings than its sector count suggests.
Three questions worth putting to your holdings before the next ECB decision or US inflation print:
- What proportion of my ASX equity exposure sits in high-multiple IT, regulated utilities, or gold miners?
- What is my aggregate yield-rate sensitivity once those positions are added together?
- What is the duration and quality profile of my defensive positions, and would they actually help if yields spiked further?
The tail risk to hold in mind is the RBA’s March 2026 warning that a disorderly bond-market repricing, if sovereign debt concerns escalate, could be faster and larger than past episodes suggest. The IMF’s 2025 Article IV review echoes that prolonged high rates would drag on employment, consumption, and investment if inflation proves stubborn.
At yields near 15-year highs, the question is not whether bond yields affect long-duration equities in theory. It is how much unhedged yield-rate risk you are carrying right now across these three sectors, and whether diversification and attention to profitability within each one has reduced it.
This article is for informational purposes only and should not be considered financial advice. Investors should conduct their own research and consult with financial professionals before making investment decisions. Past performance does not guarantee future results, and financial projections are subject to market conditions and various risk factors.