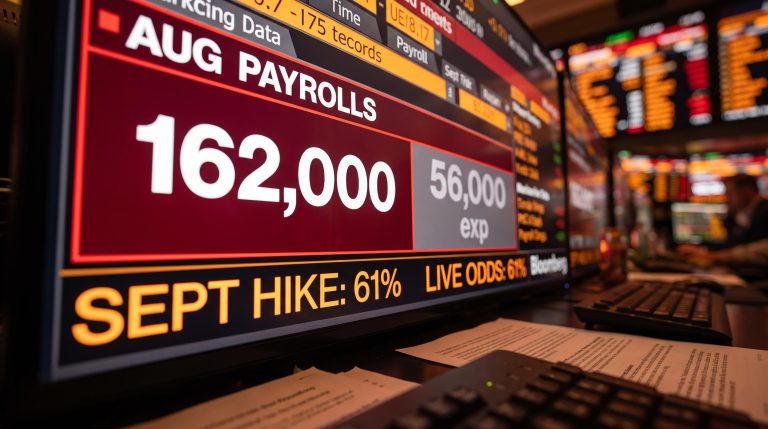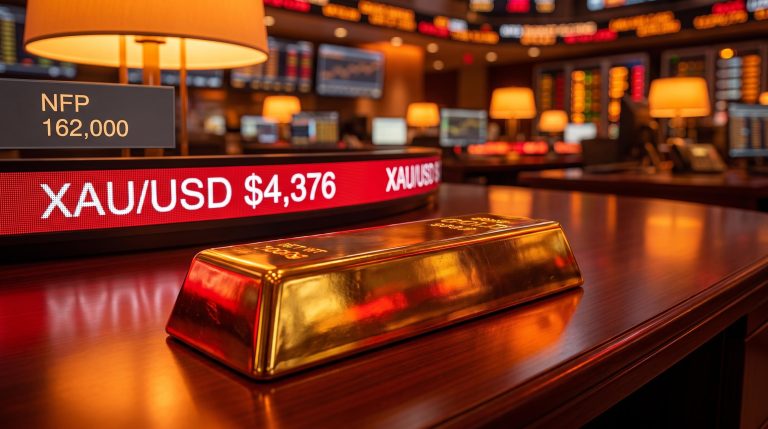
Nonfarm payrolls came in at +162,000 for August 2026 against a consensus near 56,000, and within hours the market’s read on the Federal Reserve flipped. Odds of a September rate hike jumped from 51% to 61.9%.
That gap, a nearly threefold overshoot on jobs, did not just beat expectations. It reset the entire risk calculus for the week ahead.
The print landed differently than a routine jobs beat because it did not arrive alone. Crude oil pushed toward $97 per barrel on US strikes against Iranian tankers, gold dropped 4% in a single session, and the White House publicly pressured the Fed to cut rates. These are not independent signals converging by coincidence. They are competing forces bearing down on the same upcoming inflation releases.
Here is the decision-relevant map for the week. This US market analysis walks through which macro variables are pulling in the same direction, which are in genuine tension, and which data points settle the argument: PPI on Thursday, CPI on Friday, and Oracle earnings after Thursday’s close. Each one determines whether the current read holds.
Why the payrolls beat changed the Fed’s September calculus
Start with the arithmetic, because the arithmetic is what moved futures markets. The U.S. Bureau of Labor Statistics reported +162,000 nonfarm payrolls for August 2026 on 4 September 2026, against a consensus forecast of roughly 56,000. That is not a modest upside surprise. It is a beat of close to 190%, and a gap that size forces a repricing of what the Fed does next.
Here are the four labour market figures that frame the week:
- Nonfarm payrolls: +162,000 in August 2026
- Unemployment rate: 4.1%, unchanged
- Average hourly earnings: approximately 3.1% year-over-year
- Three-month rolling average: 71,000 payroll additions
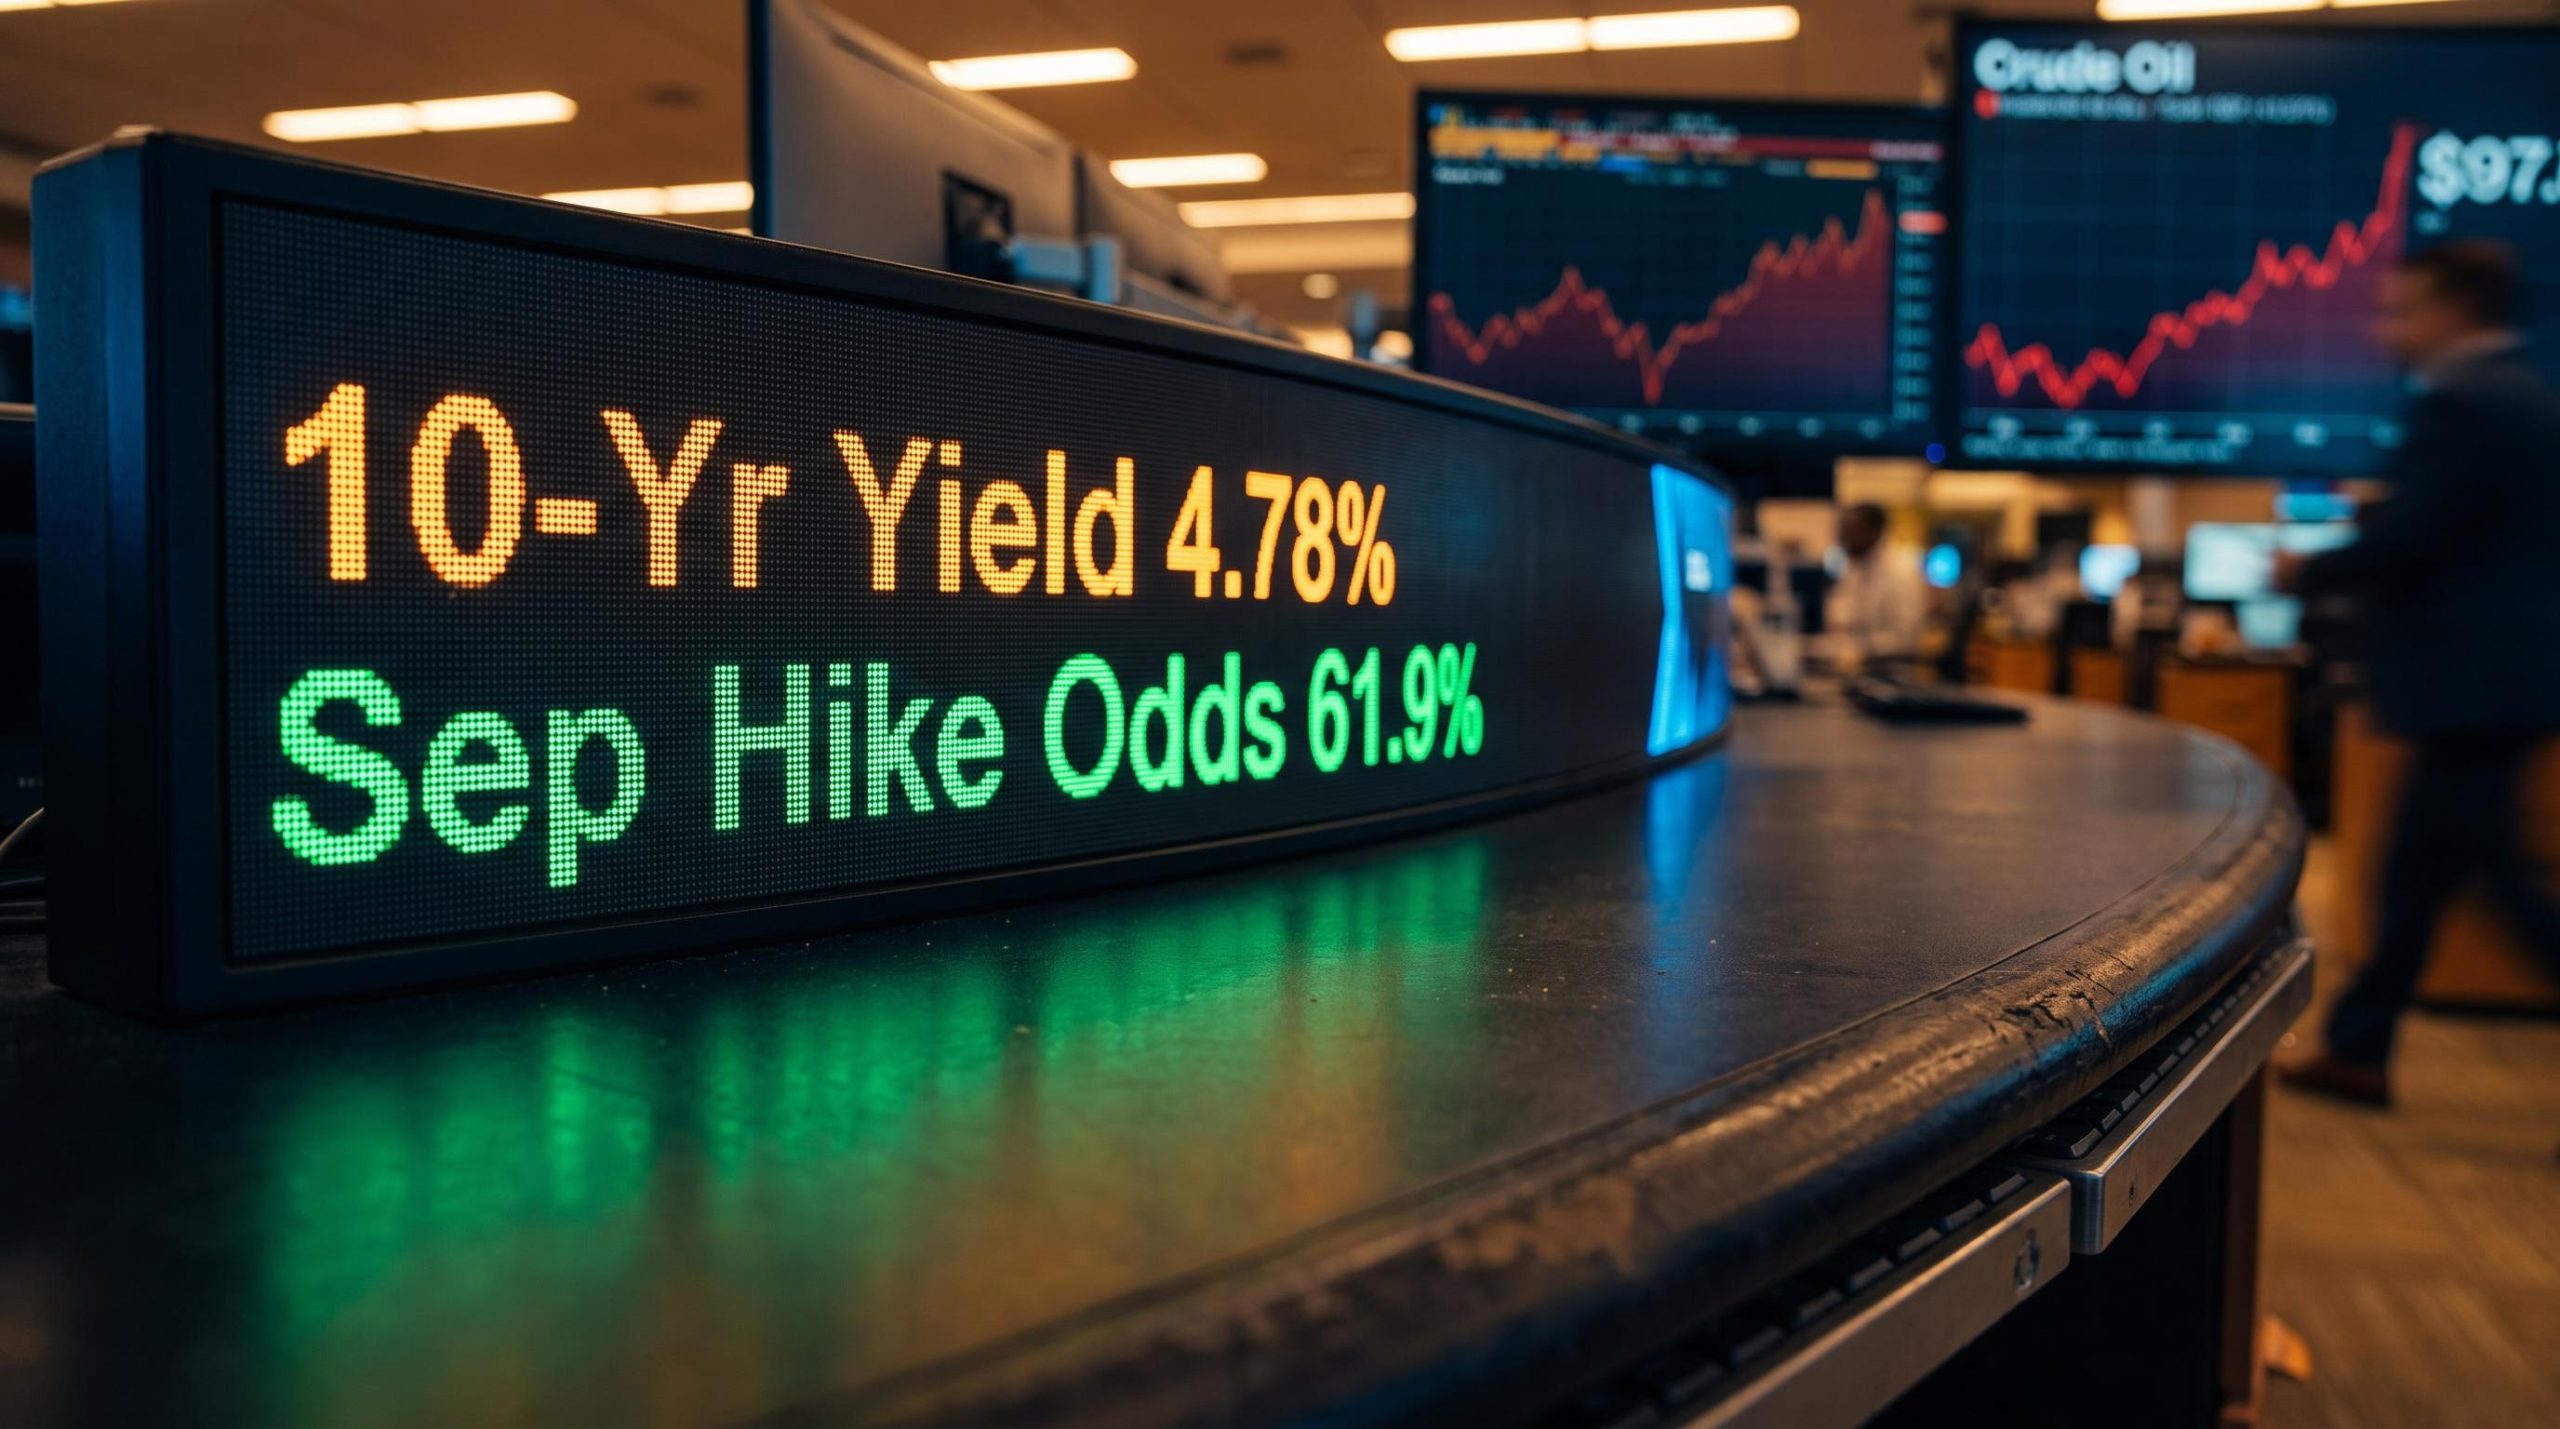
The immediate market reaction was clean. Treasury yields moved higher, with the 10-year finishing the session near 4.78%, and short-term interest-rate futures repriced the September meeting sharply.
The Fed’s own Monetary Policy Report explicitly linked the current inflation problem to a war-linked oil shock, and the July FOMC held rates even as CME hike odds climbed to 30-40%, establishing the baseline against which the September meeting’s 61.9% probability reads as a material shift in the committee’s calculus.
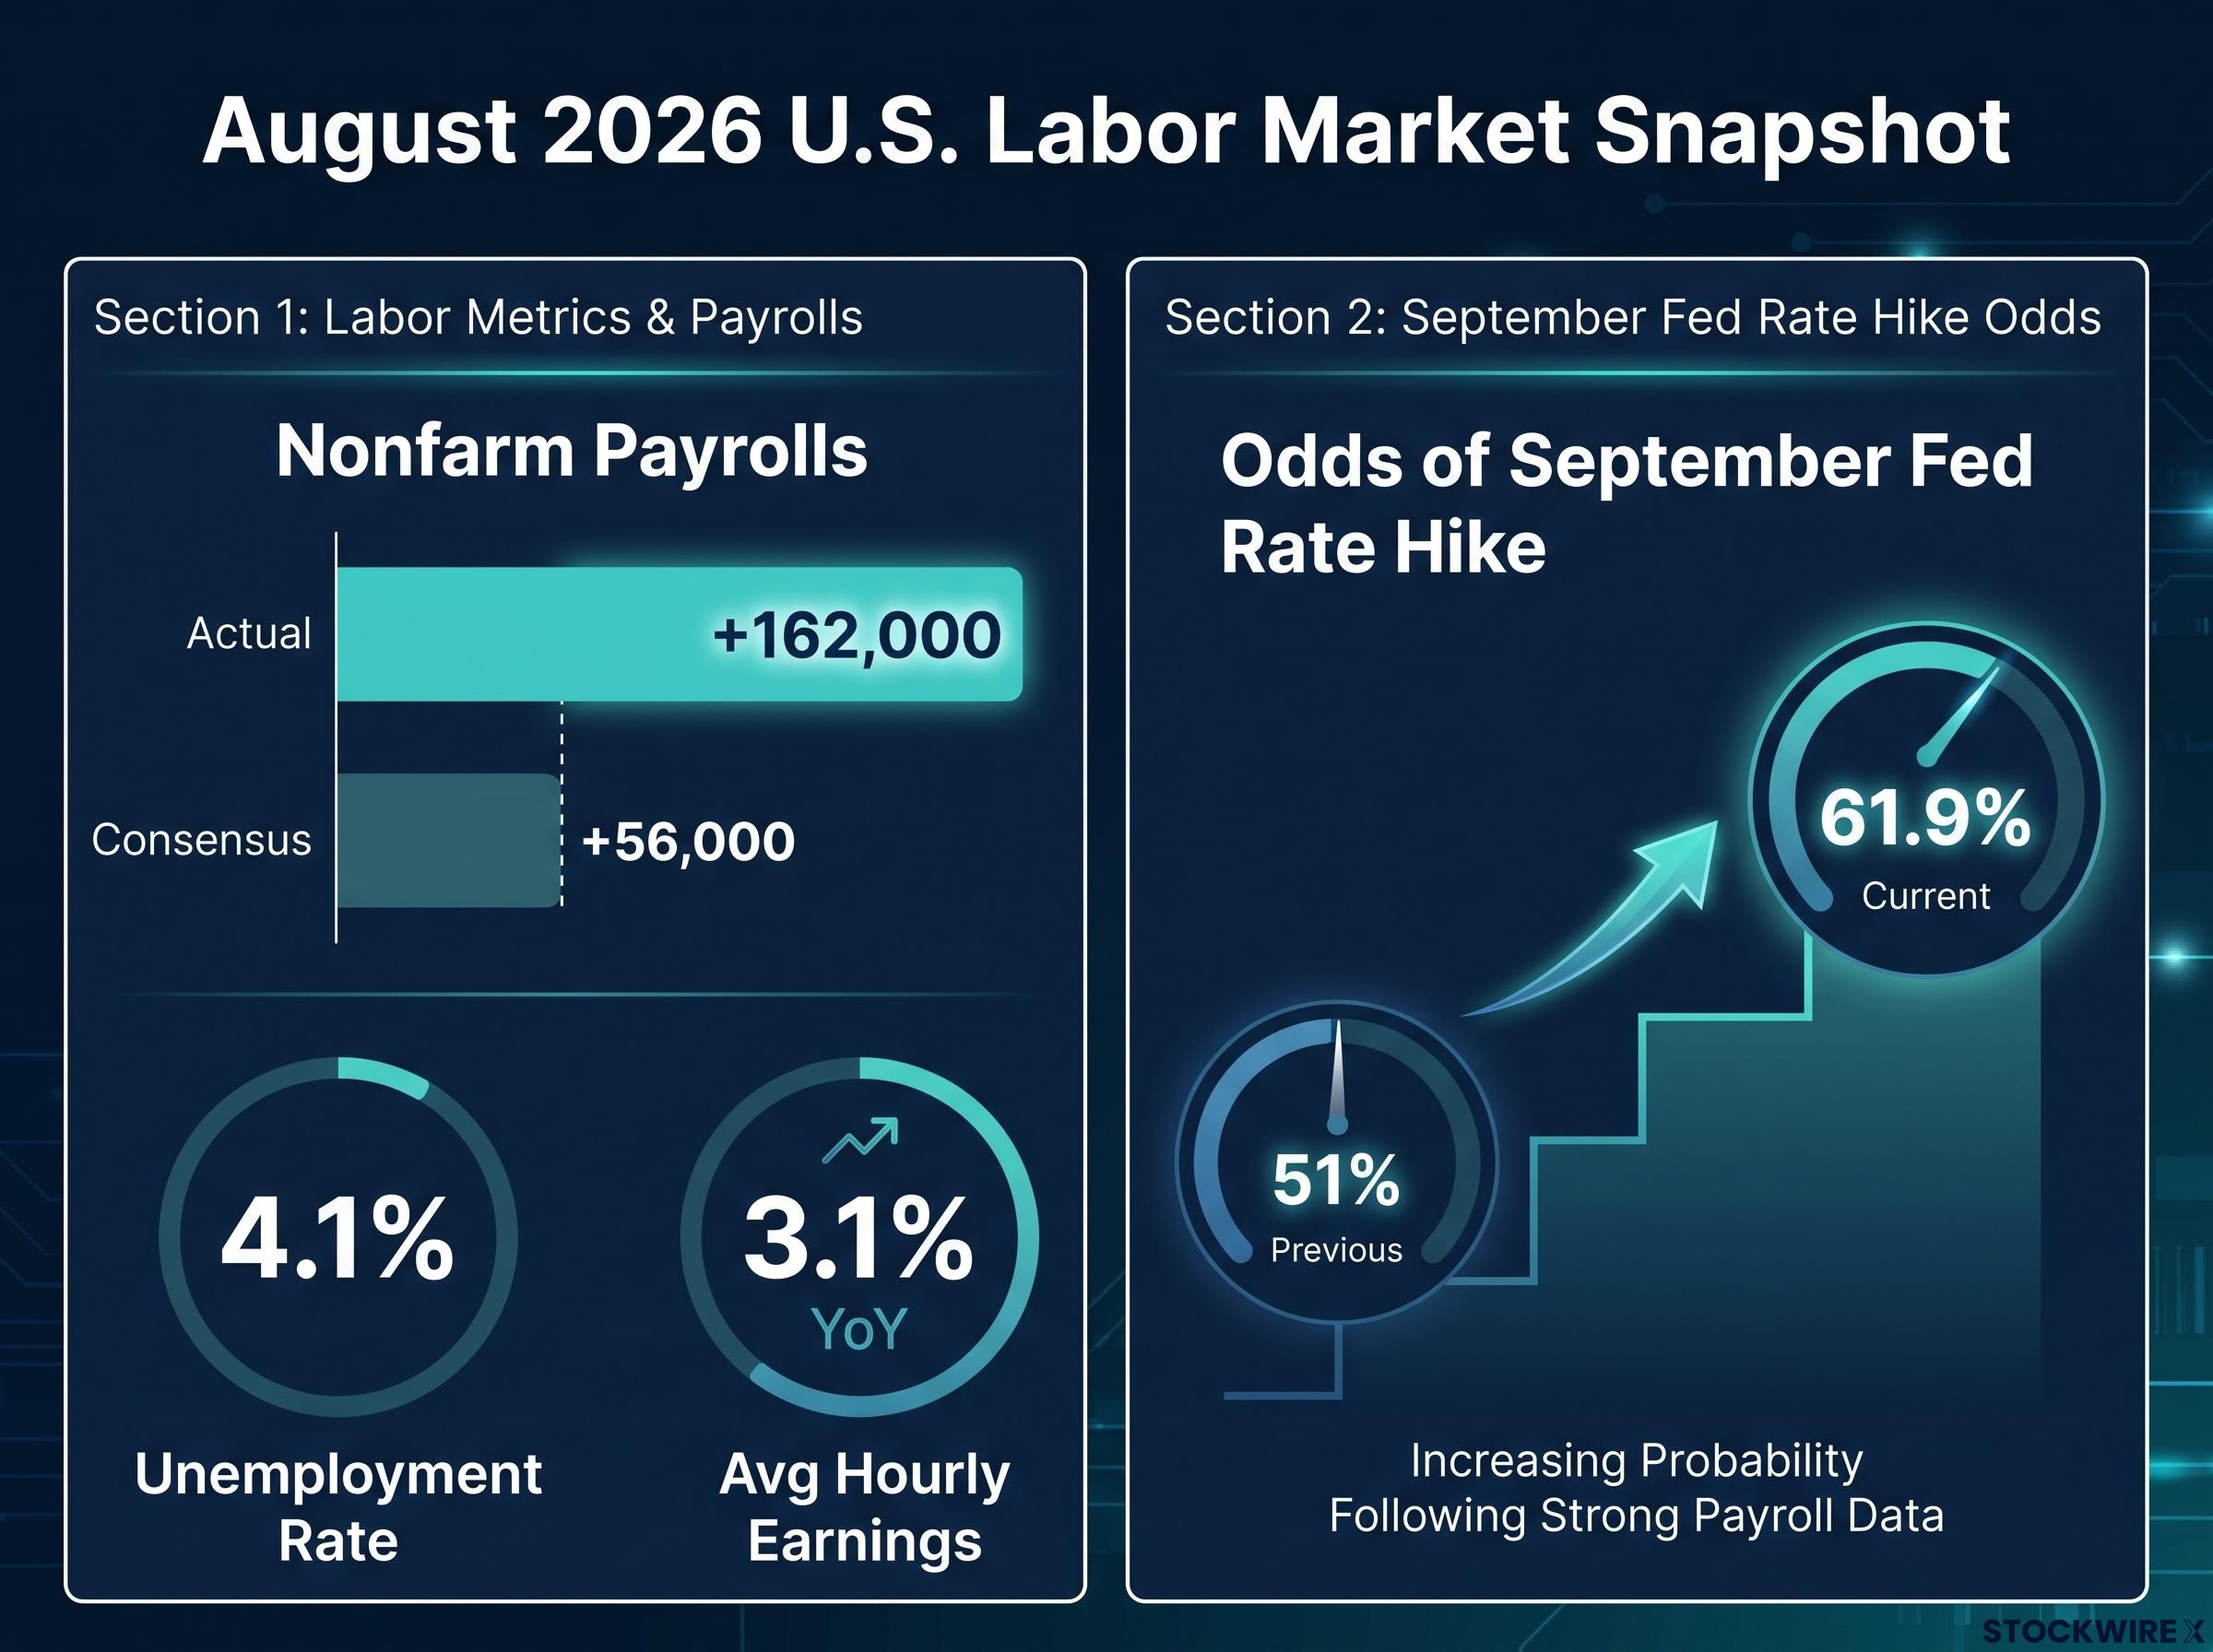
Fed hike odds shifted fast: From roughly 51% before the payrolls release to 61.9% after, based on CME FedWatch-linked tracking. Reuters put the figure near 59%, CNBC’s CME-based read near 60%, and Schwab strategists closer to 63%.
What the wage data tells you about this jobs cycle
The wage data complicates the hawkish read, and that is where this gets interesting.
Average hourly earnings grew about 3.1% year-over-year in August, which is moderating rather than accelerating. According to BLS composition data, the slowdown is not a broad softening of pay. It reflects a hiring mix that skewed toward lower-wage roles, dragging the average down even as jobs were added.
This matters to the Fed because the wage-price spiral argument, the fear that rising pay feeds sustained inflation, weakens considerably in this context. What that tells you is the September outcome is genuinely uncertain rather than predetermined.
The jobs beat alone does not force a hike. What it does is remove the soft-labour-market argument for a pause. That means the inflation data due later this week now carries the full weight of the decision, and reading Thursday’s PPI and Friday’s CPI with that already calibrated puts you ahead of the reactive crowd.
When big ASX news breaks, our subscribers know first
Oil at $97 and the geopolitical premium investors are now pricing
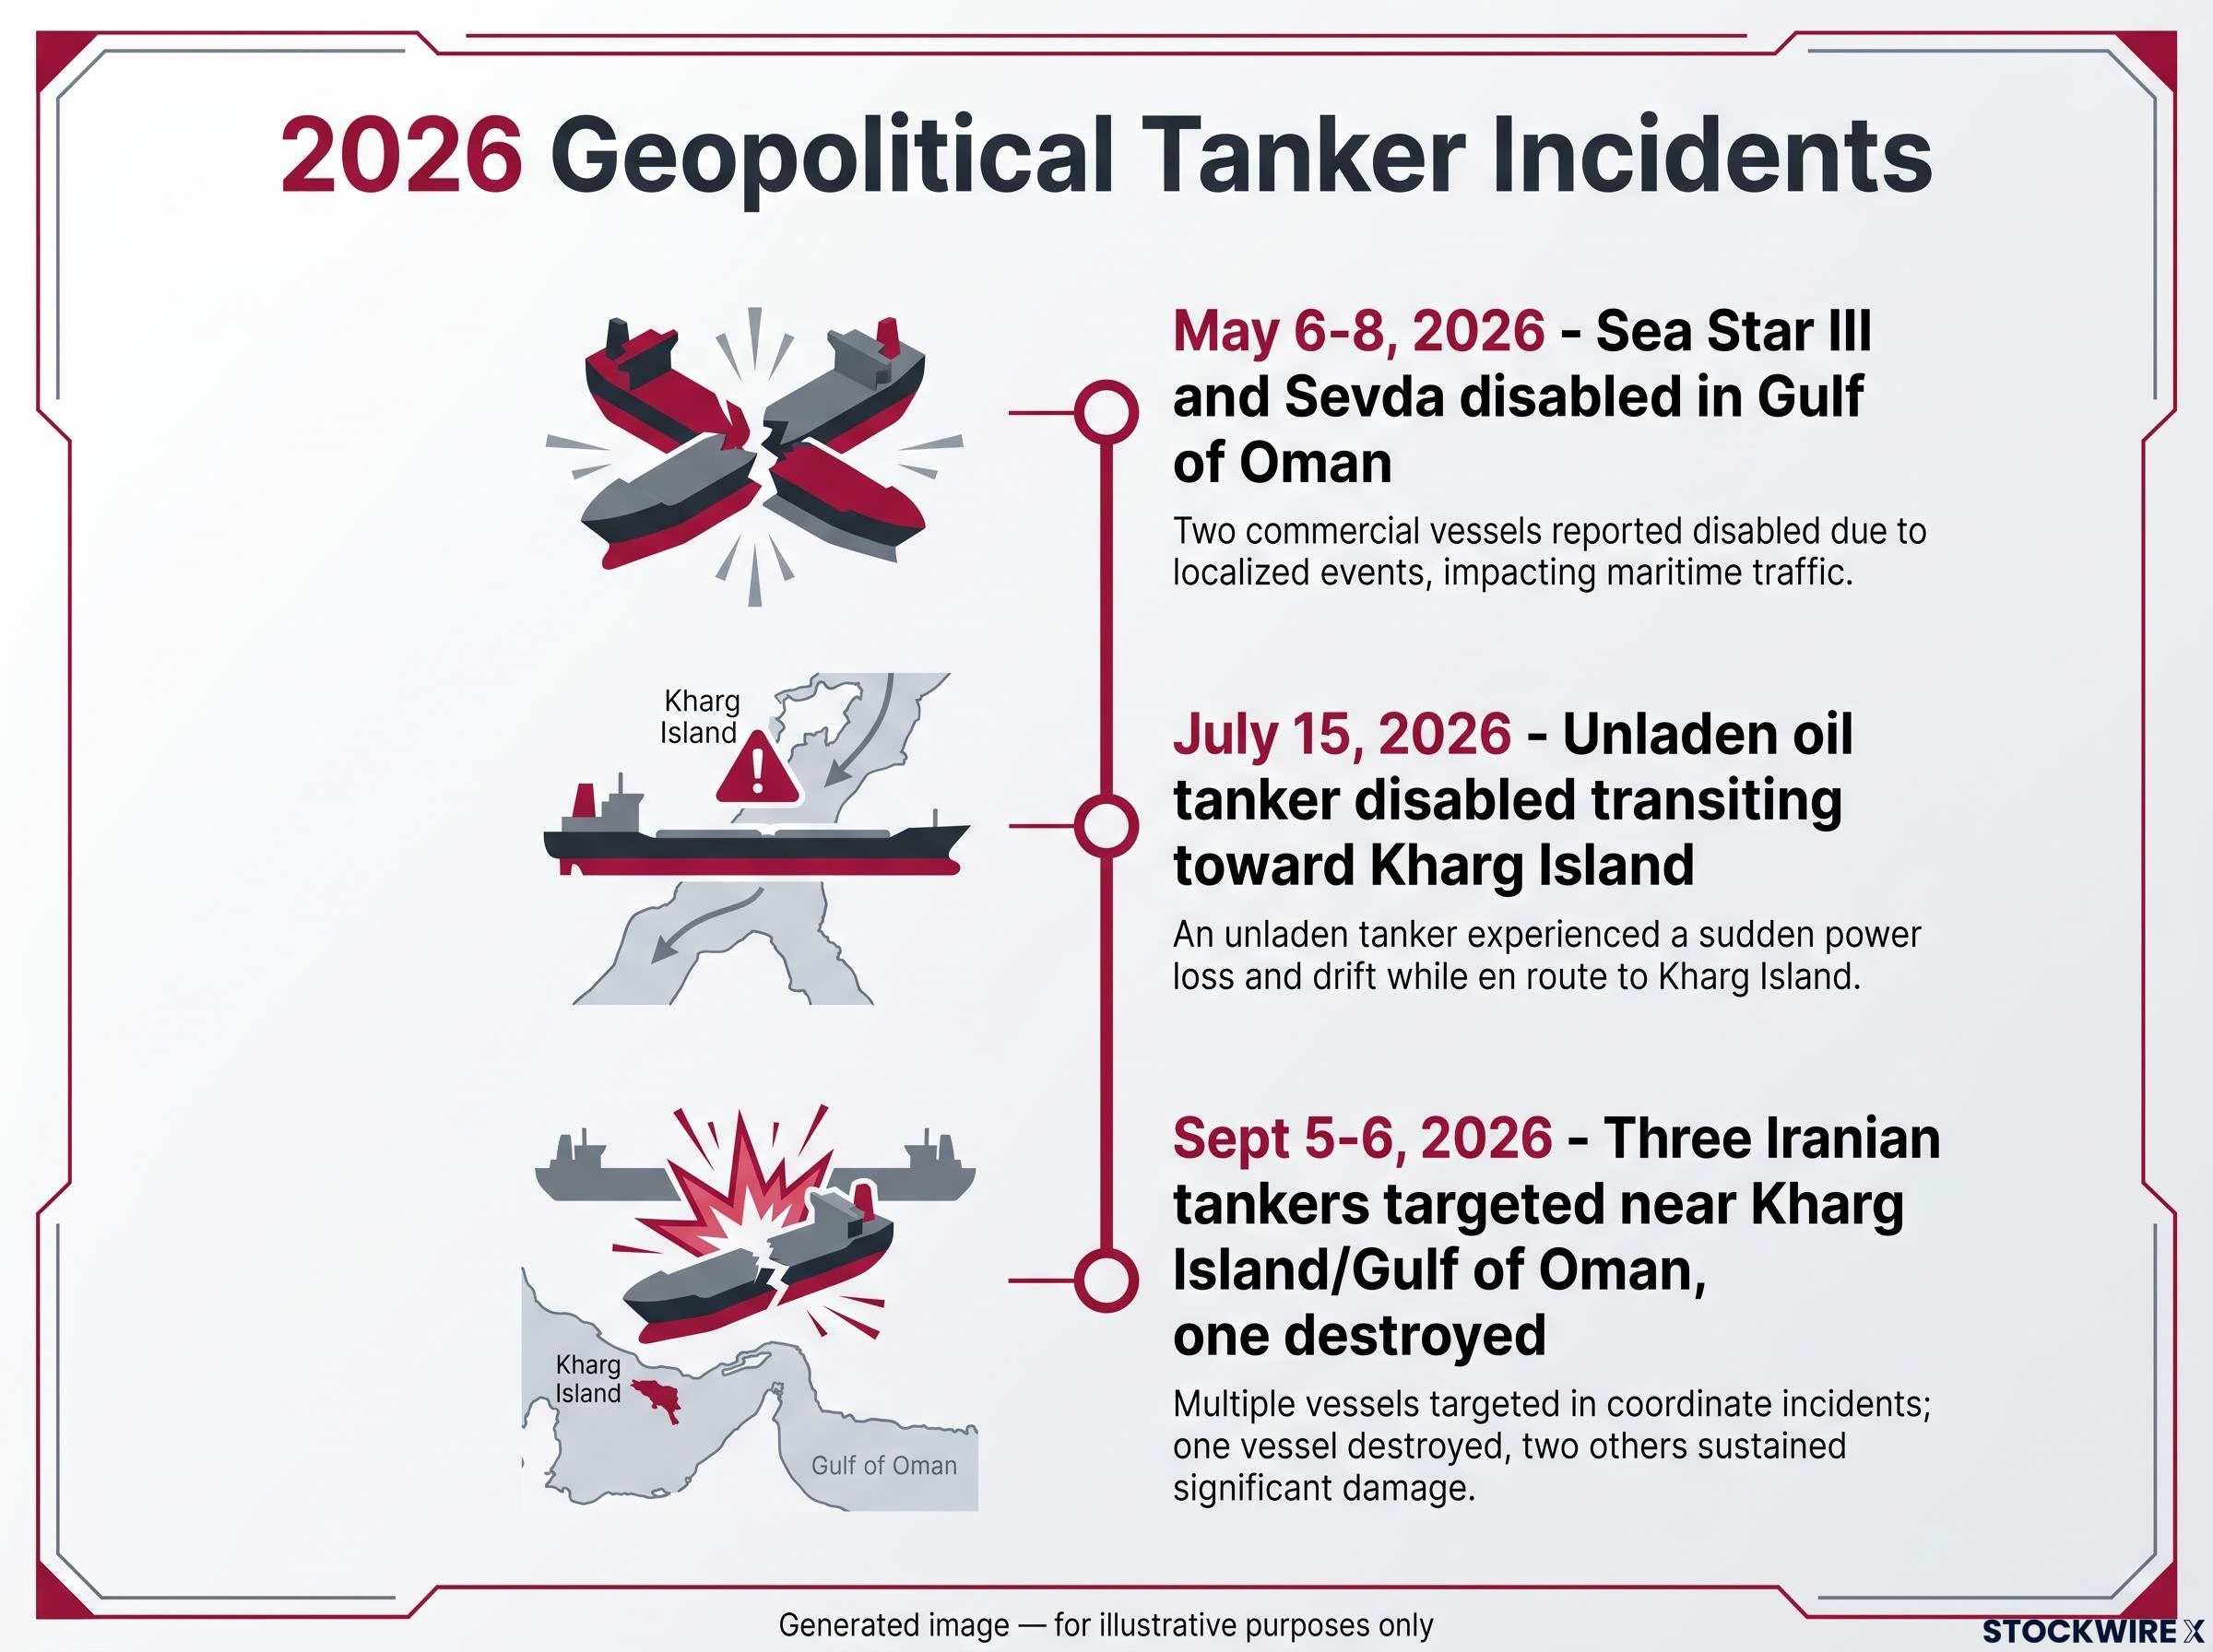
The oil move has a specific, evidenced cause. Over the weekend of 5-6 September 2026, US forces struck three Iranian oil tankers after Navy ships were targeted by missiles, according to US Central Command, with one vessel confirmed destroyed. The strikes were reported by NPR and The New York Times, and Iranian state media later confirmed them.
This was not an isolated event. The confirmed timeline runs back through the summer and spring:
| Date | Target | Location | Outcome |
|---|---|---|---|
| 5-6 September 2026 | Three Iranian tankers | Kharg Island, Gulf of Oman, near Jask | One vessel destroyed |
| 15 July 2026 | Unladen oil tanker | Transit toward Kharg Island | Disabled after ignoring warnings |
| 6-8 May 2026 | Sea Star III and Sevda | Gulf of Oman | Both disabled |
On price, the picture is fast-moving and the reference points differ. Reuters recorded WTI settling at $90.22 per barrel on 1 September 2026, up 5.2% on the session. The original source’s $97 level, up 0.8%, reflects early Monday trading on a later session. These are two observation points in a rapidly shifting market, not a contradiction to resolve.
The risk premium is where the real uncertainty sits. There is no consensus on what the fair geopolitical buffer actually is.
The Hormuz crisis entered a new phase on 18 August 2026 when the US-Iran MOU expired with no extension, converting a time-limited disruption into an open-ended standoff running at just 11-12 vessel transits per day against a pre-crisis baseline of 73 to 120, a structural supply constraint that sits directly underneath the risk premium debate playing out in crude futures this week.
Goldman Sachs estimates traders now demand roughly $14 per barrel of risk premium versus pre-conflict levels, contingent on the severity and duration of any Strait of Hormuz restrictions.
BloombergNEF analysis suggests a far more modest premium, closer to $4 per barrel currently embedded, with scenarios where a full disruption of Iranian exports could push Brent toward $91 in Q4 2026. That figure is flagged as unverified in the underlying research.
The spread between $14 and $4 is not an error. It is a signal. Anyone trading crude or energy equities this week is operating without agreement on the fundamental buffer, and that is precisely why volatility persists.
For your purposes, the second-order effect is the one that matters. Elevated crude feeds directly into the CPI components the Fed will see on Friday. Dallas Fed modelling, also flagged as unverified, suggests headline PCE could run roughly 0.6 percentage points higher in Q4 under a realistic scenario. That means oil above $90 could reinforce the hike case even if wage data stays benign.
Gold’s 4% drop in context: what central banks are doing while traders sell
Gold fell 4% on Friday, hovering near $4,444, and on the surface that looks like a demand problem. It is not.
The mechanism is real yields. According to Deutsche Bank-linked research, the hawkish repricing of Fed policy under Chair Kevin Warsh has lifted real yields, raising the opportunity cost of holding gold, which pays no yield. That triggered ETF outflows and futures unwinds. It is a positioning event, not a collapse in underlying demand.
The proof is in what central banks are doing at the same time. The World Gold Council (WGC), reported via TASS on 3 September 2026, recorded net global central bank buying of 23 tonnes in July 2026.
| Country | Direction | Tonnes | Note |
|---|---|---|---|
| China | Buy | +20 | Largest single buyer in July |
| Poland | Buy | +8 | Continued accumulation |
| Czech Republic | Buy | +2 | Steady reserve building |
| Russia | Sell | -6 | Attributed to Ukraine conflict financial pressures |
| Turkey | Sell | -1 | Minor reduction |
Zoom out and the structural bid is even clearer. The WGC’s Gold Demand Trends Q2 2026 report, published 30 July 2026, showed central banks bought a net 289 tonnes in Q2 2026, the strongest second-quarter figure on record and a 62% increase year-over-year. First-half buying totalled roughly 345 tonnes.
The World Gold Council Gold Demand Trends Q2 2026 report documents 289 tonnes of net central bank purchases in the quarter, the strongest second-quarter figure on record, providing the authoritative baseline against which the Friday session’s 4% price drop reads as a positioning event rather than a structural shift.
So the decline and the buying coexist without contradiction. Traders are selling on rising real yields while reserve managers accumulate underneath them.
Central bank gold buying is driven primarily by jurisdictional safety rather than price appreciation objectives, with the 2022 freezing of Russian reserves converting that motivation from theoretical to demonstrated, which is why the 289-tonne Q2 buying record and the 4% single-session price drop can coexist without contradiction.
The structural floor argument and where it holds
Goldman Sachs frames central banks as price-insensitive buyers who accumulate into weakness, absorbing speculative selling and tightening the free float. That is the structural floor argument, and the Q2 record supports it.
The sceptical case comes from J.P. Morgan-linked commentary, which notes official demand can cool. If central bank buying slows or reverses, the rate-driven correction loses its cushion, leaving gold more exposed at current real-yield levels.
Both cases point to the same arbiter. What the buying data tells you is that the long-term bid remains intact, but at current Treasury yields, rate-driven selling is winning short-term. Whether that persists turns on Thursday’s PPI and Friday’s CPI as directly as it does for any other asset. A single-session drop of this size against record official buying is a positioning move, not a fundamental signal.
The White House, Fed independence, and what political noise actually means for markets
The pressure has been escalating on a clear timeline, and neither the dismissive read nor the alarmist one captures it.
Here are the three documented pressure episodes:
- 12 March 2026: President Donald Trump demanded aggressive rate cuts on social media, calling rates “artificially high,” language that unsettled bond markets, per Wedbush MarketMinute coverage.
- 20 August 2026: Trump again called rates “artificially high” on the same day US debt crossed $40 trillion, according to USA Today.
- Post-jobs report: Following the strong August print, Trump threatened to “stop trading” with countries running a surplus with the US unless the Fed cut rates.
How markets actually respond is the point that separates signal from noise. Analysts at IG and Investing.com link presidential pressure to dollar weakness, gold spikes, and equity volatility. Reuters has documented episodes where such pressure weakened the dollar and pushed gold to record highs.
Yet futures markets have continued to price September hike odds above 60%, which tells you the committee is being read as data-responsive, not politically compliant. At the July 2026 meeting, Chair Warsh held rates, equities sold off, yields jumped, and September hike odds still moved to roughly 65% afterward.
Trump’s trade threat to Fed rate cuts represents a qualitative departure from earlier pressure campaigns, attaching a geopolitical consequence the central bank cannot itself address, yet prediction markets gave any 2026 cut roughly 0.2% odds even before the August payrolls print hardened the tightening bias further.
Chair Powell has characterised certain investigations of the Fed as a “pretext” to force faster rate cuts.
The Washington Post warned on 30 January 2026 of bipartisan alarm over eroding Fed independence. The practical implication for you is not that the Fed cuts against its mandate this cycle. It is that perceived independence is itself a variable, one that can reprice risk assets rapidly if the boundary between rhetoric and interference shifts. That threshold may be closer than markets are pricing.
The data calendar that decides whether this week’s risk read holds
Everything above is backward-looking. What comes next is the decision framework, and it is structured as a decision tree rather than a single event.
Three catalysts define the week:
- PPI (Thursday): Producer price data that narrows the range before CPI.
- CPI (Friday): The consumer inflation read that Schwab and CNBC describe as likely to be the deciding factor for the Fed.
- Oracle earnings (Thursday post-close): A fresh read on AI-infrastructure demand, framed by Tapis Strickland, chief market strategist at Mumu, as a bellwether for the AI buildout thesis.
Here is how the conditional logic maps out:
| Data Outcome | Likely Fed Response | Key Asset Implications |
|---|---|---|
| Above consensus | September hike more likely | Pressure on equities, housing, credit; dollar firmer; gold weaker |
| In line | Decision stays open, data-contingent | Range-bound; volatility persists into FOMC |
| Below consensus | Pause supported | Gold and long-duration bonds potential beneficiaries |
Thursday’s PPI narrows the range before Friday’s CPI delivers the likely verdict ahead of the 15-16 September 2026 FOMC meeting. Map those conditional outcomes in advance and you interpret the releases faster, with less reactive noise, than someone reading each number cold.
What the cross-asset picture tells investors heading into a decisive week
The four forces are not randomly coincident. They are branches of a single tree, and real yields are the trunk.
The strong jobs print lifts real-yield expectations. That weighs on gold, supports the dollar, and raises crude’s relevance to CPI, which circles straight back to the Fed’s September calculus. Track the real-yield channel and the whole week reads as one coherent story rather than four disconnected releases.
The tension that remains genuinely unresolved is worth naming plainly:
- Payrolls versus wages: the +162,000 beat argues for a hike, while 3.1% wage growth argues for a pause.
- Oil premium range: a $4 to $14 risk premium with uncertain CPI pass-through.
- Gold buying versus rate pressure: 289 tonnes of Q2 official buying against rate-driven positioning sells.
The organising insight is this. Assets that benefit from lower real yields, gold, long-duration bonds, and rate-sensitive equities, sit in direct opposition to those that benefit from higher real yields, the dollar, short-duration instruments, and energy. PPI and CPI this week decide which side wins.
If inflation surprises to the upside, the Fed faces a decision where political pressure to hold conflicts with its mandate to act. That conflict, against a $40 trillion debt backdrop and three documented pressure episodes, would reprice risk assets more sharply than a routine hike.
This article is for informational purposes only and should not be considered financial advice. Investors should conduct their own research and consult with financial professionals before making investment decisions.
Past performance does not guarantee future results, and the scenarios described here are speculative and subject to change based on market developments and incoming data.