You have watched semiconductor stocks generate some of the most extraordinary returns of the decade, and part of you wants in. The other part remembers that this same sector can shed 40-60% in a downturn, and you have no idea how much exposure is too much.
That tension is the whole problem. Own too little and you miss the structural story driving AI, cloud, and electrification. Own too much and a single cyclical correction can gut your portfolio.
There is a named, structured answer to this, and institutional investors have used it for decades: the core-satellite strategy. It is the portfolio construction method that lets you hold a high-conviction thematic bet without letting one volatile sector decide the fate of your entire portfolio.
This piece gives you a working framework you can actually use. You will learn how to size a semiconductor satellite, which exchange-traded fund (ETF) characteristics suit which objectives, what risks to price in before you commit, and what a rules-based rebalancing discipline looks like in practice. Treat it as a decision-ready toolkit, not a theory lesson.
What the core-satellite method actually does for your portfolio
Before any numbers matter, you need the structural logic. The framework splits your portfolio into two jobs, and understanding why those jobs are separate is what makes every later decision coherent.
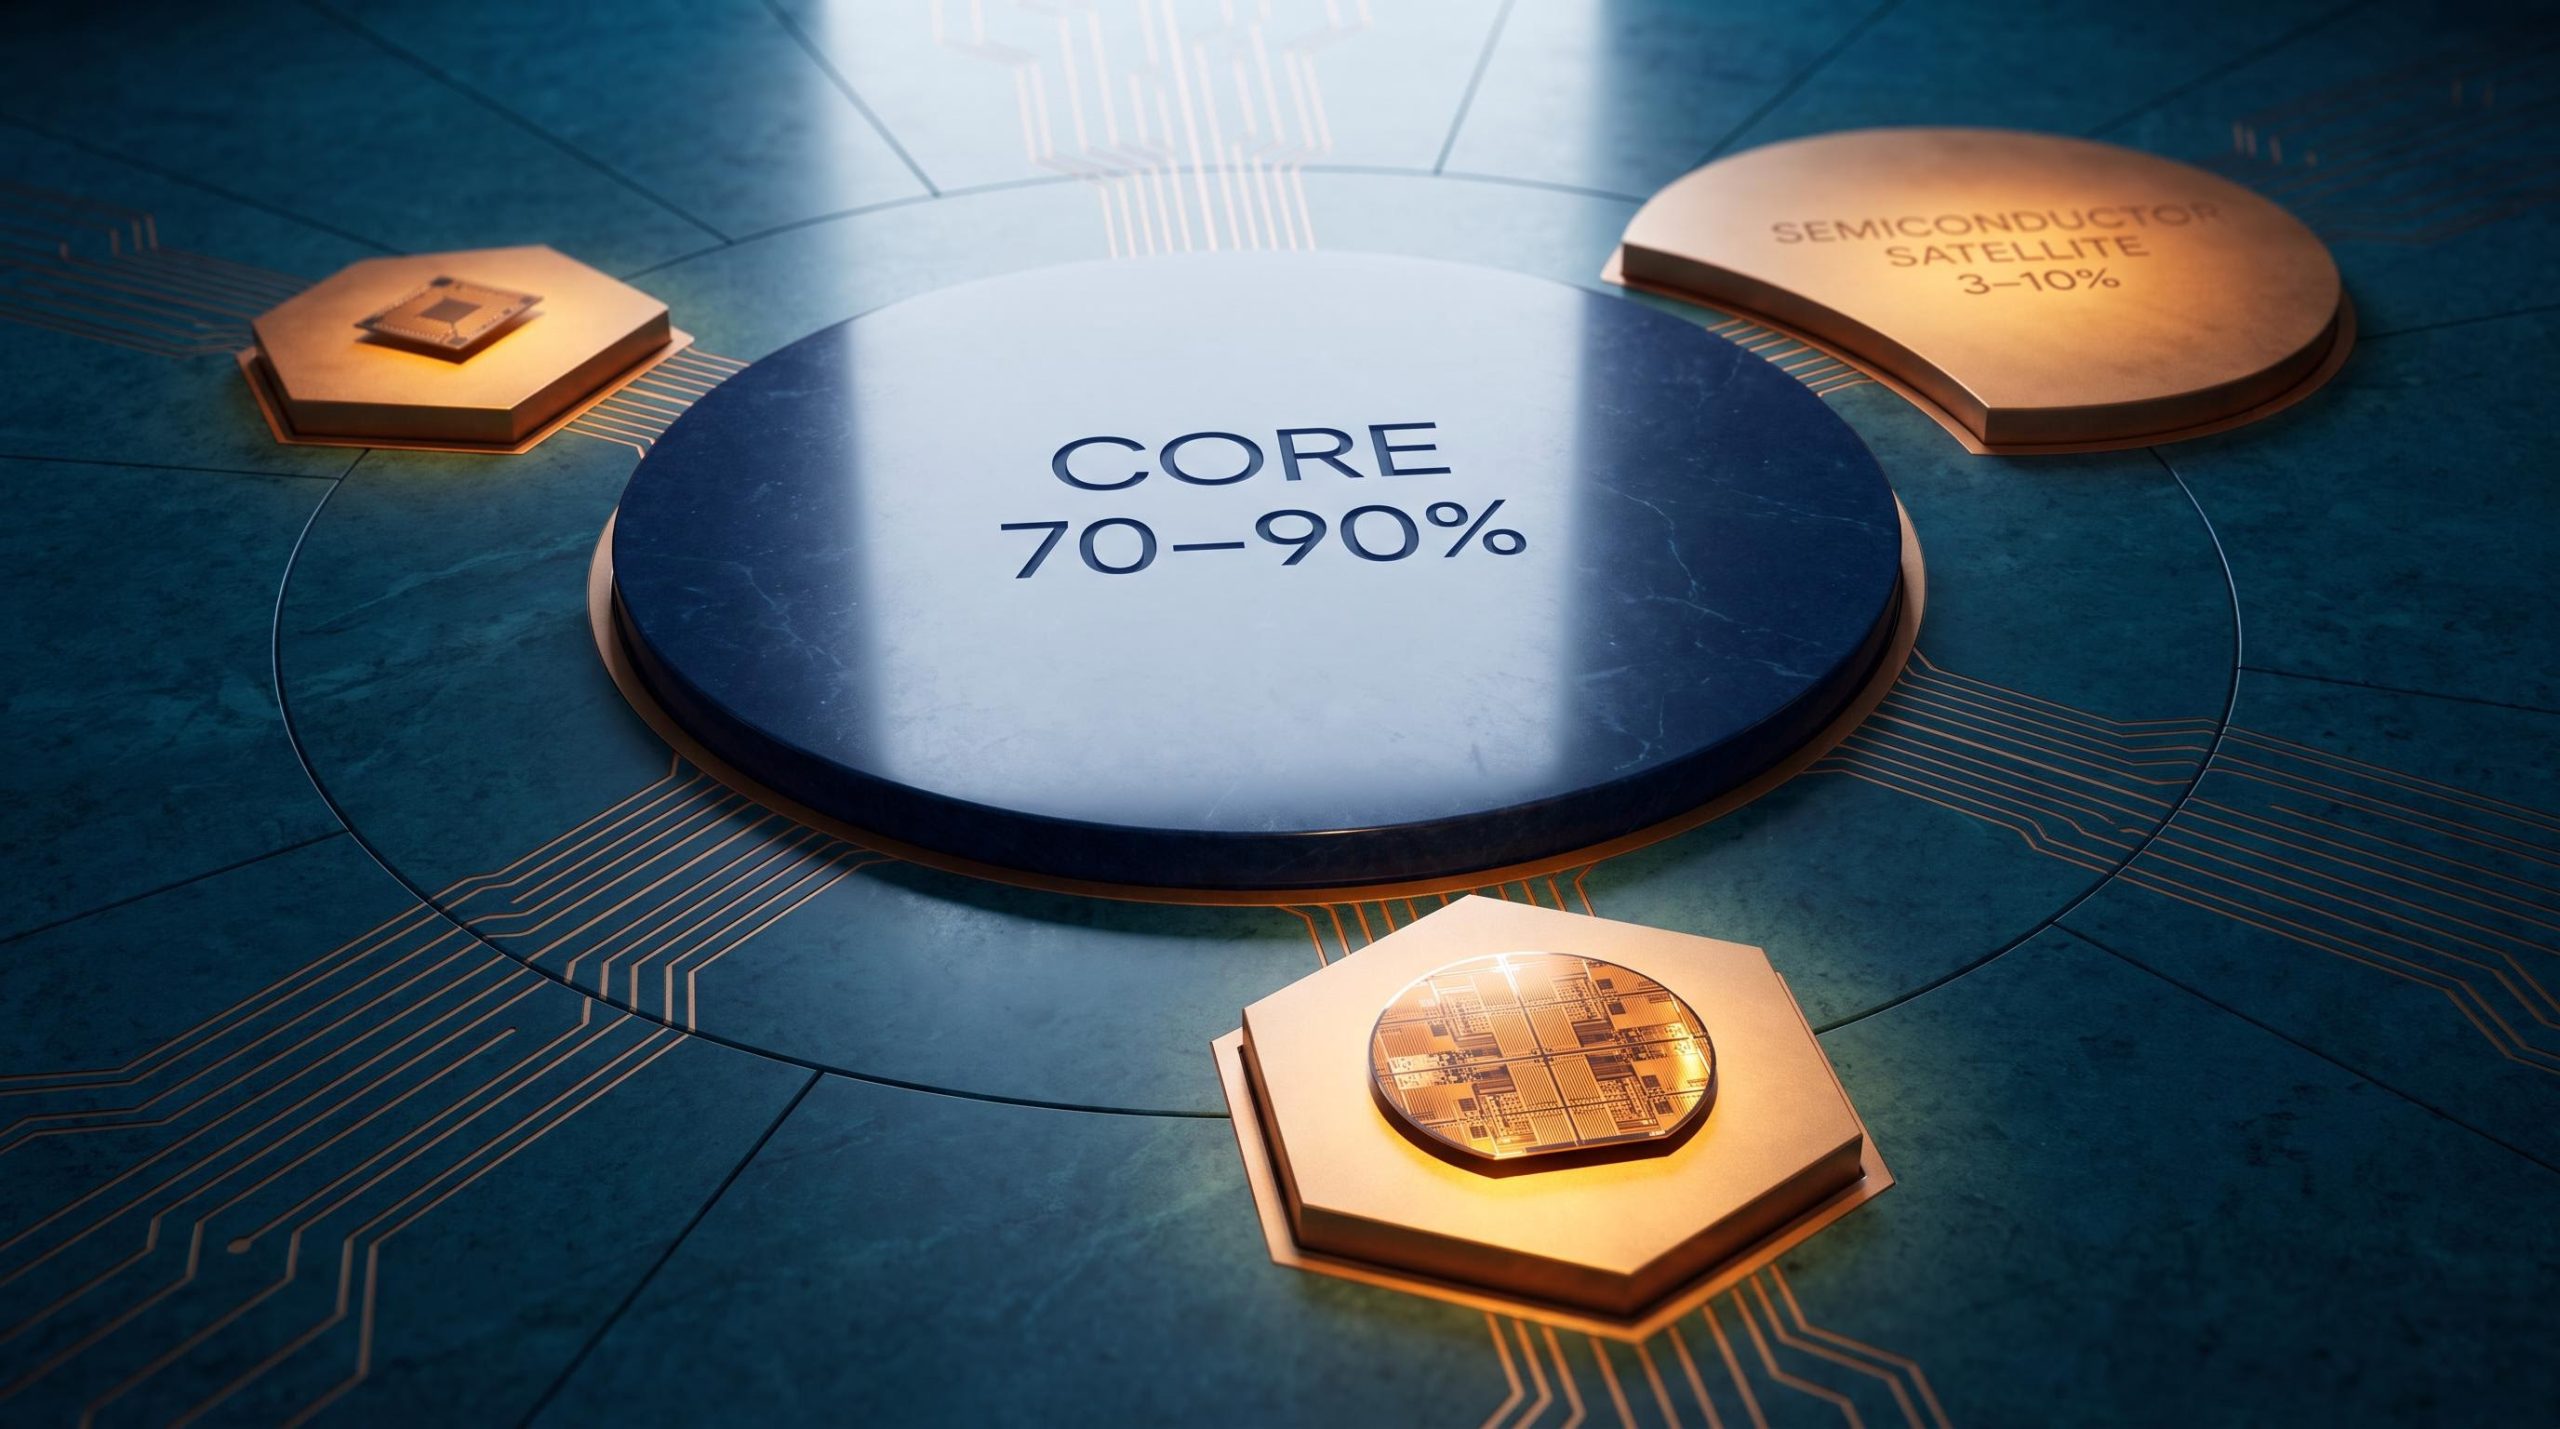
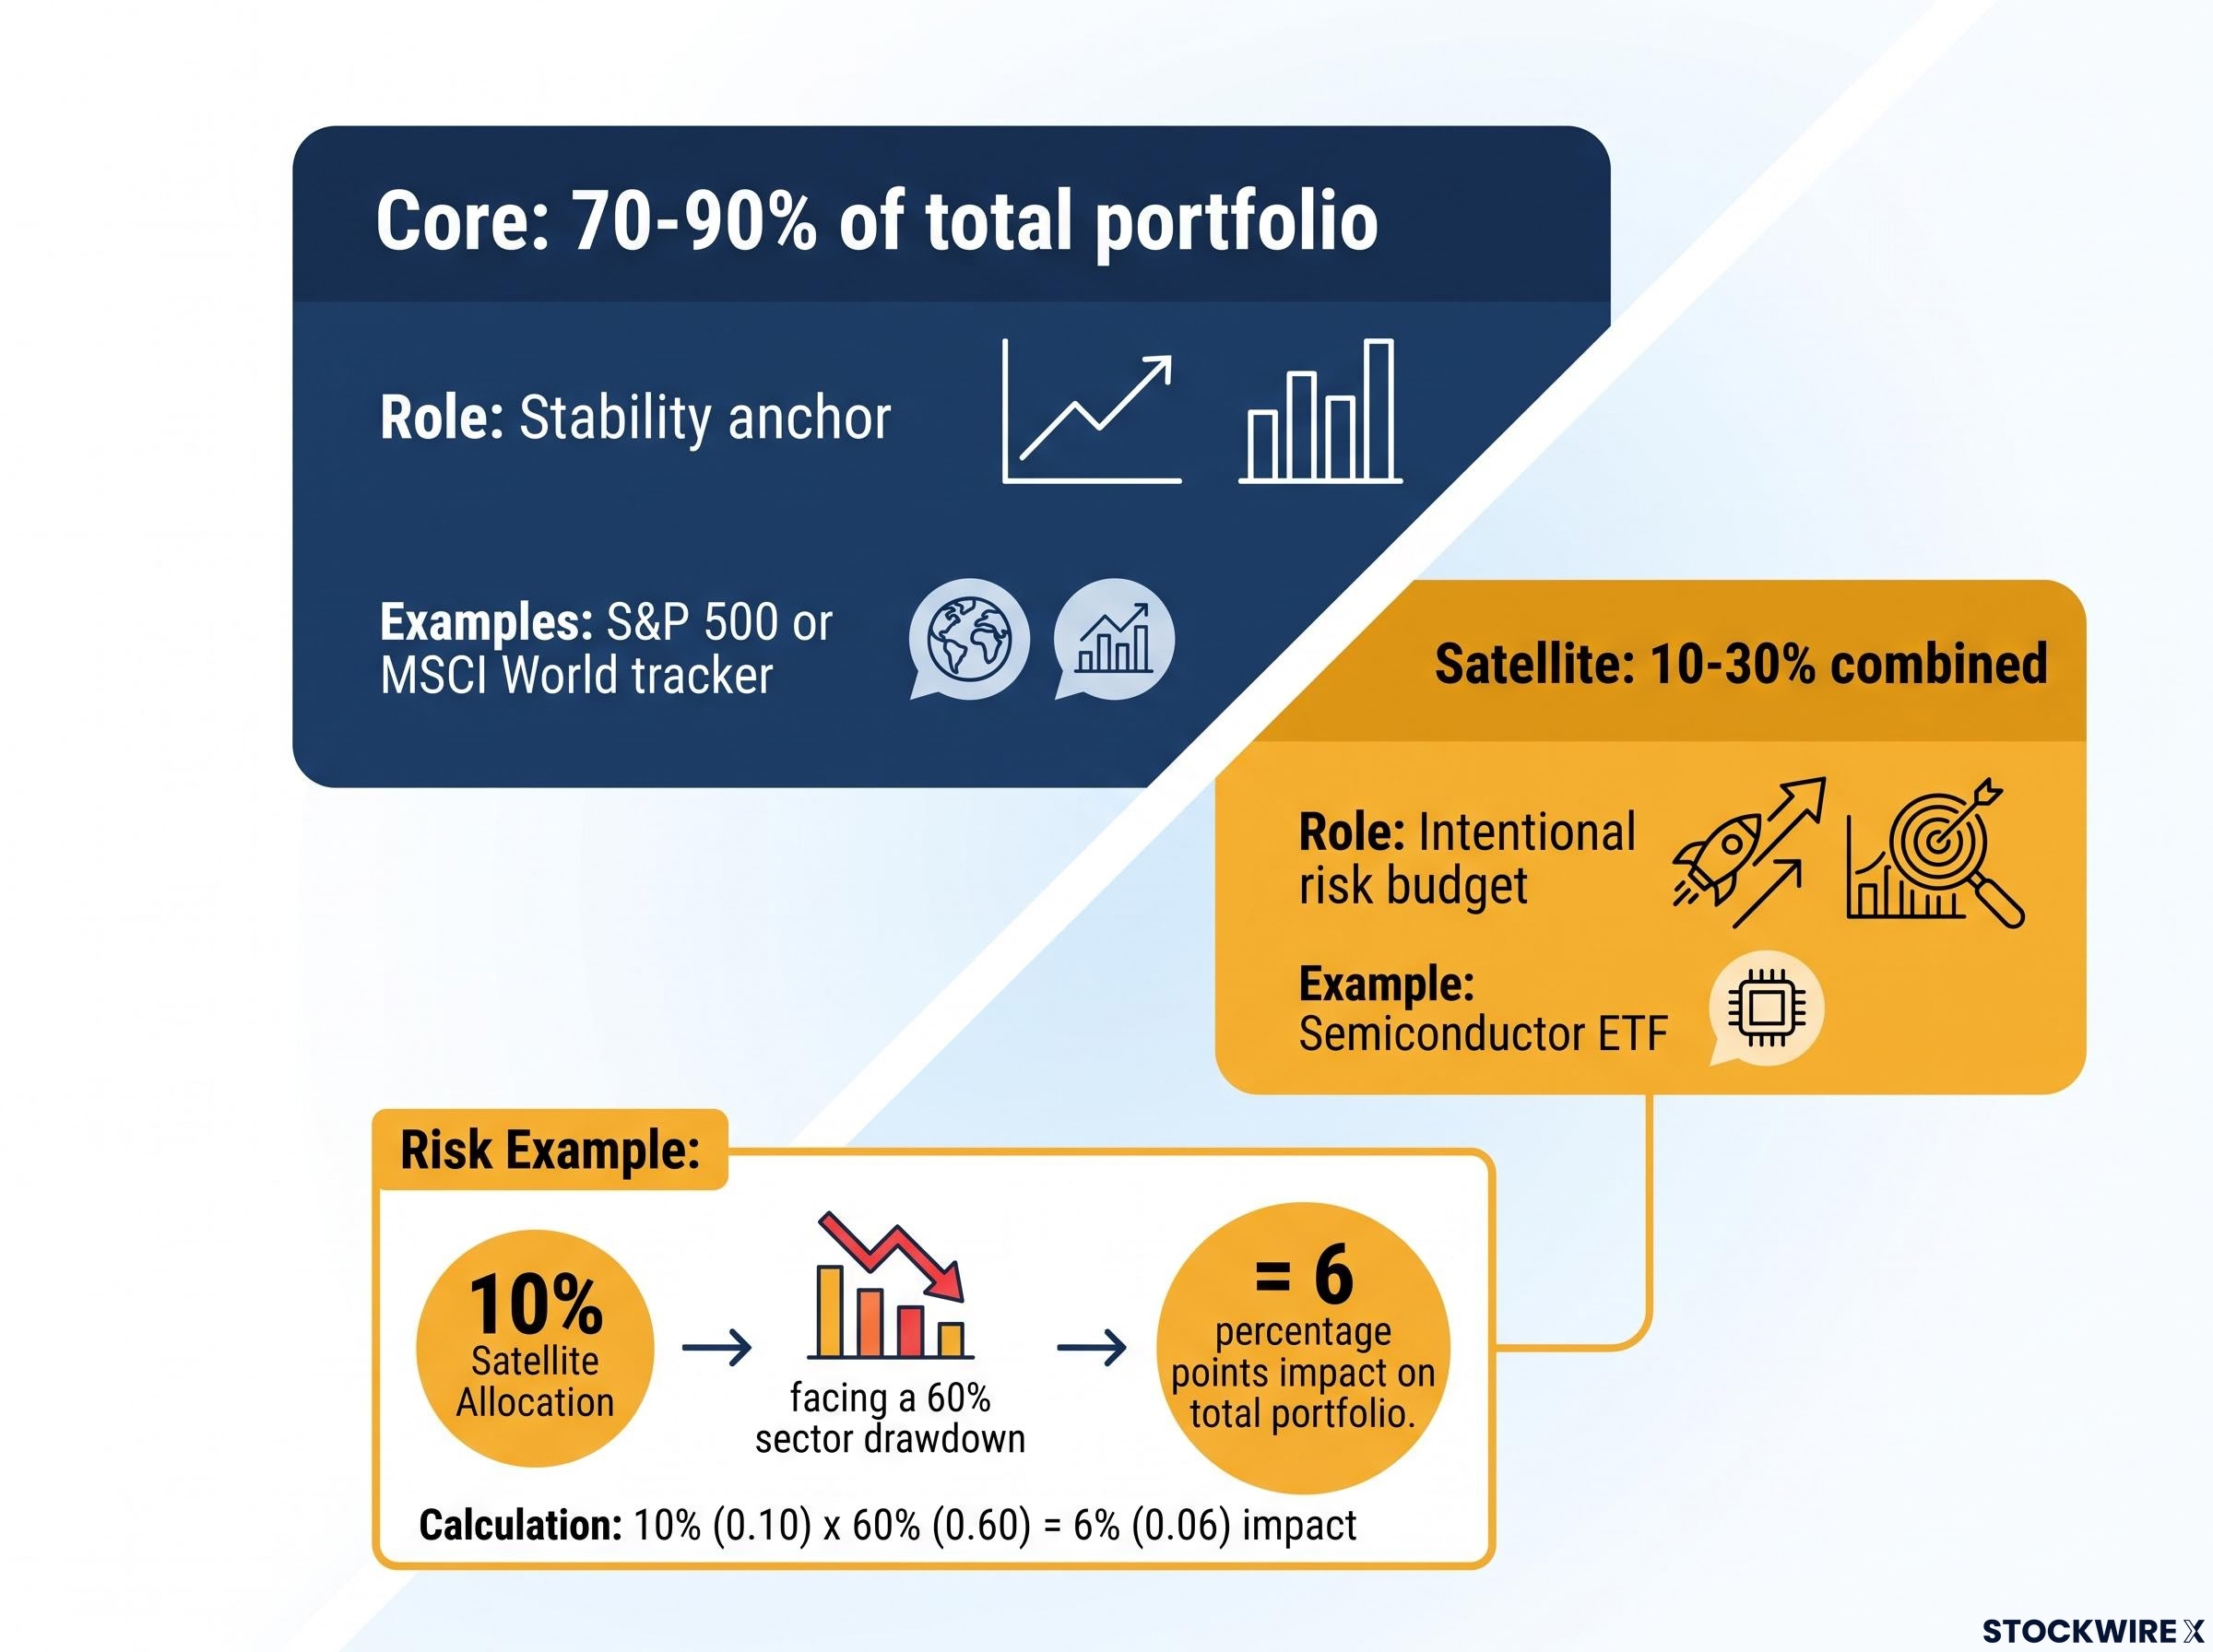
The core is your stability anchor. It holds 70-90% of your total portfolio in a broad, low-cost index fund, typically an S&P 500 tracker or an MSCI World equivalent. Its job is not to excite you. Its job is to stay diversified across regions and sectors so that the total portfolio survives whatever the satellite does.
The satellite sleeve is your intentional risk budget. It is a smaller set of targeted positions, usually 10-30% combined across every thematic tilt you hold, designed to add conviction exposure without threatening the core’s diversification function.
Here is why the structure works, and it comes down to arithmetic you can do in your head.
Say your semiconductor satellite is 10% of your portfolio, and the sector suffers a brutal 60% drawdown. That catastrophic sector event costs your total portfolio just 6 percentage points. The core absorbs the rest.
| Sleeve | Allocation Range | Role |
|---|---|---|
| Core | 70-90% of total portfolio | Stability anchor. Broad global or developed-market index fund (S&P 500 or MSCI World tracker) providing diversification across regions and sectors. |
| Satellite | 10-30% combined across all thematic positions | Intentional risk budget. Targeted thematic or sector tilts (such as a semiconductor ETF) that add conviction exposure without threatening the core. |
That arithmetic is the reassurance you need. Size the satellite correctly, and a worst-case sector event becomes a manageable dent rather than a portfolio disaster.
The mathematical case for satellite diversification is rooted in the same principle Dalio formalised at Bridgewater: combining uncorrelated return streams in a risk-balanced portfolio can reduce total volatility by a factor that exceeds what any individual position improvement could achieve, which is precisely why the core-satellite structure produces better risk-adjusted outcomes than simply owning a single diversified fund.
This is the permission structure that makes a thematic bet rational rather than reckless. You are not betting the house. You are placing a contained, deliberate wager funded by a fixed slice of capital, and the core is doing the heavy lifting of keeping you invested.
When big ASX news breaks, our subscribers know first
Why semiconductors fit the satellite sleeve, not the core
Semiconductors have a split personality, and once you see it, where they belong in your portfolio becomes obvious.
The structural growth case
Over the long run, chips are the physical layer underneath almost every major technology trend. Four demand pillars are driving that: AI accelerators, cloud hyperscaler capital expenditure, automotive electrification, and edge computing.
The numbers behind that story are substantial. According to projections referenced by TSMC (via Reuters) and industry body SEMI, worldwide semiconductor revenues are on a trajectory toward $1.5 trillion, with AI accelerators, automotive electrification, and edge computing named as the primary growth drivers.
That is a multi-decade demand curve, not a passing rally. It is exactly the kind of conviction thesis that justifies putting a sector in your portfolio at all.
What the historical record says about volatility
The problem is that the same sector whipsaws violently in the short term. Chip demand is highly sensitive to inventory corrections, swings in end-market demand for phones and PCs, and the capital expenditure cycles of the manufacturers themselves.
Two recent episodes make the point. In 2018-2019, a correction in smartphone and memory demand triggered a sharp sector downturn even though the long-term structural story stayed fully intact. After 2022, rising interest rates and recession fears drove substantial drawdowns across semiconductor names, and this happened while the AI narrative was actively strengthening.
The magnitude here is what matters for portfolio construction. Peak-to-trough drawdowns of 40-60% are a normal feature of this sector’s cycle, not a rare tail-risk event.
Semiconductors are cyclical in the short term and structural in the long term. That single sentence is why they belong in your satellite sleeve and not your core.
A core position anchoring 70-90% of your portfolio could not survive that kind of volatility without damaging your long-term goals. But a small satellite position can absorb a 50% drawdown and still leave your total portfolio standing.
So the takeaway is not that semiconductors are too risky to own. It is that their risk profile fits the satellite sleeve precisely because it rewards a long horizon and punishes an oversized position during a downturn.
How to size your semiconductor satellite position
Now for the most actionable question: how much? The honest answer is that it depends on you, and practitioner guidance falls into three camps along a spectrum you can locate yourself on.
At the conservative end sit financial planners and large asset managers such as Vanguard, Schwab, and Fidelity. They treat sector and thematic ETFs as high-volatility satellites and typically cap any single volatile sector at a modest slice. Morningstar’s commentary on sector funds has repeatedly warned against large single-sector bets for retail investors.
In the middle are moderate-growth ETF strategists. They argue that a genuine secular theme like semiconductors, the picks and shovels for AI, cloud, and electrification, can justify a larger tilt for investors with high risk tolerance and long horizons.
At the aggressive end are high-conviction concentrated investors. Some advocate larger satellites, but even they stress these are only suitable for people who can stomach 50-70% drawdowns in the satellite portion and who understand the underlying businesses deeply.
| Risk Profile | Semiconductor Satellite (% of Total Portfolio) | Rationale |
|---|---|---|
| Conservative | 3-5% | Big enough to matter, small enough that a cyclical downturn or policy shock cannot jeopardise long-term goals. |
| Moderate | 5-10% | Meaningful conviction tilt for investors comfortable with sector volatility and holding through the cycle. |
| Aggressive (experienced only) | up to ~15% | High-conviction weight for those who can tolerate deep drawdowns and hold for multi-decade horizons. |
Use that table as a self-diagnostic tool, not a recommendation. Identify your own risk profile and commit to that allocation before you enter the position, not after a rally has already inflated it past a level you can manage.
Your risk profile assessment should account for three concrete factors: time horizon, income stability, and your genuine capacity to hold through a 20-30% portfolio drawdown, not your self-perception of how calm you would feel during one.
Note that the semiconductor-specific slice (3-10% for most retail investors) sits inside the broader satellite sleeve, which may run 10-30% across all your thematic positions combined.
Sizing is only half the discipline. The position must come with rules for what happens when it moves.
- Trim trigger: Cut the position back to target when it overshoots by a set band, either 25% relative or 2-3 percentage points absolute, after a strong rally.
- Add trigger: Add gradually during deep drawdowns when the structural drivers remain intact and the sector is simply in a cyclical correction, using post-2022-style sell-offs as the reference case.
- Holding horizon: Plan to hold for 5-10 years to capture compounding from the AI, cloud, and electrification cycles. This is a structural tilt, not a trade.
Choosing the right ETF for your satellite objective
Which fund you pick is not about ranking products. It is about matching the ETF to the specific satellite objective you have, and the two most common choices sit at opposite ends of the concentration spectrum.
The VanEck Semiconductor ETF (SMH) gives you concentrated mega-cap exposure, heavily weighted toward the handful of large AI-chip designers. The SPDR S&P Semiconductor ETF (XSD) takes a broader, more equal-weighted approach across the semiconductor ecosystem, giving you a mid-cap tilt. Same sector, very different risk and return profiles, driven entirely by how each fund concentrates.
The performance gap tells the story of the past decade. Over 10 years, SMH returned an annualised 33.21% against XSD’s 24.55%, according to data from PortfoliosLab updated April 2026. Year-to-date, the two are much closer, with SMH up 53.6% and XSD up 50.11%.
Where the market has placed its money is the more revealing signal.
Year-to-date, SMH pulled in roughly $8.53 billion in flows. XSD drew approximately $182 million. Institutional and retail capital has concentrated overwhelmingly in the mega-cap structure.
| Metric | SMH | XSD |
|---|---|---|
| Expense ratio | 0.35% | 0.35% |
| 10-year annualised return | 33.21% | 24.55% |
| Year-to-date performance | +53.6% | +50.11% |
| Year-to-date flows | ~$8.53 billion | ~$182 million |
| Total net assets | ~$66-68 billion | ~$1.7-2.6 billion |
| Best-fit profile | Concentrated mega-cap AI-chip conviction | Broader ecosystem, lower single-name risk |
Here is the part you must understand before choosing SMH. The mega-cap concentration that amplified its returns during the AI rally is the same concentration that makes it acutely exposed to a policy shock targeting a small number of named AI-chip firms. The premium and the vulnerability come from the same source.
If you are based in Asia, geography adds a practical layer. Regional listings such as 3119.HK on the Hong Kong exchange and HST.SI on the Singapore exchange let you trade during Asian market hours and avoid unnecessary currency conversion friction.
So the choice follows from three things: your satellite objective (concentrated conviction or broader spread), your geographic situation, and your own read on regulatory risk.
The risk layer you cannot price in from a chart
Volatility and drawdown history are the risks you can see on a chart. The risks that matter most for a semiconductor satellite right now do not appear there at all. Managing this position means monitoring policy, regulation, and geopolitics, factors no standard risk dashboard captures.
Policy and export control risk
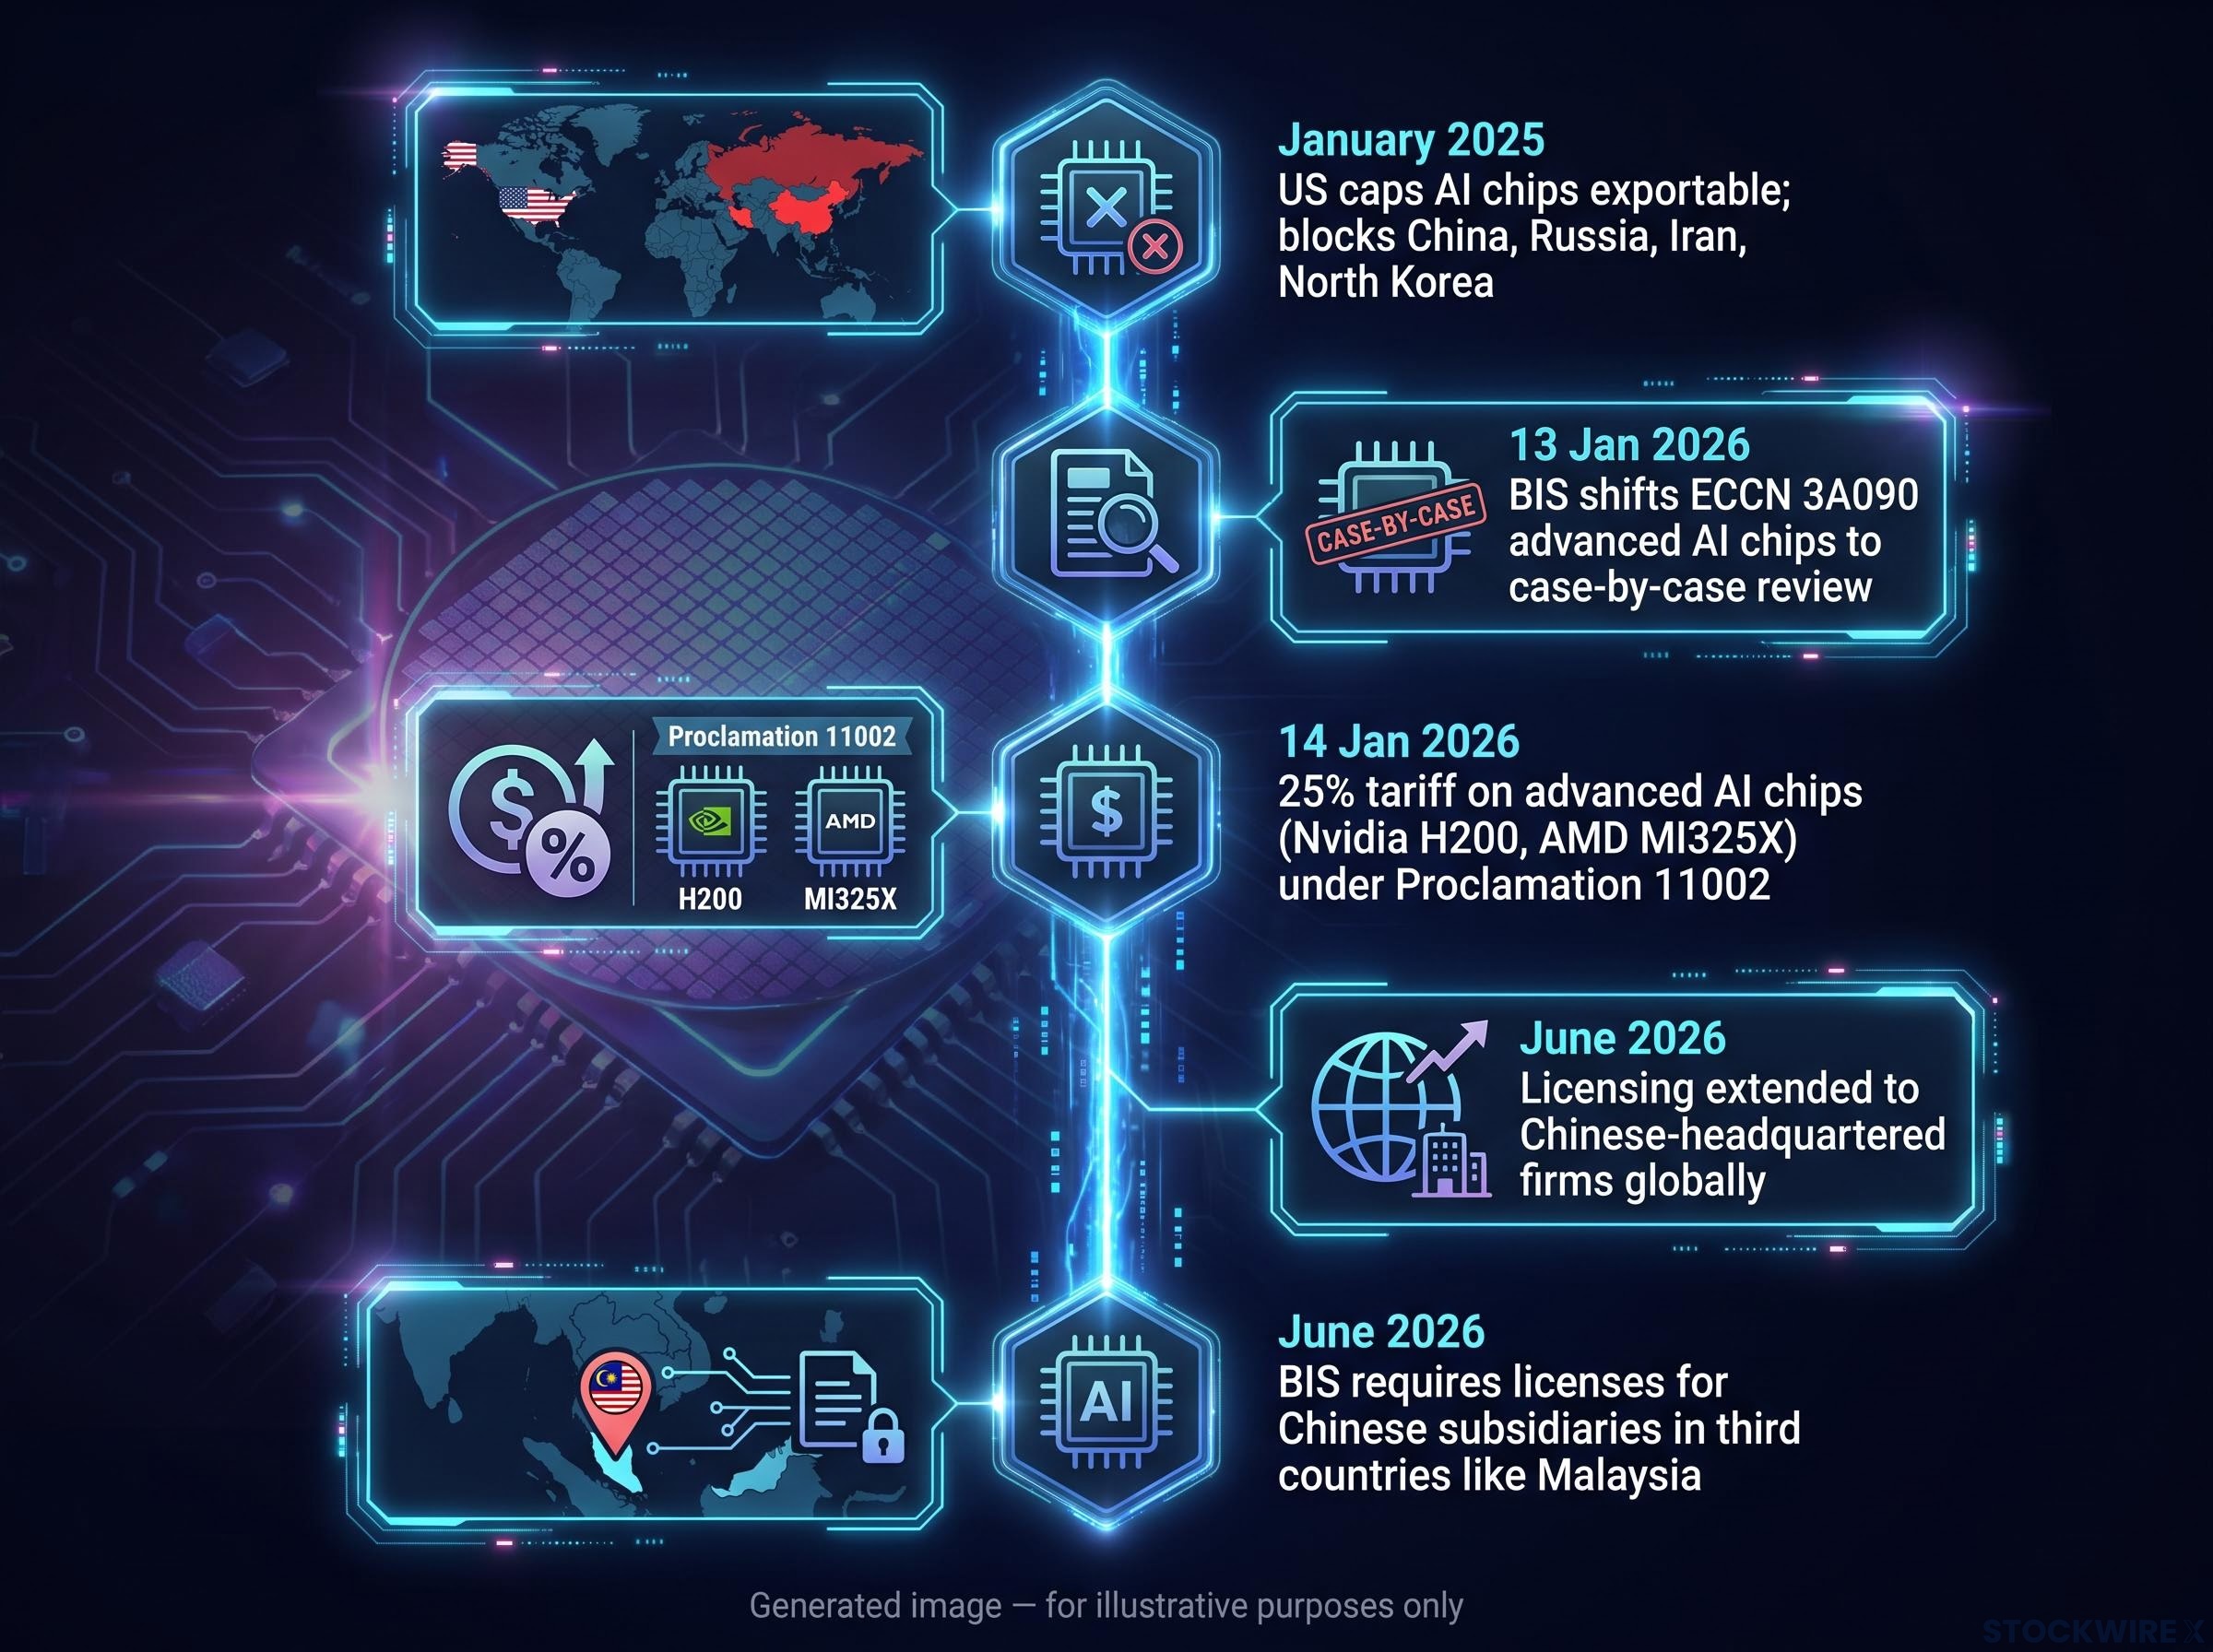
Export control policy has fundamentally changed the risk profile of a mega-cap-concentrated semiconductor satellite. The 2025-2026 regulatory timeline shows an accelerating sequence, not a one-off event.
- January 2025: The US introduced regulations capping the number of AI chips exportable to most countries, maintaining a full block on China, Russia, Iran, and North Korea while granting broader access to close allies, according to Reuters.
- 13 January 2026: The Commerce Department’s Bureau of Industry and Security (BIS) issued a final rule shifting advanced-node AI chips controlled under Export Control Classification Number 3A090 from a presumption of denial to case-by-case review.
- 14 January 2026: A 25% tariff was imposed on certain advanced AI chips, including Nvidia’s H200 and AMD’s MI325X, under Proclamation 11002.
- June 2026: Licensing requirements were extended to all businesses with headquarters or a parent company in China, regardless of where their operations sit, according to Al Jazeera.
- June 2026: BIS clarified that sales to Chinese subsidiaries in third countries such as Malaysia require an export license, closing an offshore loophole.
The pattern here matters more than any single measure. Extending licensing to Chinese-headquartered firms globally and to their subsidiaries in third countries signals continued tightening, not a one-time shock you can wait out.
For you, that means a market-cap-weighted satellite concentrated in named AI-chip firms is carrying explicit policy risk. That risk tends to materialise as an abrupt price dislocation, not a gradual repricing you can react to calmly.
Concentration, correlation, and valuation risk
There is a subtler trap. If your core holds a broad, tech-heavy index and your satellite is a mega-cap semiconductor fund, you may feel diversified while actually doubling down.
In a regulatory or rate shock, the overlapping mega-cap names in both instruments move together. Correlations rise precisely when you need diversification most, and the diversification benefit you thought you had shrinks.
Thematic overlap is the subtler danger: a portfolio of seemingly separate ETFs can place 30-40% of its total value in the same handful of mega-cap names, which means a market-cap-weighted semiconductor satellite may double rather than diversify the concentration already sitting inside a tech-heavy core index.
Valuation adds another layer. AI-chip designers frequently trade at elevated price-to-earnings multiples, which measure how much investors pay for each dollar of earnings. When growth expectations moderate or rates rise, those rich multiples can compress sharply, amplifying the downside.
Both risks point to the same mitigation. Favour ETFs that spread exposure across the full ecosystem (logic, memory, equipment, and packaging) rather than concentrating in a few named designers, and size your position toward the lower half of your risk band when policy risk is elevated.
Building conviction without building overexposure
You now have the framework, the sizing guidance, the ETF analysis, and the risk picture. Pulled together, a well-constructed semiconductor satellite is not a collection of separate decisions. It is a single coherent position built from a sequence you can follow.
- Establish the core: Anchor 70-90% of your portfolio in a diversified global index fund.
- Size the satellite: Allocate 3-10% to semiconductors for most retail investors (up to around 15% only for experienced investors with high risk tolerance), and choose that number before market conditions bias your judgment.
- Select the ETF: Match the fund to your objective, mega-cap concentration through SMH or broader ecosystem exposure through XSD.
- Set the rebalancing rule in advance: Trim when the position drifts beyond 2-3 percentage points absolute from target, and add gradually into deep cyclical drawdowns when the structural drivers remain intact.
- Monitor the policy environment: Treat export controls and licensing changes as a structural variable, not just a passing headline.
The structural drivers here, AI adoption, cloud build-out, automotive electrification, and edge computing, are multi-decade in nature. But you only capture those returns if you stay in the position through the cyclical drawdowns without panic-selling, and without letting a strong run inflate the position into a dominant portfolio weight.
The framework’s discipline is the asset, not the specific ETF you choose. Pre-committed rules are what stop a good thesis from becoming an oversized risk.
For investors wanting to understand what happens when a high-conviction satellite underperforms for an extended period, our full explainer on thematic ETF sector rotation risk examines how the behaviour gap between reported fund returns and actual investor returns widens precisely when thematic drawdowns are deepest.
Treat this as a repeatable discipline, not a one-time setup. The core-satellite approach works because it forces explicit decisions about conviction, sizing, and risk, rather than letting market performance quietly drift your allocation away from what you originally intended. Plan to hold for at least 5-10 years to let the structural compounding do its work.
This article is for informational purposes only and should not be considered financial advice. Investors should conduct their own research and consult with financial professionals before making investment decisions.
Past performance does not guarantee future results. Financial projections are subject to market conditions and various risk factors, and forward-looking statements about structural growth are speculative and subject to change based on market and policy developments.