Picture a retiree scanning a stock screener who spots a name yielding 7%. The income looks generous, the temptation is obvious, and the purchase feels smart. Months later, the dividend gets cut in half and the share price has slid too. Now there is less income and less capital, all from one number that looked like an opportunity.
That scenario plays out constantly, and it stems from a single mental shortcut: treating yield as the primary filter. Yield is a lagging signal, distorted by price, that tells you almost nothing about whether a company can keep paying you next year.
The cost of that shortcut is measured in dividend cuts, capital losses, and income shortfalls at exactly the moment income matters most. That is why serious income investors evaluate dividend growth stocks across six factors, not one.
This is the repeatable screening checklist you can apply to any dividend stock before you buy. You will finish knowing what to examine, which thresholds to apply, and which warning signs should send you looking elsewhere.
Why yield alone is a trap, not a strategy
Here is the mechanical problem with yield. It is calculated by dividing the annual dividend by the current share price, so when a share price collapses on bad news, the yield shoots up even though the company is in worse shape than before. A screener sorted by highest yield is often a screener sorted by deepest trouble.
That is why a yield at or above 6% should read as a warning light, not a bargain. The evidence backs this up hard: research based on S&P 500 dividend data from 1930 to 2025 found that stocks in the very highest yield quintile have historically underperformed those in the second-highest quintile. The extra yield came with worse outcomes, not better ones.
The mREIT case that best illustrates the dividend yield trap carried an advertised yield of 18.55% while paying out 155% of earnings, eroding its own asset base to fund distributions until cumulative cuts of 37.5% made the yield figure meaningless.
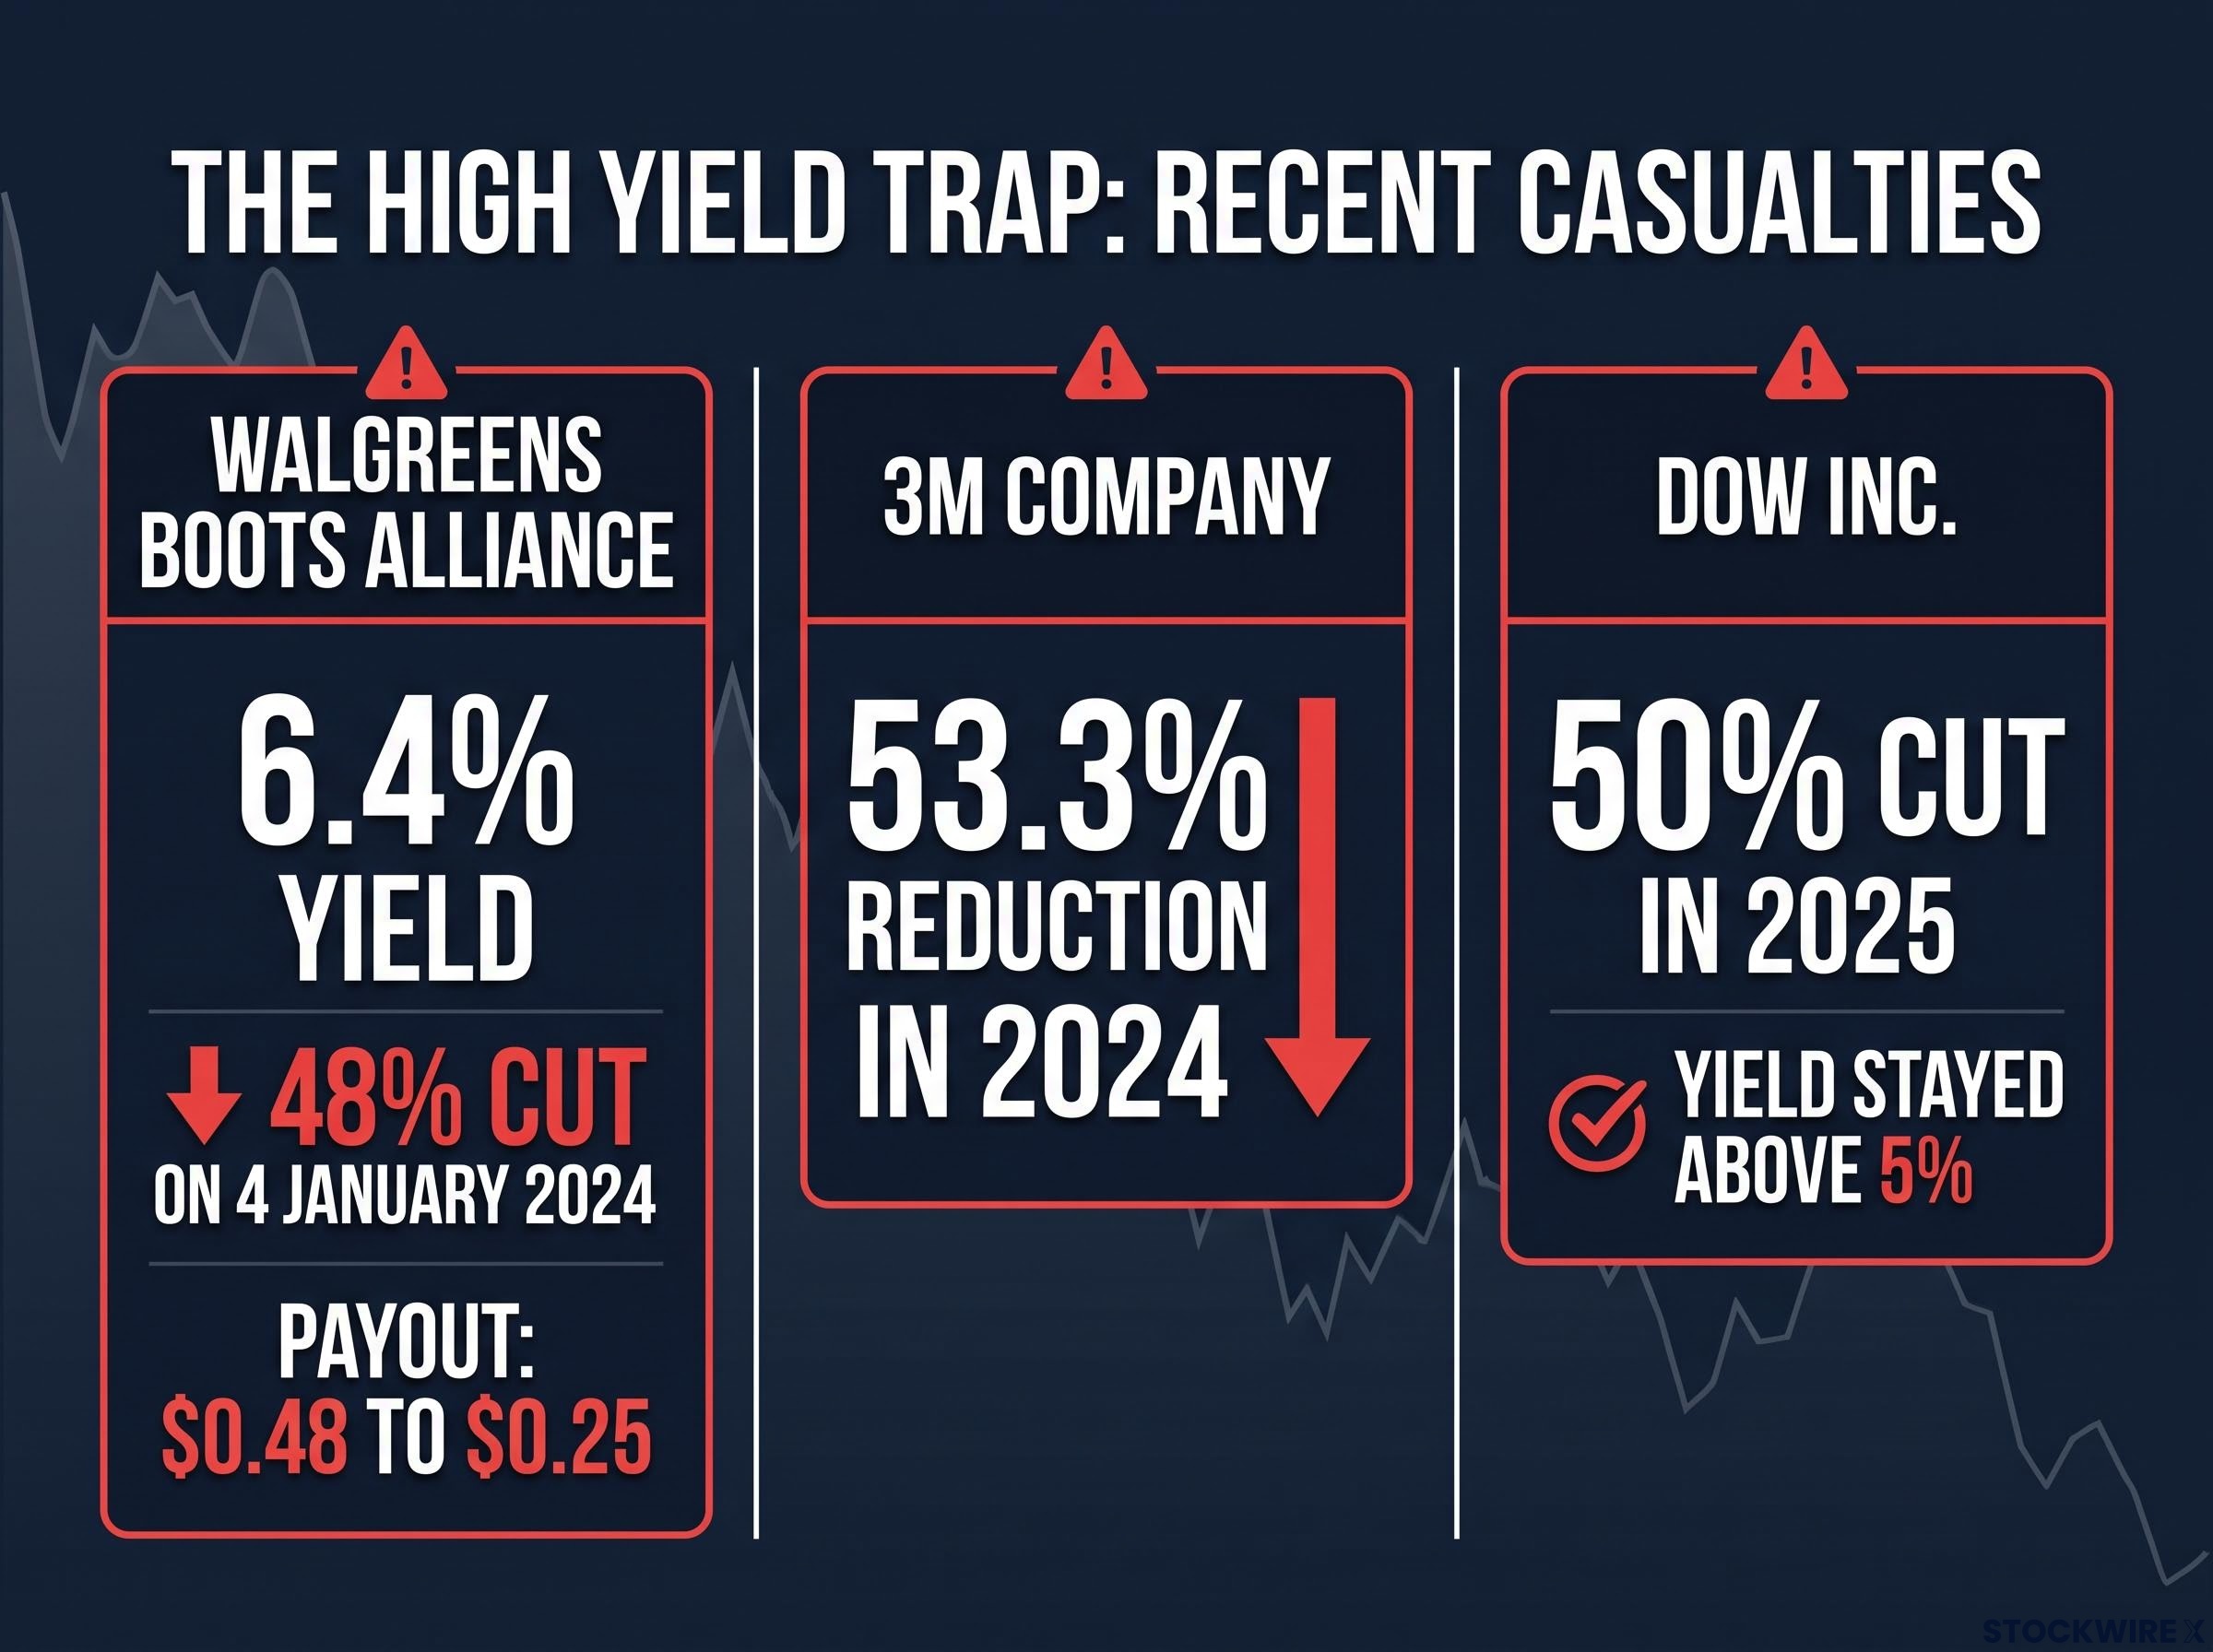
Walgreens Boots Alliance is the case that should unsettle anyone who has ever bought on yield alone. It reached status as the highest-yielding stock in the Dow, carrying a yield around 6.4%, right before it cut its dividend by 48% on 4 January 2024, taking the payout from $0.48 to $0.25 per share. Investors chasing that yield got a payout cut in half and a share price already deteriorating underneath them.
It was not an isolated event. Consider the recent casualties:
- Walgreens Boots Alliance: a 48% cut announced 4 January 2024, while it held the highest yield in the Dow.
- 3M Company: an estimated 53.3% reduction in 2024, amid legal liabilities and restructuring.
- Dow Inc.: a cut of roughly 50% in 2025, with the stock price staying depressed enough to keep the yield above 5% even after the reduction.
The pattern Morningstar warns about: Targeting the highest available yields pushes investors into troubled sectors where the underlying business models are already under pressure. The high number on the screen is frequently the symptom of a company in distress, not a company being generous.
The read you should take is blunt. A high yield on a screener is more often a distress signal than an income opportunity, and acting on it without deeper analysis is precisely how investors end up with less income and less capital at the same time. Everything that follows exists because yield cannot be trusted on its own.
When big ASX news breaks, our subscribers know first
The quality anchors: track record and company size
Before you look at a single financial metric, two filters eliminate most of the dangerous candidates: track record and size. These are not soft preferences. They are hard structural screens with specific numbers attached.
The most important signal is consecutive dividend increases, and the word “increases” matters. A company that has merely paid a dividend for decades tells you far less than one that has raised it every single year. The minimum threshold for top-tier consideration is 25 consecutive years of increases. Companies that reach 50 consecutive years earn the title of Dividend King, and depending on the source and inclusion rules, roughly 52 to 59 U.S.-listed companies currently qualify.
The S&P 500 Dividend Aristocrats criteria set by S&P Dow Jones Indices formally require 25 consecutive years of dividend increases as the qualifying threshold, giving the institutional definition behind what many screeners loosely label a long-streak dividend stock.
What decades of discipline looks like: In a referenced 30-stock dividend growth portfolio, the average holding has raised its dividend for 48 straight years.
That 48-year average tells you something a yield screen never could. The companies worth holding through a full economic cycle are not selected by how much they pay today. They are selected by a documented, decades-long institutional commitment to growing your income.
What the streak actually signals about management behaviour
A long streak is not just backward-looking data. It reflects active management prioritisation and creates accountability pressure that shorter-streaked companies simply do not feel. A firm that has protected a 40-year record treats any threat to it as an existential governance question, because breaking the streak sends a signal to the entire market.
One practical caution. Spin-offs and restructurings can reset or complicate streak counts, so verify the methodology behind any dividend list you consult before trusting the number.
Why size matters beyond brand recognition
The second anchor is company size, and it connects to dividend reliability through structural advantages that scale provides. In a top-tier dividend growth portfolio, the average holding carries a market capitalisation near $190 billion. Large firms can sustain dividends through earnings downturns that would force a smaller competitor to cut, largely because of four advantages:
- Operating leverage: fixed costs spread across higher revenue, which widens profit margins as the business grows.
- Market positioning: stronger negotiating power with suppliers, and a leadership position that is genuinely hard for rivals to displace.
- Financing access: more favourable borrowing terms and greater institutional trust, which matters most when cash is tight.
- Resource allocation: the capacity to fund R&D, attract top talent, and acquire or neutralise emerging competitive threats.
Together, track record and size act as your quality gate. They screen out the vast majority of dividend payers before you analyse a single ratio, which spares you the low-quality names that would sail through a simple yield filter.
Reading yield and payout ratio together, not separately
Yield only becomes readable when you pair it with payout ratio. The payout ratio is the share of net earnings a company hands out as dividends. If a company earns $10 million and pays $5 million in dividends, its payout ratio is 50%. That single figure tells you how much room the company has left to keep raising the payout.
Now the point that trips up most retail investors. A 4% yield with a 45% payout ratio and a 2% yield with an 80% payout ratio are not the same income proposition, even though the first looks obviously better. The first company is distributing less than half its earnings and has plenty of headroom. The second is stretched, with little cushion if profits dip. Surface yield hides all of this.
For context on where to aim, a practical yield range sits between roughly 1.5% and 5-6%. Below 1.5%, income accumulates too slowly to matter; above 6%, you are usually looking at distress rather than value. As an illustration, McDonald’s shares at $267 with the prior four quarters of annualised dividends produce a yield near 2.82%, which sits comfortably in the workable range.
The free cash flow payout ratio is a more reliable sustainability measure than the earnings-based version, because accounting figures can be distorted by non-cash charges and one-time items that leave the dividend looking safer than the underlying cash generation actually supports.
The benchmark that reframes everything: The S&P 500’s aggregate yield currently sits near 1.0% to 1.05%, well below its historical norm. Against that backdrop, even a 2-3% yield from a quality company represents meaningful relative income.
The critical mistake is applying one payout threshold across every sector. A utility and an industrial with identical 70% payout ratios carry very different risks, because their cash flows behave nothing alike. Here is how the acceptable ranges shift by industry:
| Sector | Payout Ratio Range | Key Metric to Watch | Why the Threshold Differs |
|---|---|---|---|
| General / Diversified | 50-60% | Net earnings payout | Balances income distribution against earnings retained for reinvestment. |
| Utilities | 65-75% | Free-cash-flow coverage | Regulated, predictable cash flows support higher payouts; above 75% can signal reliance on external financing. |
| Cyclicals (energy, materials, industrials) | 30-60% | Earnings volatility | Volatile earnings cycles demand a larger safety margin against downturns. |
| REITs | Below ~85% AFFO | AFFO payout, not earnings payout | Legally required to distribute 90%+ of taxable income, so earnings payout is useless; analysts use AFFO instead. |
The read for you is straightforward. A utility at 70% is doing what utilities do, but an industrial at 70% is running close to the edge, and treating those as equivalent risks is how investors get blindsided by cuts when a cyclical downturn arrives. Yield and payout ratio together give you a two-variable check that closes off both the yield trap and the one-size-fits-all payout mistake, the two most common analytical errors in retail dividend investing.
The forward-looking pair: dividend growth rate and international revenue
The last two factors change the question entirely. Instead of asking what you are paid today, they ask what you will be paid in ten or fifteen years.
Dividend growth rate is the compounding engine of an income portfolio. A stock yielding 2% today but growing its dividend at a healthy clip will, over a 10-15 year holding period, often pay you far more annual income than a static 5% yield that never moves. The high yield feels better on day one. The growing yield wins the decade. A low starting yield is not a weakness if the dividend behind it is climbing every year.
The second factor is international revenue exposure, and it is best understood as an income-stability factor rather than a growth play. A company earning all its money in one country is fully exposed to that country’s economic cycle. Broad international revenue acts as a natural hedge against a U.S.-specific downturn and against overconcentration in a single currency, particularly since sustained dollar strength is never guaranteed.
Specifically, international exposure mitigates:
- Single-country recession risk: a domestic slump hits every revenue stream at once when all income comes from home.
- U.S. dollar concentration: earning in multiple currencies cushions the impact of dollar swings.
- Jurisdictional regulatory and tax changes: a single-country tax or rule change can strike the entire business.
- Demand concentration: reliance on one consumer market amplifies any shift in that market’s spending.
For benchmarks, the referenced model dividend growth portfolio derives about 38% of its aggregate revenue from outside the United States. The S&P 500 as a whole earns somewhere in the range of 28% to 42% abroad, depending on the methodology and the source, so treat that span as the realistic reality rather than any single headline figure.
International revenue diversification carries a yield dimension that purely domestic investors often miss: STOXX Europe 600 companies are projected to distribute approximately 454 billion euros in dividends in 2026, with yields commonly above 3%, giving quality-screened dividend investors a broader opportunity set than U.S. listings alone provide.
The disproportion worth remembering: The United States accounts for roughly 26% of global GDP but only around 4% of the world’s population. The economic opportunity sitting outside U.S. borders is far larger than a domestic-only revenue base can capture.
The read here is direct. A company earning 60-70% of its income from a single country is structurally more fragile as an income vehicle than one with broad international reach, no matter how stable its home operations look right now. These two factors answer what yield cannot: not just what the dividend is today, but whether the business is built to keep growing it through the cycles you will actually live through.
Putting the six factors together as a repeatable screen
Here is the whole framework in one place, ready to run this week.
| Factor | Minimum Threshold | Warning Signal | What It Tests |
|---|---|---|---|
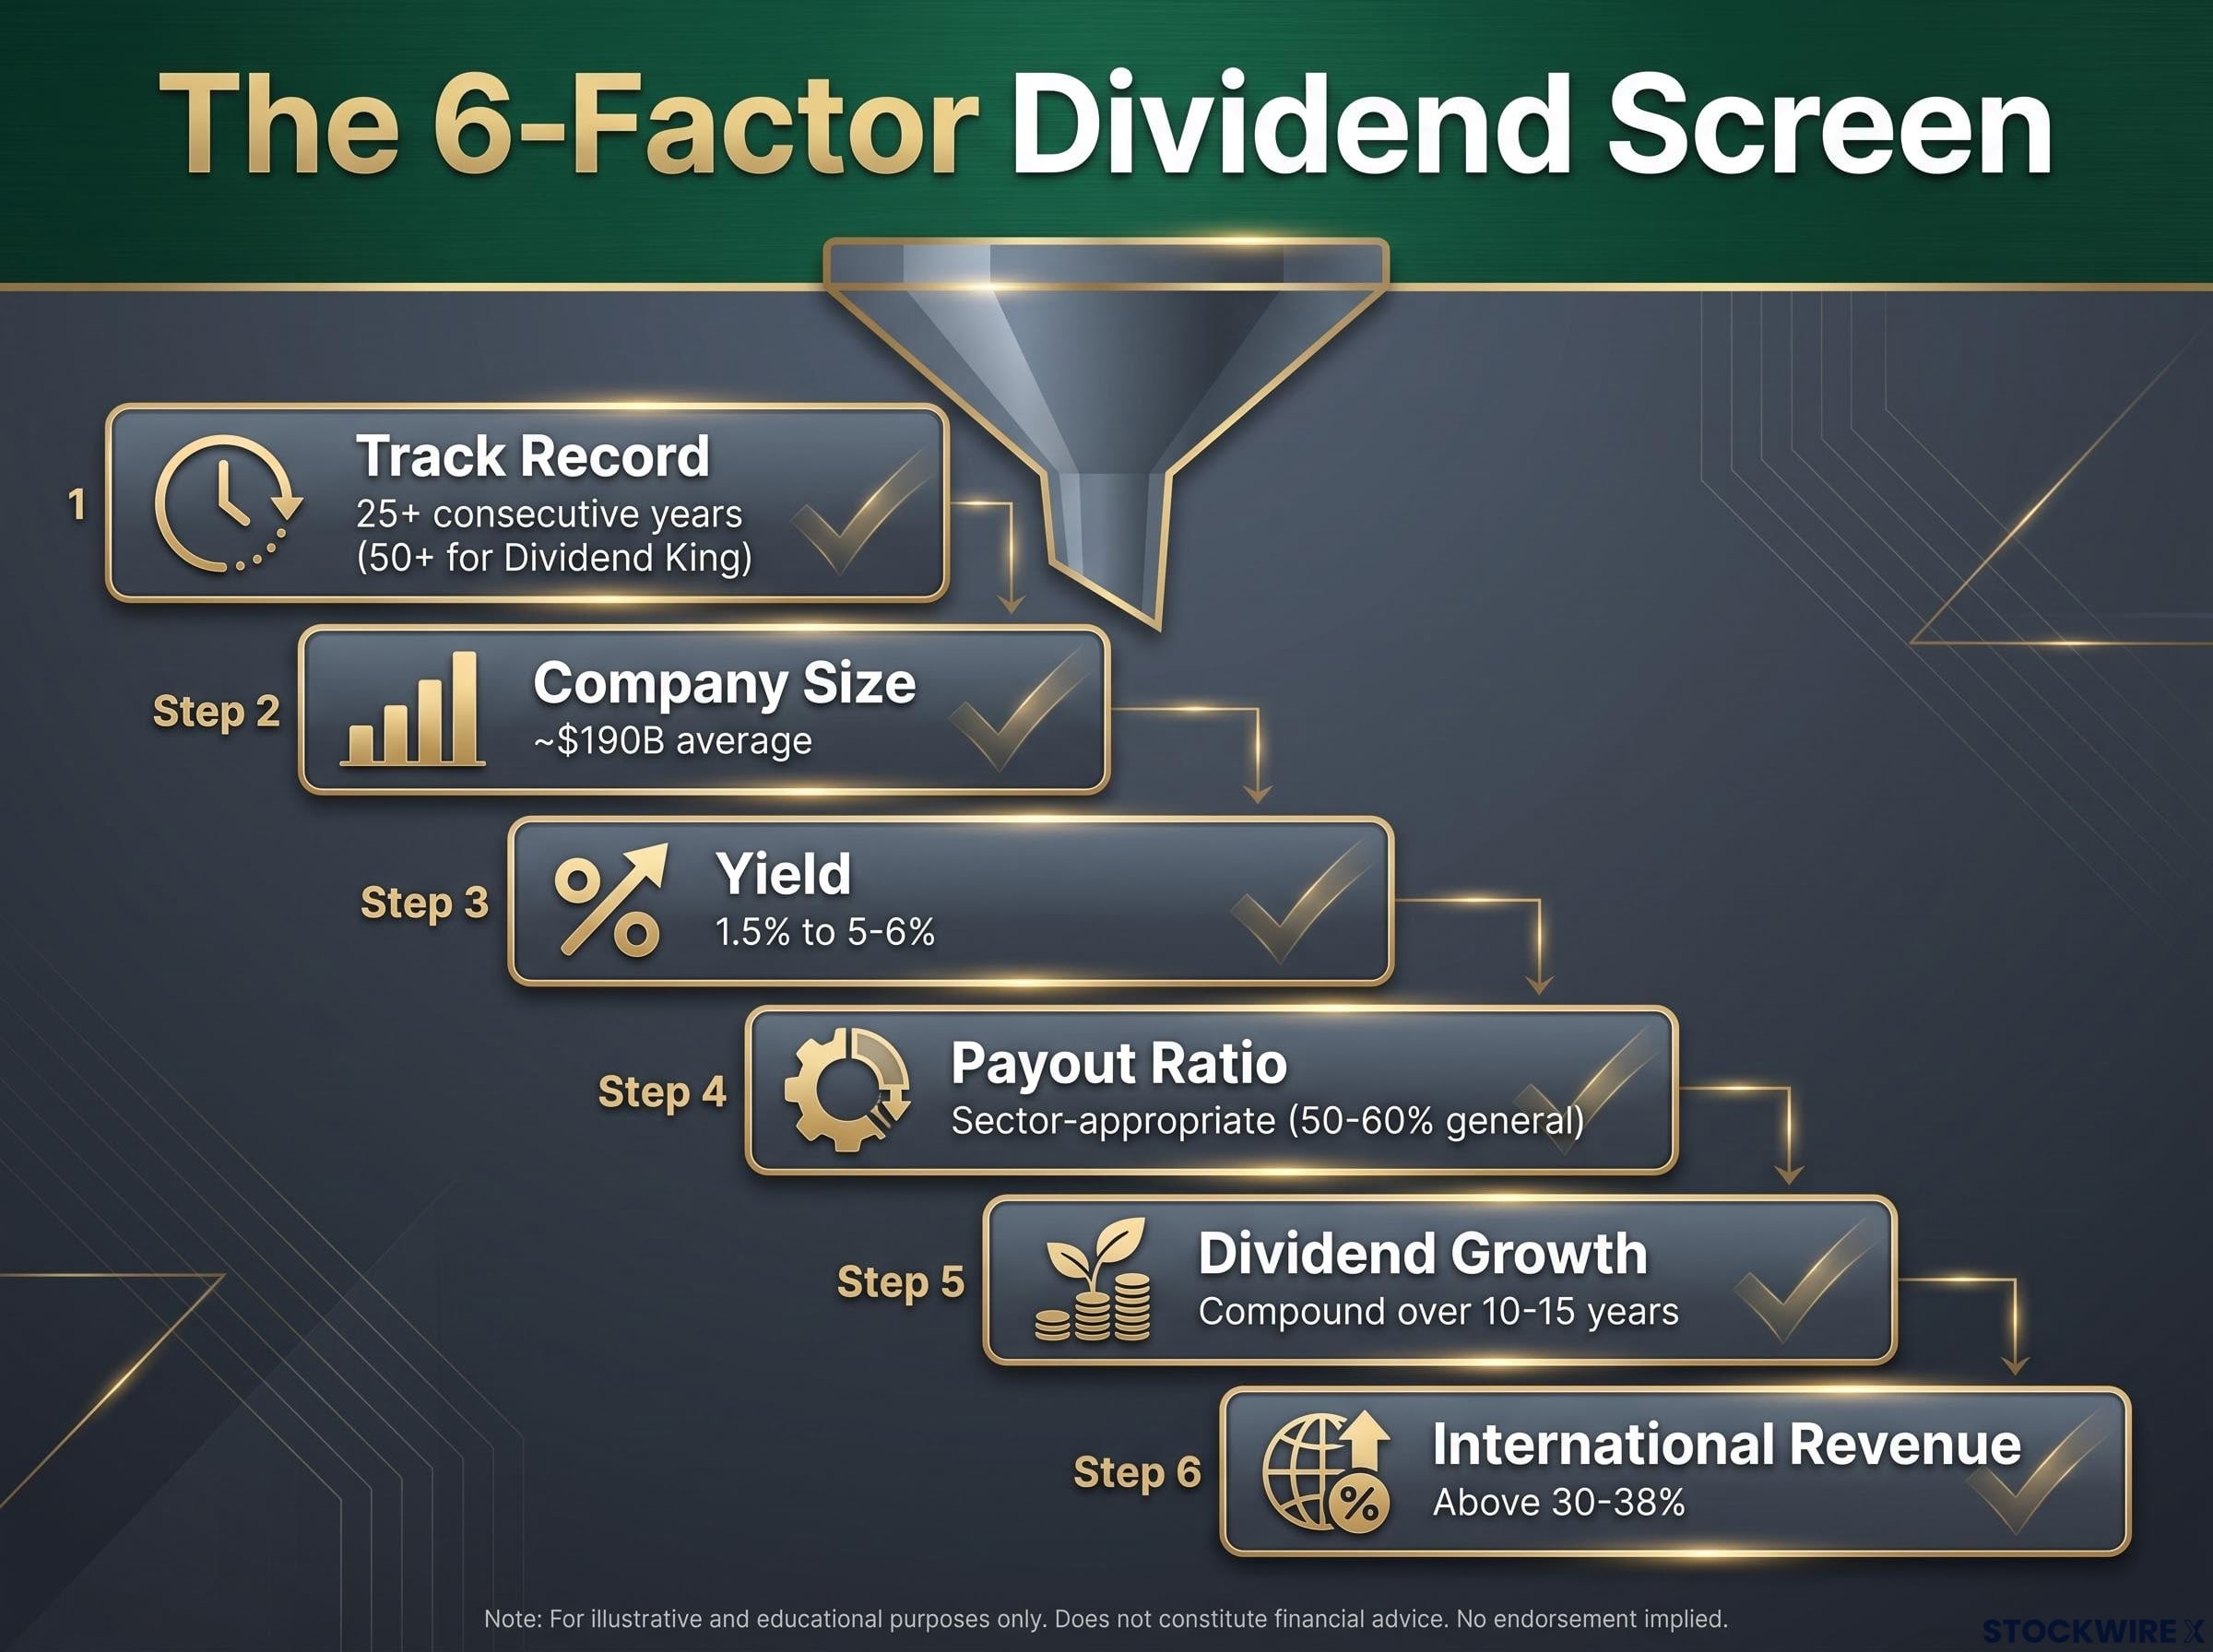
| Track record | 25+ consecutive years of increases (50+ for Dividend King tier) | Streak reset by spin-off or a paused increase | Management commitment through full cycles |
| Company size | Large-cap; ~$190B average in top-tier portfolios | Small-cap without financing depth | Ability to sustain payouts through downturns |
| Yield | Between 1.5% and 5-6% | Above 6% | Income relevance without distress |
| Payout ratio | Sector-appropriate (50-60% general, 65-75% utilities, 30-60% cyclicals, below 85% AFFO for REITs) | Above sector ceiling | Headroom to keep raising the dividend |
| Dividend growth rate | Enough to compound meaningfully over 10-15 years | Flat or stalling growth | Future income, not just current income |
| International revenue | Ideally above 30-38% of total revenue | Near-total single-country reliance | Income stability across geographies |
Run these in sequence. Start with track record and size as your quality gate, which clears out the weakest candidates immediately. Then apply the yield range and payout ratio as your sustainability check. Finally, assess dividend growth rate and international exposure as your forward-looking test. A stock that clears all three stages is a genuinely different proposition from one that merely posts a high yield.
Now the honest caveats, because this strategy has real structural limits:
- Sector underweighting: dividend growth indexes tend to under-allocate to faster-growing sectors like technology, and have occasionally lagged the broad U.S. market across multiple trailing horizons as a result.
- The buyback blind spot: for several consecutive years, corporate share buybacks have exceeded aggregate dividend payouts, meaning an income-only focus misses a significant slice of the cash companies are returning to shareholders.
- Interest rate sensitivity: rising rates create yield competition from bonds and term deposits, pressuring dividend stock valuations regardless of how sound the underlying dividend is.
What that buyback point tells you is important. Dividend growth investing is a specific income strategy with genuine limitations, not a shortcut to owning the best businesses on the market. It works best when your primary goal is growing income rather than maximising total return.
Even so, there is a strong counter-perspective in the evidence. Historically, dividend growth companies have produced better returns per unit of risk than high-yield counterparts during periods of rising Treasury yields. That validates the approach as a risk-adjusted strategy, a disciplined way to grow income while managing downside, rather than a raw total-return maximiser.
Applying the framework with realistic expectations
The six-factor screen is a filter, not a guarantee. Even a company that clears all six can cut its dividend in a severe economic dislocation, which is exactly why serious dividend growth portfolios spread capital across 20-30 stocks rather than concentrating conviction in a handful. The framework is at its most powerful as a portfolio-level discipline, and building those positions steadily over time is how the strategy actually delivers on its income promise.
For investors ready to move from screening individual stocks to constructing a full income portfolio, our dedicated guide to building a dividend portfolio covers how payout ratio analysis and systematic dividend reinvestment work together to compound income across 20-30 year horizons.
The core shift the whole framework asks of you is simple to state. Move yield from your primary lens to just one of six inputs, and let track record and payout sustainability do the heavy lifting. With the S&P 500’s aggregate yield sitting near 1.0% to 1.05%, the market as a whole barely offers income, which makes systematic screening for quality dividend growers a genuinely differentiated approach rather than a redundant one.
Three concrete first steps translate this into action:
- Identify a candidate using a dividend screener, filtering for a long history of increases rather than the highest yield.
- Verify the consecutive increase streak, confirming it against the list methodology to catch any spin-off resets.
- Check the payout ratio against the sector-appropriate threshold, not a single universal number.
This article is for informational purposes only and should not be considered financial advice. Investors should conduct their own research and consult with financial professionals before making investment decisions. Past performance does not guarantee future results, and financial projections are subject to market conditions and various risk factors.