Two institutional Nvidia call blocks worth roughly $8 million in combined premium hit the tape on 2 September 2026, the same session Dell reported record AI-server orders. One block spent about $4.39 million on 11 September calls at the $225 strike. The other spent about $3.76 million on 2 October calls at the $230 strike.
Nvidia closed at $224.41 that day, up from $217.44 the prior session, and inside touching distance of its post-earnings reaction high of $227.98. Both trades landed in the quiet window between Nvidia’s last earnings report and its next catalyst, a stretch where implied volatility tends to compress and options become comparatively cheap to buy.
Here is what the flow data actually tells you about the bet: what these traders did, why Dell’s numbers turned Nvidia into the trade, and what the specific mechanics reveal about whether this is conviction or noise.
Two call blocks, one thesis: what the tape showed on 2 September
The first block was a sprint. Someone bought $225 strike calls expiring 11 September, just nine days out, roughly 1% out of the money at entry, paying approximately $4.39 million in premium at 31% implied volatility. Of that volume, 83% hit the ask.
The second block bought time. $230 strike calls expiring 2 October, thirty days out, about 3% out of the money at entry, for approximately $3.76 million. Implied volatility started at 31% and climbed to 37% on the day, a 57% intraday jump. Ask-side volume ran even higher here, at 88%.
The nine-day position carries roughly a coin-flip chance of profit, near 50%. The thirty-day position sits closer to two-in-five. That gap is the point: the short-dated calls need Nvidia to move now, before 11 September, or they bleed out. The longer-dated calls have room to absorb Federal Reserve decisions, employment data, and inflation prints before 2 October without a single bad session ending the trade.
| Parameter | Trade 1 (Sep 11 calls) | Trade 2 (Oct 2 calls) |
|---|---|---|
| Strike | $225 | $230 |
| Expiration | 11 September 2026 (9 days) | 2 October 2026 (30 days) |
| Premium paid | ~$4.39 million | ~$3.76 million |
| Moneyness at entry | ~1% out of the money | ~3% out of the money |
| IV at execution | 31% | 31%, rising to 37% |
| Ask-side volume | 83% | 88% |
| Probability of profit | ~50% | ~two in five |
The ask-side figures do the interpretive work here. When 83% and 88% of volume hits the ask, these buyers were not waiting for a better price. That is the clearest available signal that both positions reflect directional conviction, not hedging or portfolio neutralisation. This flow, observed on Tasty Live’s Signal Versus Noise program, is what a bullish bet looks like when the buyer wants in badly enough to pay up.
The stronger signal On the October calls, 88% of volume hit the ask. Aggressive buying at that level tells you the trade was about getting exposure, not chasing a good fill.
When big ASX news breaks, our subscribers know first
Why Dell’s AI blowout made Nvidia the trade
Start with the wiring. Dell’s AI-optimised servers are built around Nvidia processors, so Dell’s order book is a leading indicator for upstream chip demand. When Dell sells more AI servers, Nvidia sells more of the accelerators inside them.
Now the numbers. Dell’s fiscal Q2 2027 delivered $60.9 billion in AI-server orders during the quarter and $16.4 billion in AI-server revenue, up roughly 100% year over year. The backlog reached $95 billion, nearly doubling from $51.3 billion at the end of fiscal Q1 2027. Dell management described the pipeline behind that backlog as “multiples of backlog.”
- Total quarterly revenue: $47 billion, up 58% year over year, a record
- Adjusted EPS: up over 200% year over year
- Full-year revenue guidance raised to approximately $192 billion, from around $167 billion
- AI-server revenue guidance raised to approximately $74 billion, from around $60 billion
- AI server orders in the quarter: $60.9 billion
- Backlog: $95 billion, up from $51.3 billion a quarter earlier
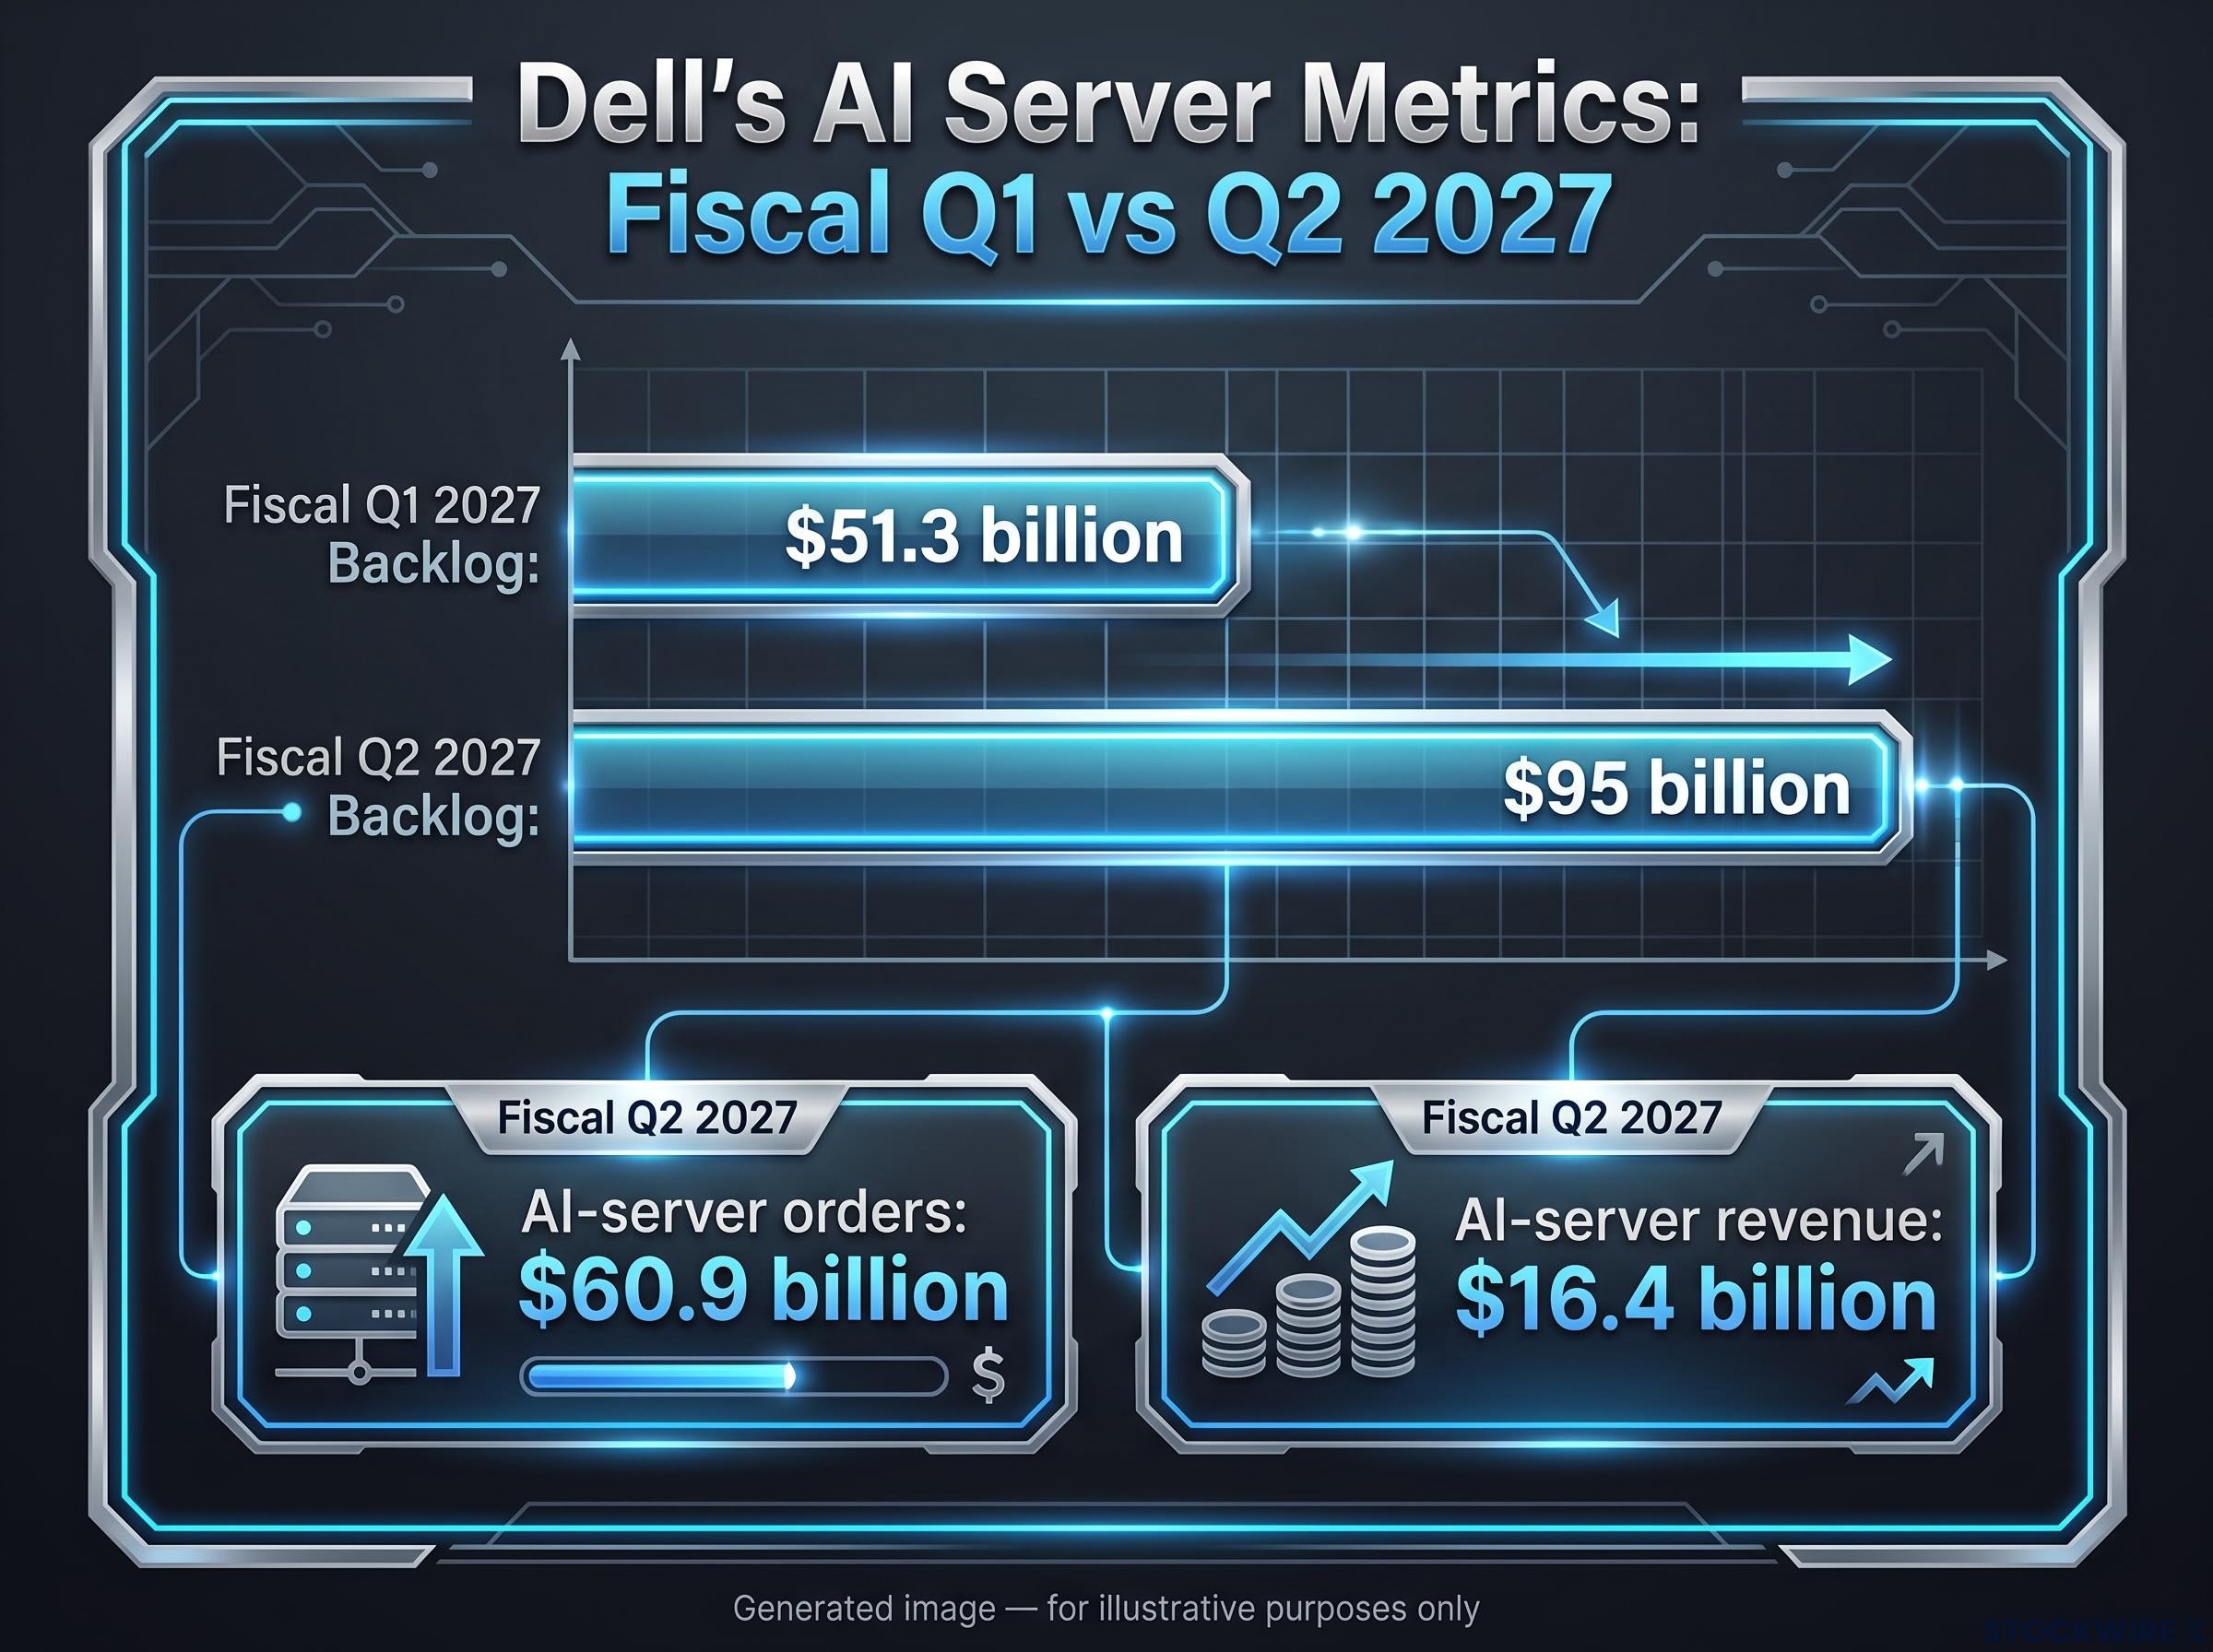
So why did options traders act on Dell’s report rather than wait for Nvidia’s own? Because the backlog gives forward visibility that a single earnings date cannot. Nvidia’s own Q3 guidance of roughly $108 billion, plus or minus 2%, already sits above consensus estimates of about $104.19 billion per LSEG data and $105.39 billion per Visible Alpha. Dell’s backlog tells traders the demand behind that guidance is committed, not hoped for.
The $95 billion backlog as a forward demand signal
Backlog is not revenue. It represents orders customers have committed to but Dell has not yet fulfilled and recognised. That distinction is exactly why it matters: a $95 billion backlog nearly doubling in a single quarter tells you customers have already locked in capital for AI infrastructure at a scale that carries multi-quarter GPU demand upstream.
That durability is what justifies a thirty-day call position rather than a pure earnings-day gamble. A pipeline described as “multiples of backlog” compounds the signal further.
There is a named limitation, though, according to analysis from Futurum Group and Zacks. Dell’s servers use components from multiple vendors, so a large backlog does not guarantee Nvidia captures the same share of every build. Alternative accelerators remain a live competitive variable, and multi-sourcing means the demand signal is real but not a one-for-one revenue transfer.
Reading the mechanics: what implied volatility and strike selection reveal
Here is the counterintuitive part: 31% implied volatility is low for Nvidia, not high. According to OptiView data from 1 September 2026, Nvidia’s 30-day at-the-money IV carried an IV rank of just 1 out of 100 over the prior year. That places these options at the very bottom of their pricing range for the year.
Implied volatility rank is the metric that gives the IV rank of 1 out of 100 its meaning: it measures where current IV sits relative to the prior year’s range, so a rank of 1 signals the options market is pricing almost no uncertainty premium above its own floor, creating the comparatively cheap entry the 2 September buyers were exploiting.
The IV/HV ratio sat at 0.72, which means options were pricing less movement than the stock had actually delivered recently. The term structure was in contango, with front-month IV below three-month IV, a condition typical of calm markets.
Cheapest entry in a year Nvidia’s implied volatility ranked 1 out of 100 over the prior year at the time of execution, placing these trades at the low end of the historical options-pricing range.
Why does compressed IV matter for a buyer? Because buying calls when volatility is cheap means paying a lower absolute premium than during pre-earnings spikes. For context, Saxo Bank’s February 2026 case study on Nvidia showed pre-earnings short-dated straddles implying roughly plus or minus 8-12% moves, which corresponds to far higher IV than the current 31%. Entering at compressed IV improves the risk-reward on a directional long-premium trade.
That reframes the dollar size of the bet. An IV rank of 1 out of 100 means the $8 million in premium bought more optionality per dollar than the same trade would have in a high-IV environment. These traders were not overpaying for exposure. They were buying it near the cheapest point of the year.
The strikes were not random either. Nvidia’s post-earnings reaction high of $227.98 is the technically relevant level, and the $225 and $230 strikes bracket it directly. But cheap IV cuts both ways, and long-premium buyers carry specific risks:
- IV crush: even a correct directional move can lose money if implied volatility collapses after the catalyst resolves
- Time decay: the nine-day $225 calls convert time value into loss with every session the stock stalls
- Failure to clear the level: if Nvidia does not push through the $227.98 reference before expiration, the strikes never pay
Where the thesis can break down
Treat the counter-arguments as variables the 2 September traders themselves would have weighed, because they are live and unresolved.
Start with valuation extension. Nvidia’s Q3 guidance of roughly $108 billion implies about 70% year-over-year growth. The Kobeissi Letter calculated on 27 August 2026 that meeting that figure would represent approximately 1,730% revenue growth over four years. Critically, the guidance assumes zero data-centre compute revenue from China, meaning a material geopolitical constraint is already baked in, limiting the upside optionality that bulls can price. Raymond James set a Street-high $515 target on the same date, implying roughly 125% upside, which shows how far some valuations have stretched.
The options flow itself is not uniformly bullish, either:
- Valuation and geopolitical ceiling: the $108 billion guidance already assumes no China compute revenue, capping the bull case at a level the market can see
- Options-flow counter-evidence: CNBC’s May 2026 data showed call volume outpacing puts two-to-one, but with more calls traded at the bid or below, implying selling. Seeking Alpha’s 25 August 2026 note showed rising $200-strike put activity alongside the $220-$230 call concentration
- Supply-chain basis risk: Dell’s backlog is a demand signal, not a revenue guarantee. Futurum Group flags rack-scale deployment complexity, and Zacks notes Dell’s AI-server margins remain in the mid-single-digit range, hinting at cost pressure across the stack
Positioning crowding and IV crush as the options-specific risks
The mechanics carry their own hazards. IV crush means a correctly directional move can still produce a loss if implied volatility drops sharply once the catalyst resolves.
Crowding is the second risk. According to Moomoo’s 17 August 2026 commentary, a $240-strike call sweep of over 20,000 contracts, roughly $5.78 million in premium, had been placed weeks earlier. When Nvidia failed to reach $240, positioning repositioned lower to $230 strikes. That repositioning tells you aggressive ask-side call buying has happened before without reaching its target.
Then there is the clock. The 11 September expiration gives the $225 calls nine calendar days to reach strike. Any delay in the move converts time value directly into premium loss.
Nvidia’s post-earnings price behaviour complicates the short-dated thesis: across 17 reports from February 2022 to February 2026, the stock ended the following week lower in seven of the last eight quarters even when results beat estimates, a pattern that makes the nine-day September calls a higher-variance instrument than the underlying fundamental case suggests.
What this flow signals about the AI trade in September 2026
The 2 September blocks are not a one-off. They sit inside a pattern of large Nvidia call positioning through 2026:
- 18 May 2026: four in-the-money call blocks, each at least $10 million in notional value
- 17 August 2026: a $240-strike sweep of over 20,000 contracts, roughly $5.78 million in premium, executed at the ask
- 2 September 2026: the pair of blocks, $4.39 million at the $225 strike and $3.76 million at the $230 strike
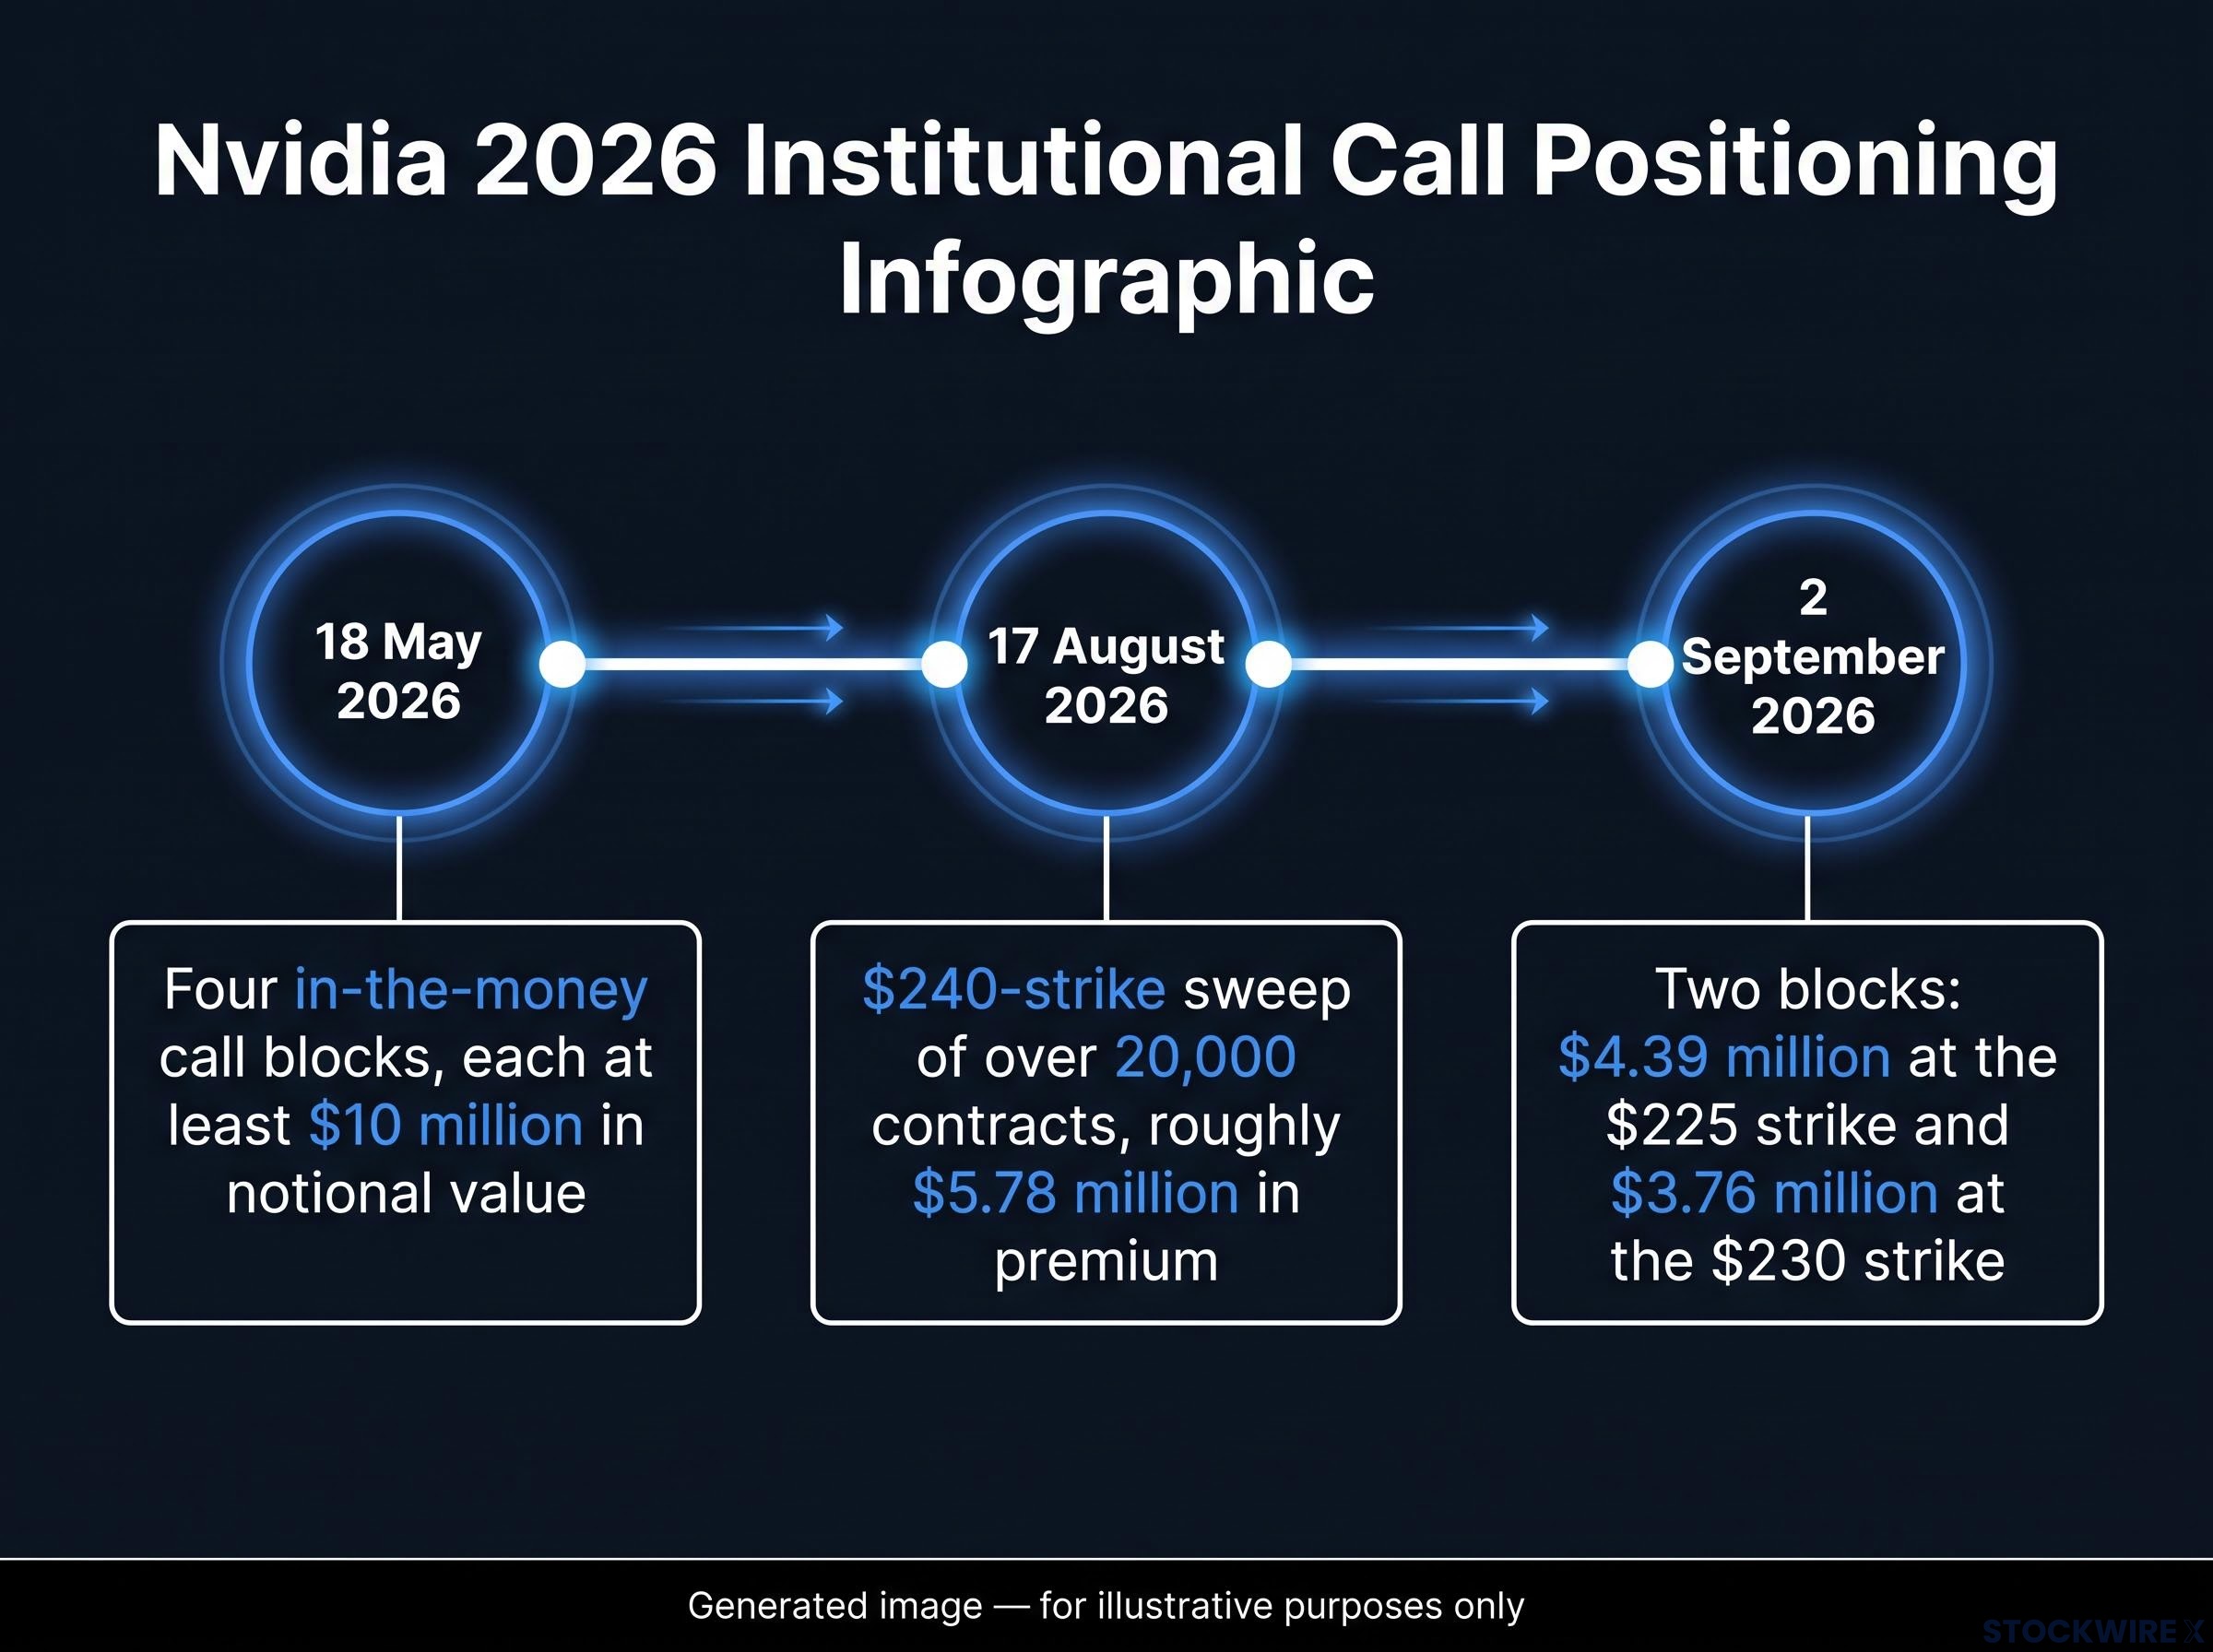
That sequence shows sustained institutional appetite for short-to-medium-dated directional exposure on Nvidia, not an isolated event. It also hands you a repeatable framework: when a major downstream customer like Dell posts a blowout quarter with a record and rising backlog, cross-stock call positioning in Nvidia has recurred as a tactical response. Watch for the same setup at future supplier earnings dates.
For readers wanting to apply the same ask-side volume and skew analysis to other tickers, our full explainer on reading options chain sentiment walks through the five-step framework covering IV rank, skew, expected-move mapping, term-structure comparison, and far-OTM crowding that professionals use to extract directional signals from any chain.
The 2 September blocks extend a pattern that began just days earlier: post-earnings call positioning on 27 August saw traders commit $3.08 million in fresh premium to $230 and $250 strikes within hours of Nvidia’s 8.74% surge, establishing the bullish directional bias that the Dell-catalyst blocks are now reinforcing.
The ceiling the market can see Nvidia’s $108 billion Q3 guidance assumes zero data-centre compute revenue from China. That is the most structurally significant constraint on the bull case, and it is not visible in the headline number.
If you track options flow as a sentiment gauge, the 2 September activity confirms the bull thesis remains institutionally supported at current prices. But the repositioning from $240 down to $230 strikes over the preceding weeks also tells you that support has a ceiling the market has already tested and failed to break. Two variables now decide these specific trades: Nvidia clearing $225 within nine days for the September calls, and holding gains through macro events before 2 October for the longer-dated block. Neither is guaranteed by the strength of the underlying thesis. No analyst upgrades or price-target changes anchored directly to the 2 September options activity were available at the time of writing.
This article is for informational purposes only and should not be considered financial advice. Investors should conduct their own research and consult with financial professionals before making investment decisions. Past performance does not guarantee future results. Financial projections are subject to market conditions and various risk factors. These statements are speculative and subject to change based on market developments and company performance.