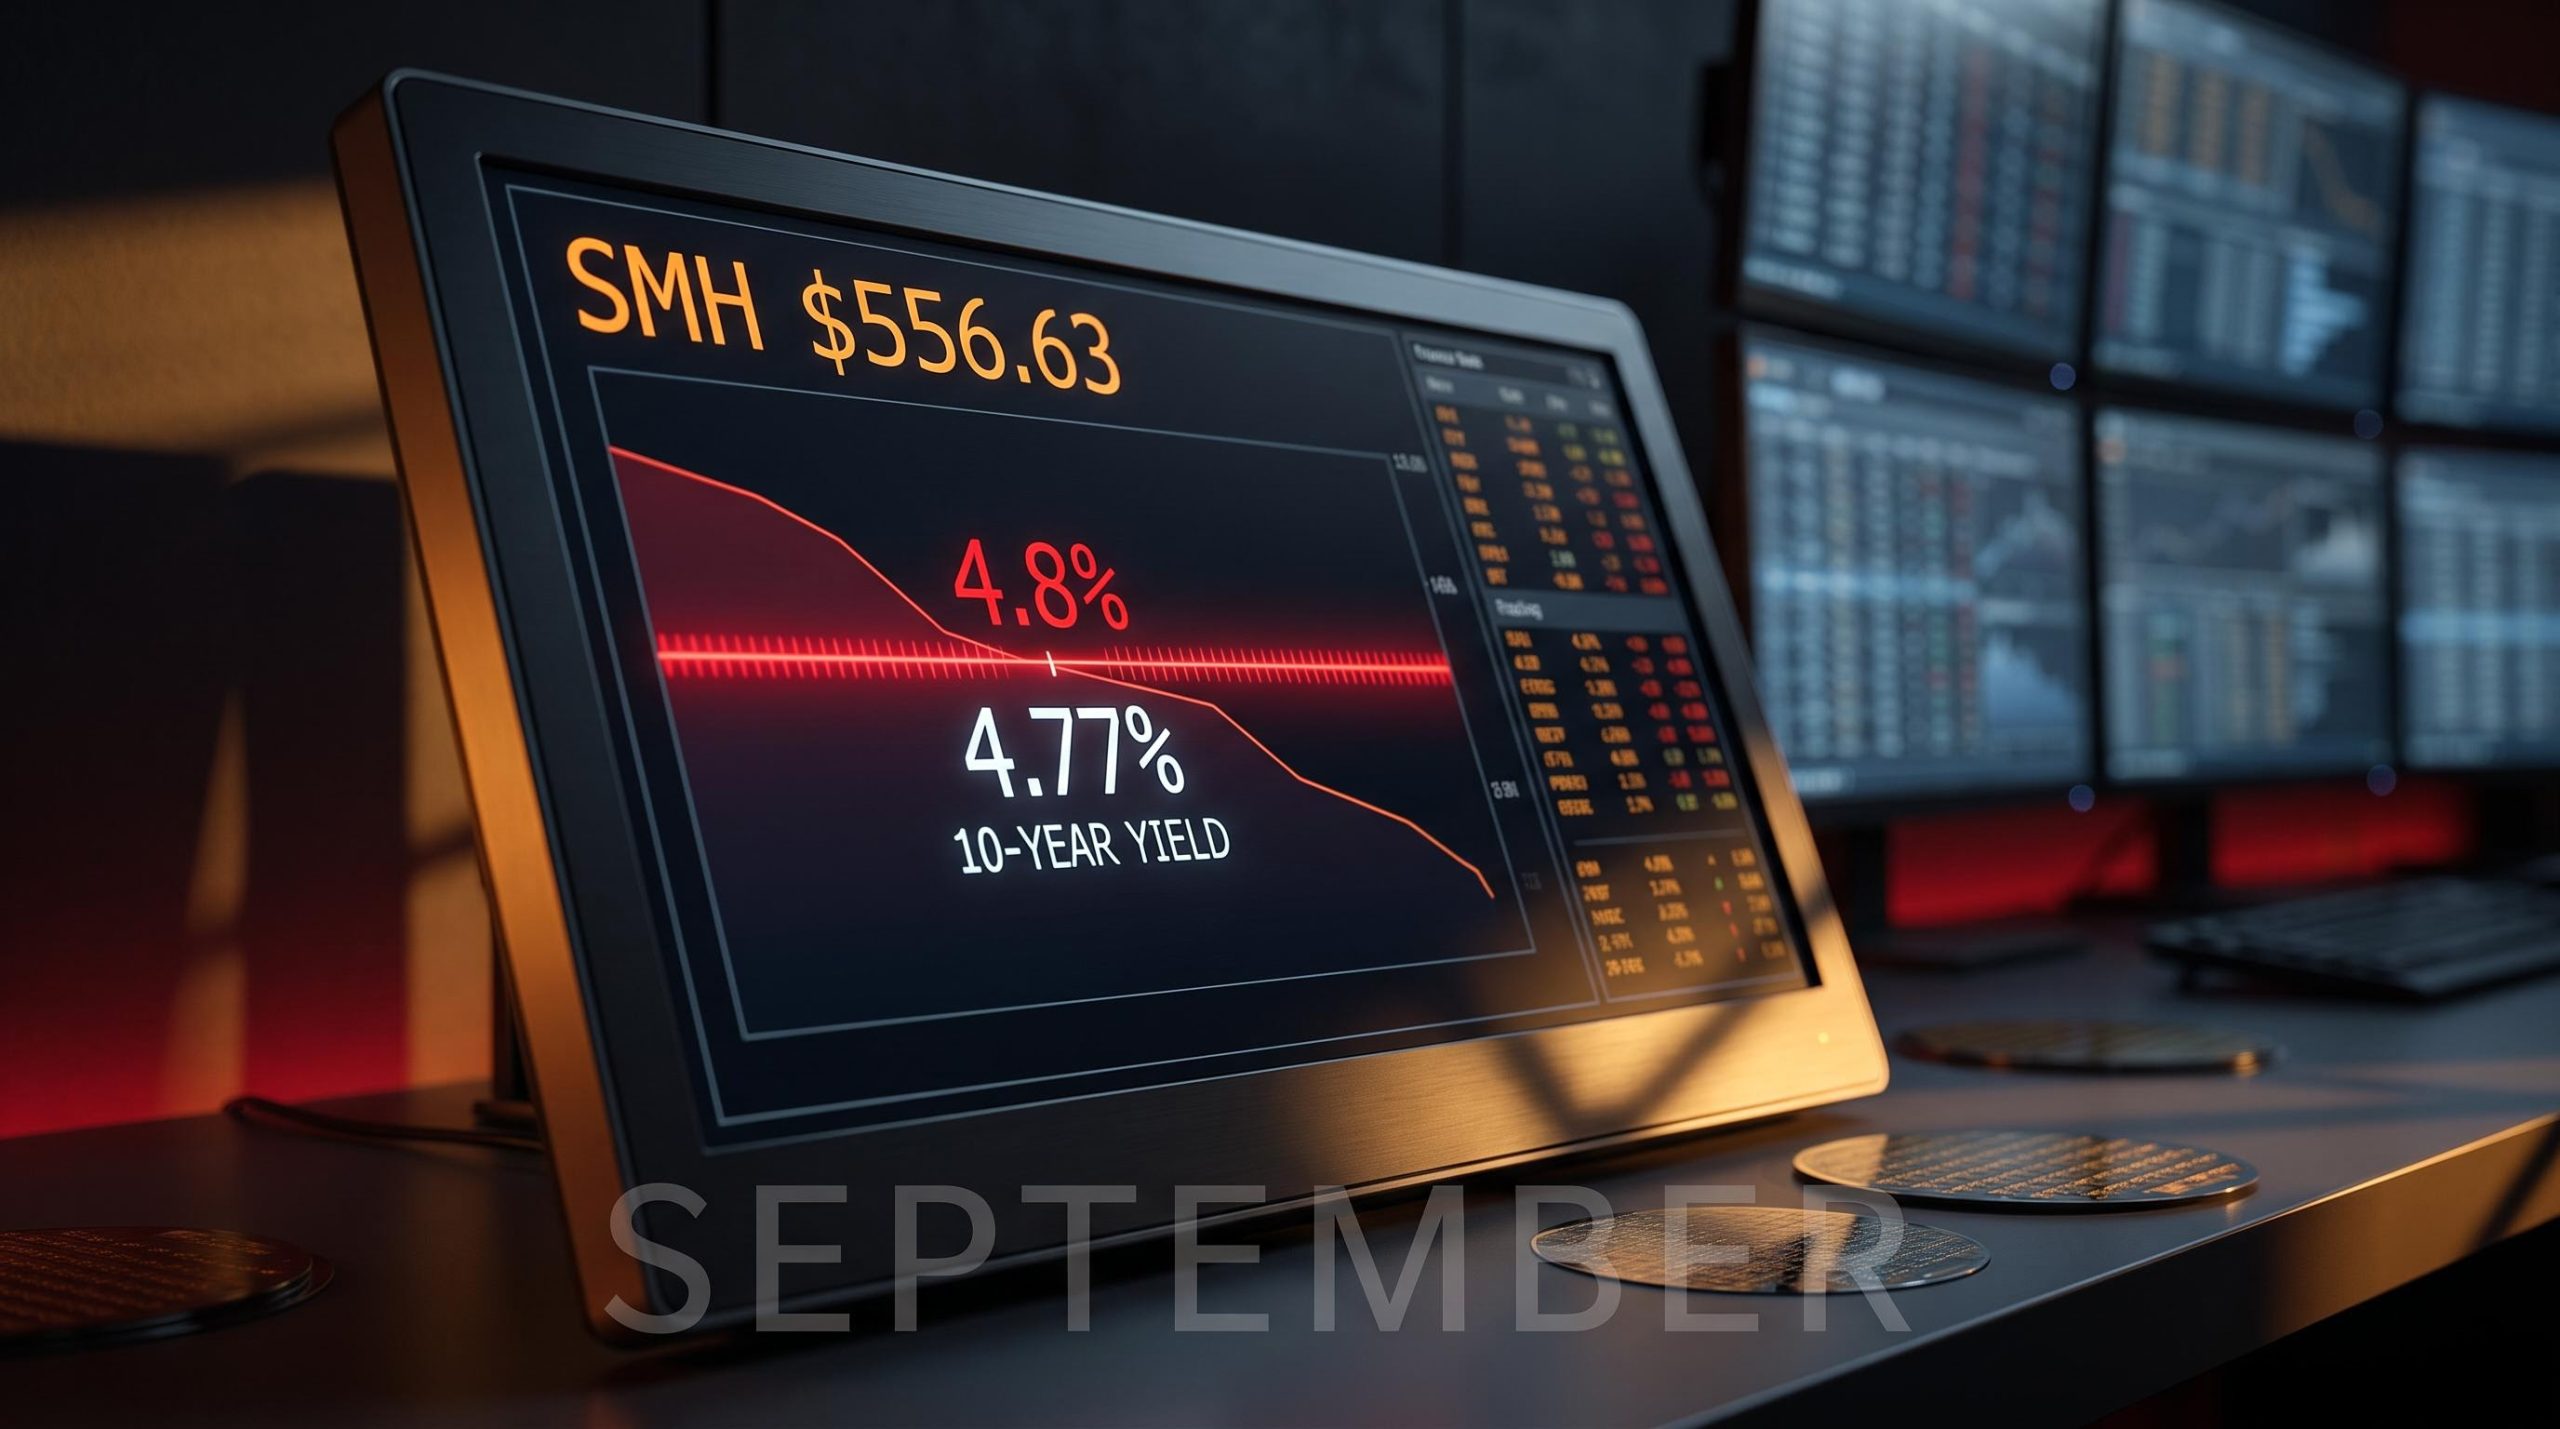
The 10-year Treasury yield sits at 4.77% as September opens. The VanEck Semiconductor ETF (SMH) closed at $556.63. And at least one practitioner is already short the sector, watching 4.8% as the line that breaks the whole thesis open.
Those three numbers are colliding at a specific moment for a reason. Semiconductors trade on long-dated AI earnings expectations, exactly the kind of valuation structure that a rising discount rate environment mechanically punishes. Layer on September, the calendar month with the worst long-run equity return record, and the risks stop being independent. They start amplifying one another.
Here is what the data tells you about the risk profile entering September, and the one number to watch as the tension resolves.
What the 4.8% yield threshold actually means for chip stock valuations
Start with the mechanism, because it explains why chip stocks can drop hard even when demand for AI chips has never looked stronger.
A stock is worth the sum of its future cash flows, adjusted back to what those cash flows are worth today. That adjustment uses a discount rate, and Treasury yields are the anchor for that rate. When yields rise, the discount rate rises with them, and the present value of earnings expected years into the future shrinks.
The FRED 10-year Treasury yield series tracks the daily constant maturity rate published by the Federal Reserve, providing the benchmark data that underpins every discount rate calculation analysts apply to long-duration equity valuations.
That shrinkage is not evenly distributed. It falls hardest on high-multiple, long-duration growth names, the companies whose valuation depends on profits arriving well beyond the current year.
That shrinkage is not evenly distributed across the market because equity duration varies enormously by stock type, with long-duration growth names carrying far more sensitivity to rate moves than mature cash-generating industrials, a dynamic Morgan Stanley estimates produces 3-4 turns of multiple compression per 100 basis points of real yield increase.
Semiconductors are among the most yield-sensitive equities in the market for precisely this reason. A large share of their valuation rests on AI-driven profits projected far into the future, so a higher discount rate compresses their present value more sharply than it does a mature, cash-generating industrial.
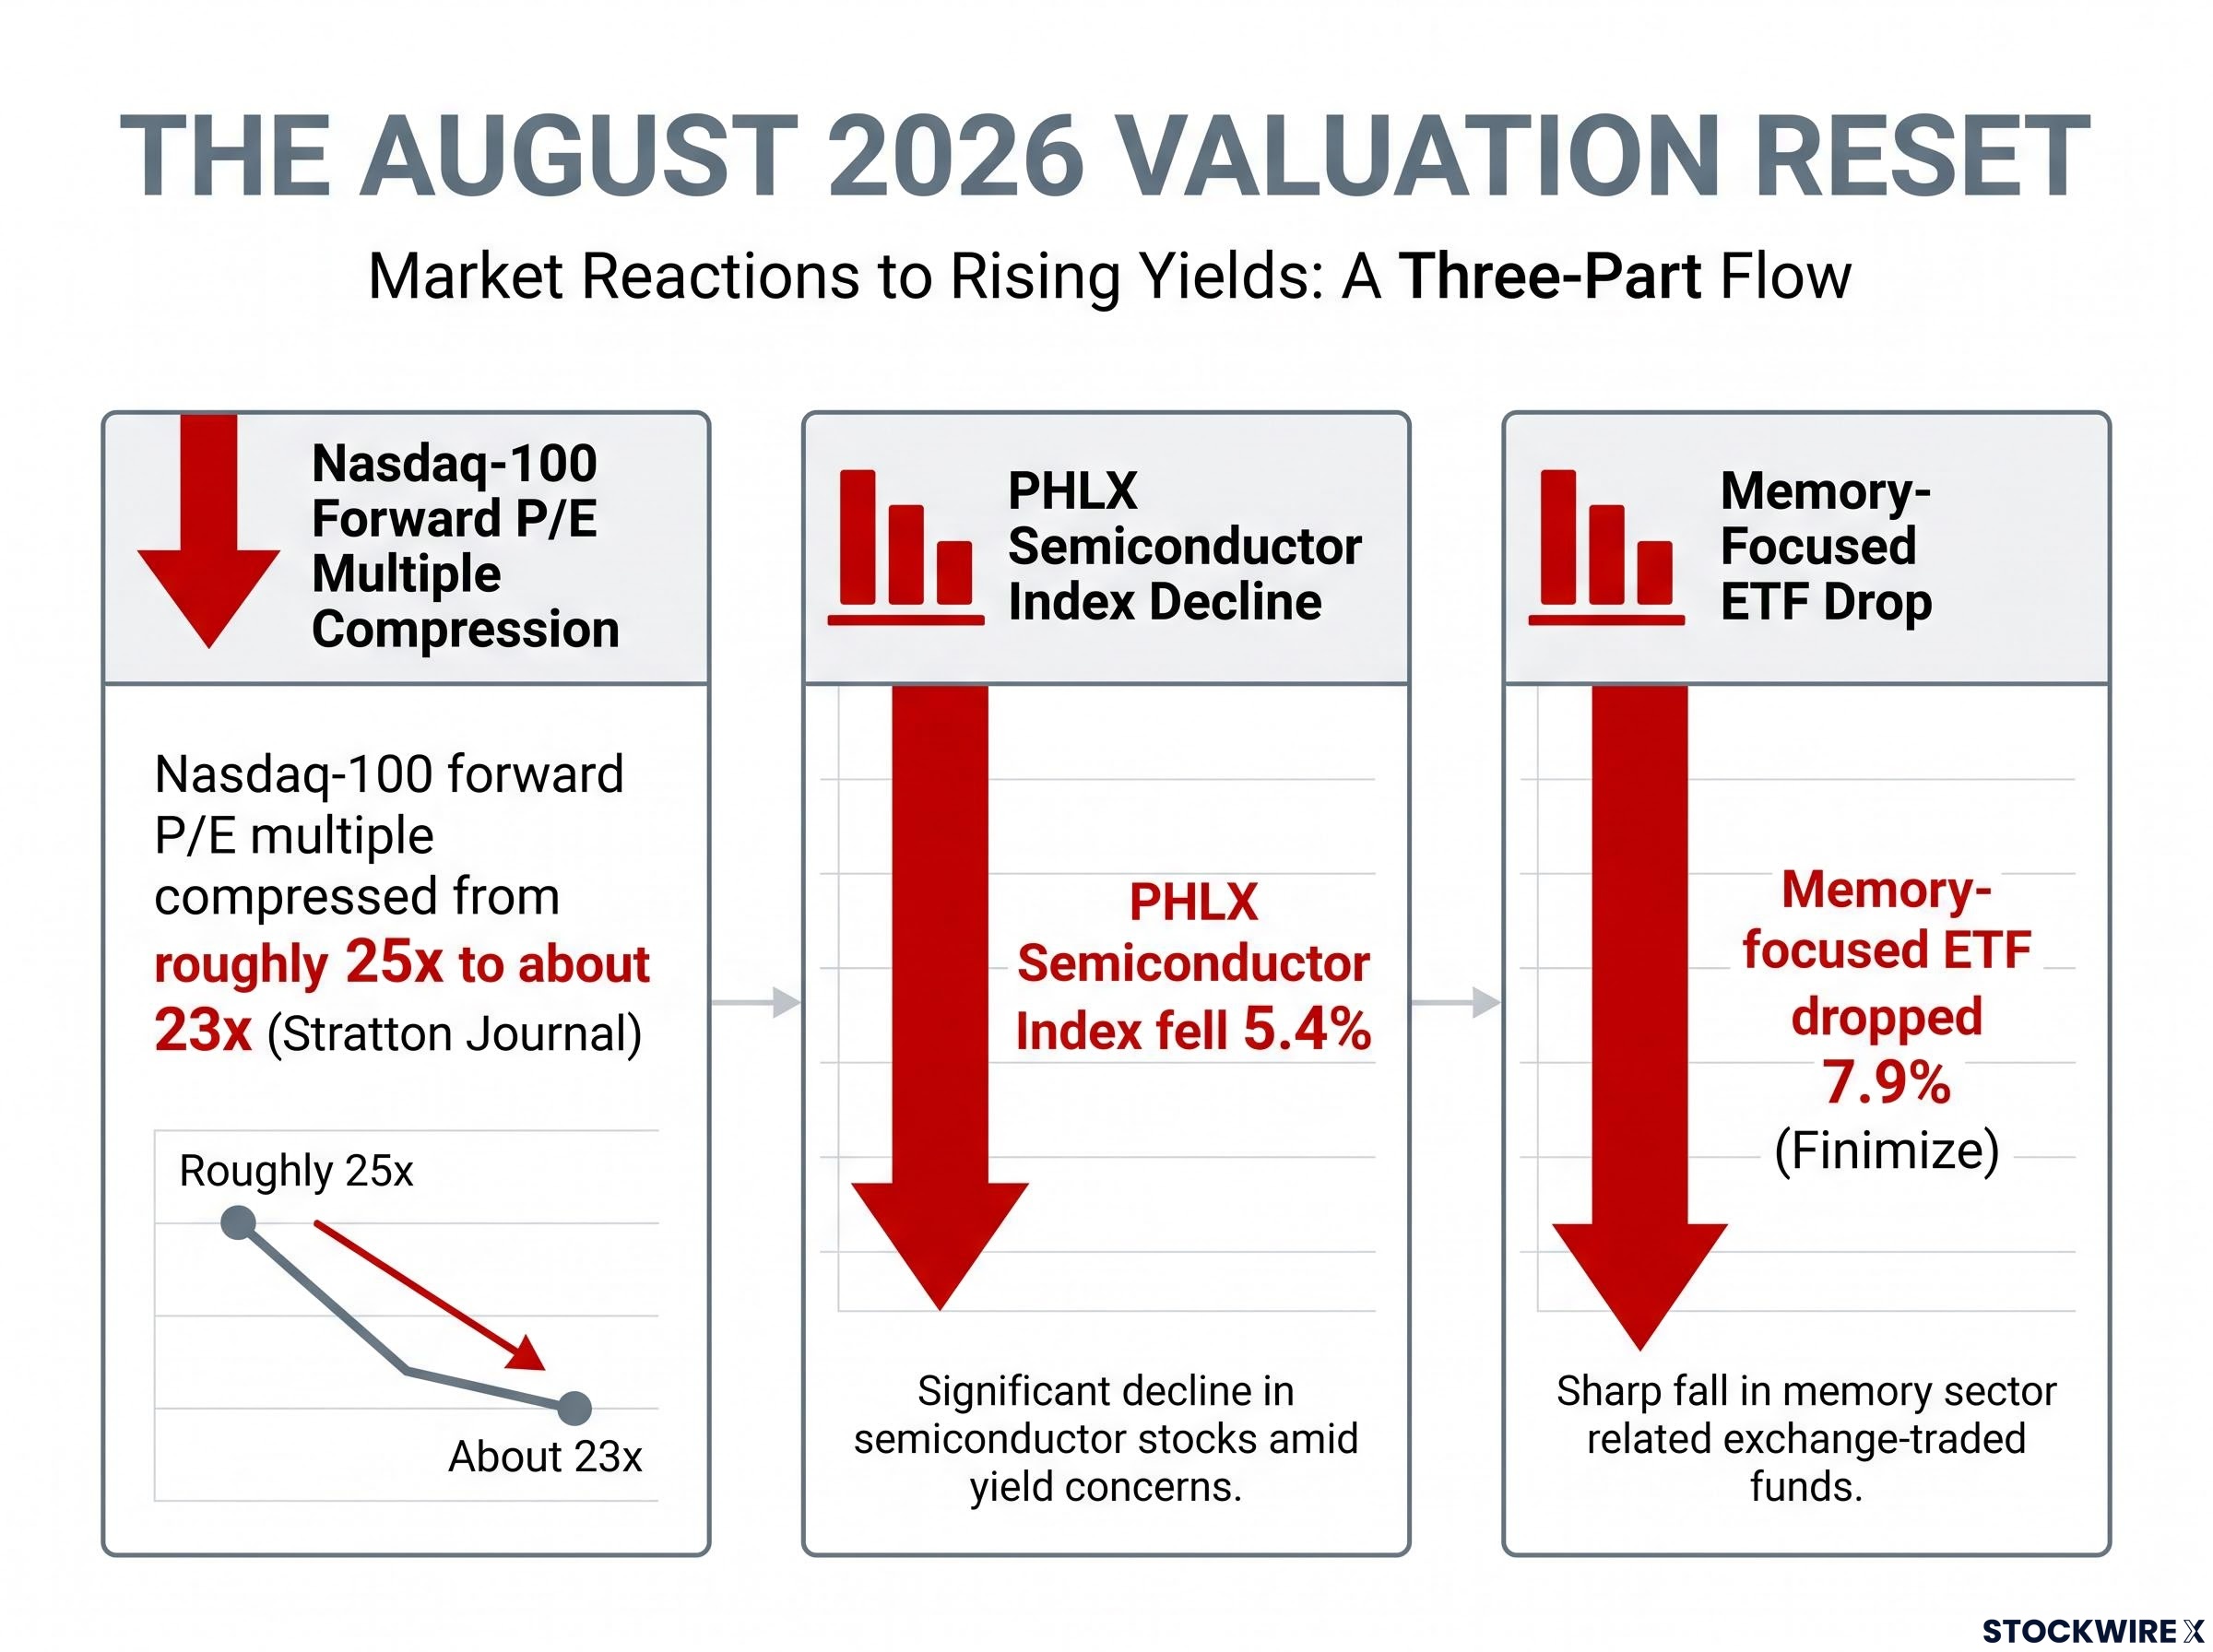
The August 2026 episode made this concrete. As yields climbed, the Nasdaq-100 forward price-to-earnings multiple compressed from roughly 25x to about 23x, according to Stratton Journal. The PHLX Semiconductor Index fell 5.4% during that stretch, and a memory-focused ETF dropped 7.9%, per Finimize.
The dual headwind Higher yields lower the present value of long-dated earnings through a steeper discount rate. At the same time, when Treasuries yield above 5%, the opportunity cost of holding premium-valued chip stocks rises, and capital rotates from technology into fixed income. Intellectia frames these two pressures acting together as the core drag on growth equities.
The 4.8% line as a practitioner signal, not a theoretical construct
The DCF argument is gradual and continuous. Yields tick up, multiples compress a little, and the process repeats. Active traders think differently.
They watch for discrete levels where sentiment and positioning shift sharply, and one analyst has identified 4.8% on the 10-year as the point above which semiconductor selling could accelerate.
The yield was 4.73% on 28 August 2026, 4.75% on 31 August 2026, and 4.77% on 1 September 2026. That climb leaves it just seven basis points below the threshold, which tells you something practical: you are watching a trigger condition form in real time, not reading about one after the fact. That proximity alone is reason enough to reassess how much capital you have riding on the most richly valued chip names.
When big ASX news breaks, our subscribers know first
September’s statistical case against semiconductors, and why it is not the whole story
The calendar adds a second headwind, and the record on it is unusually consistent.
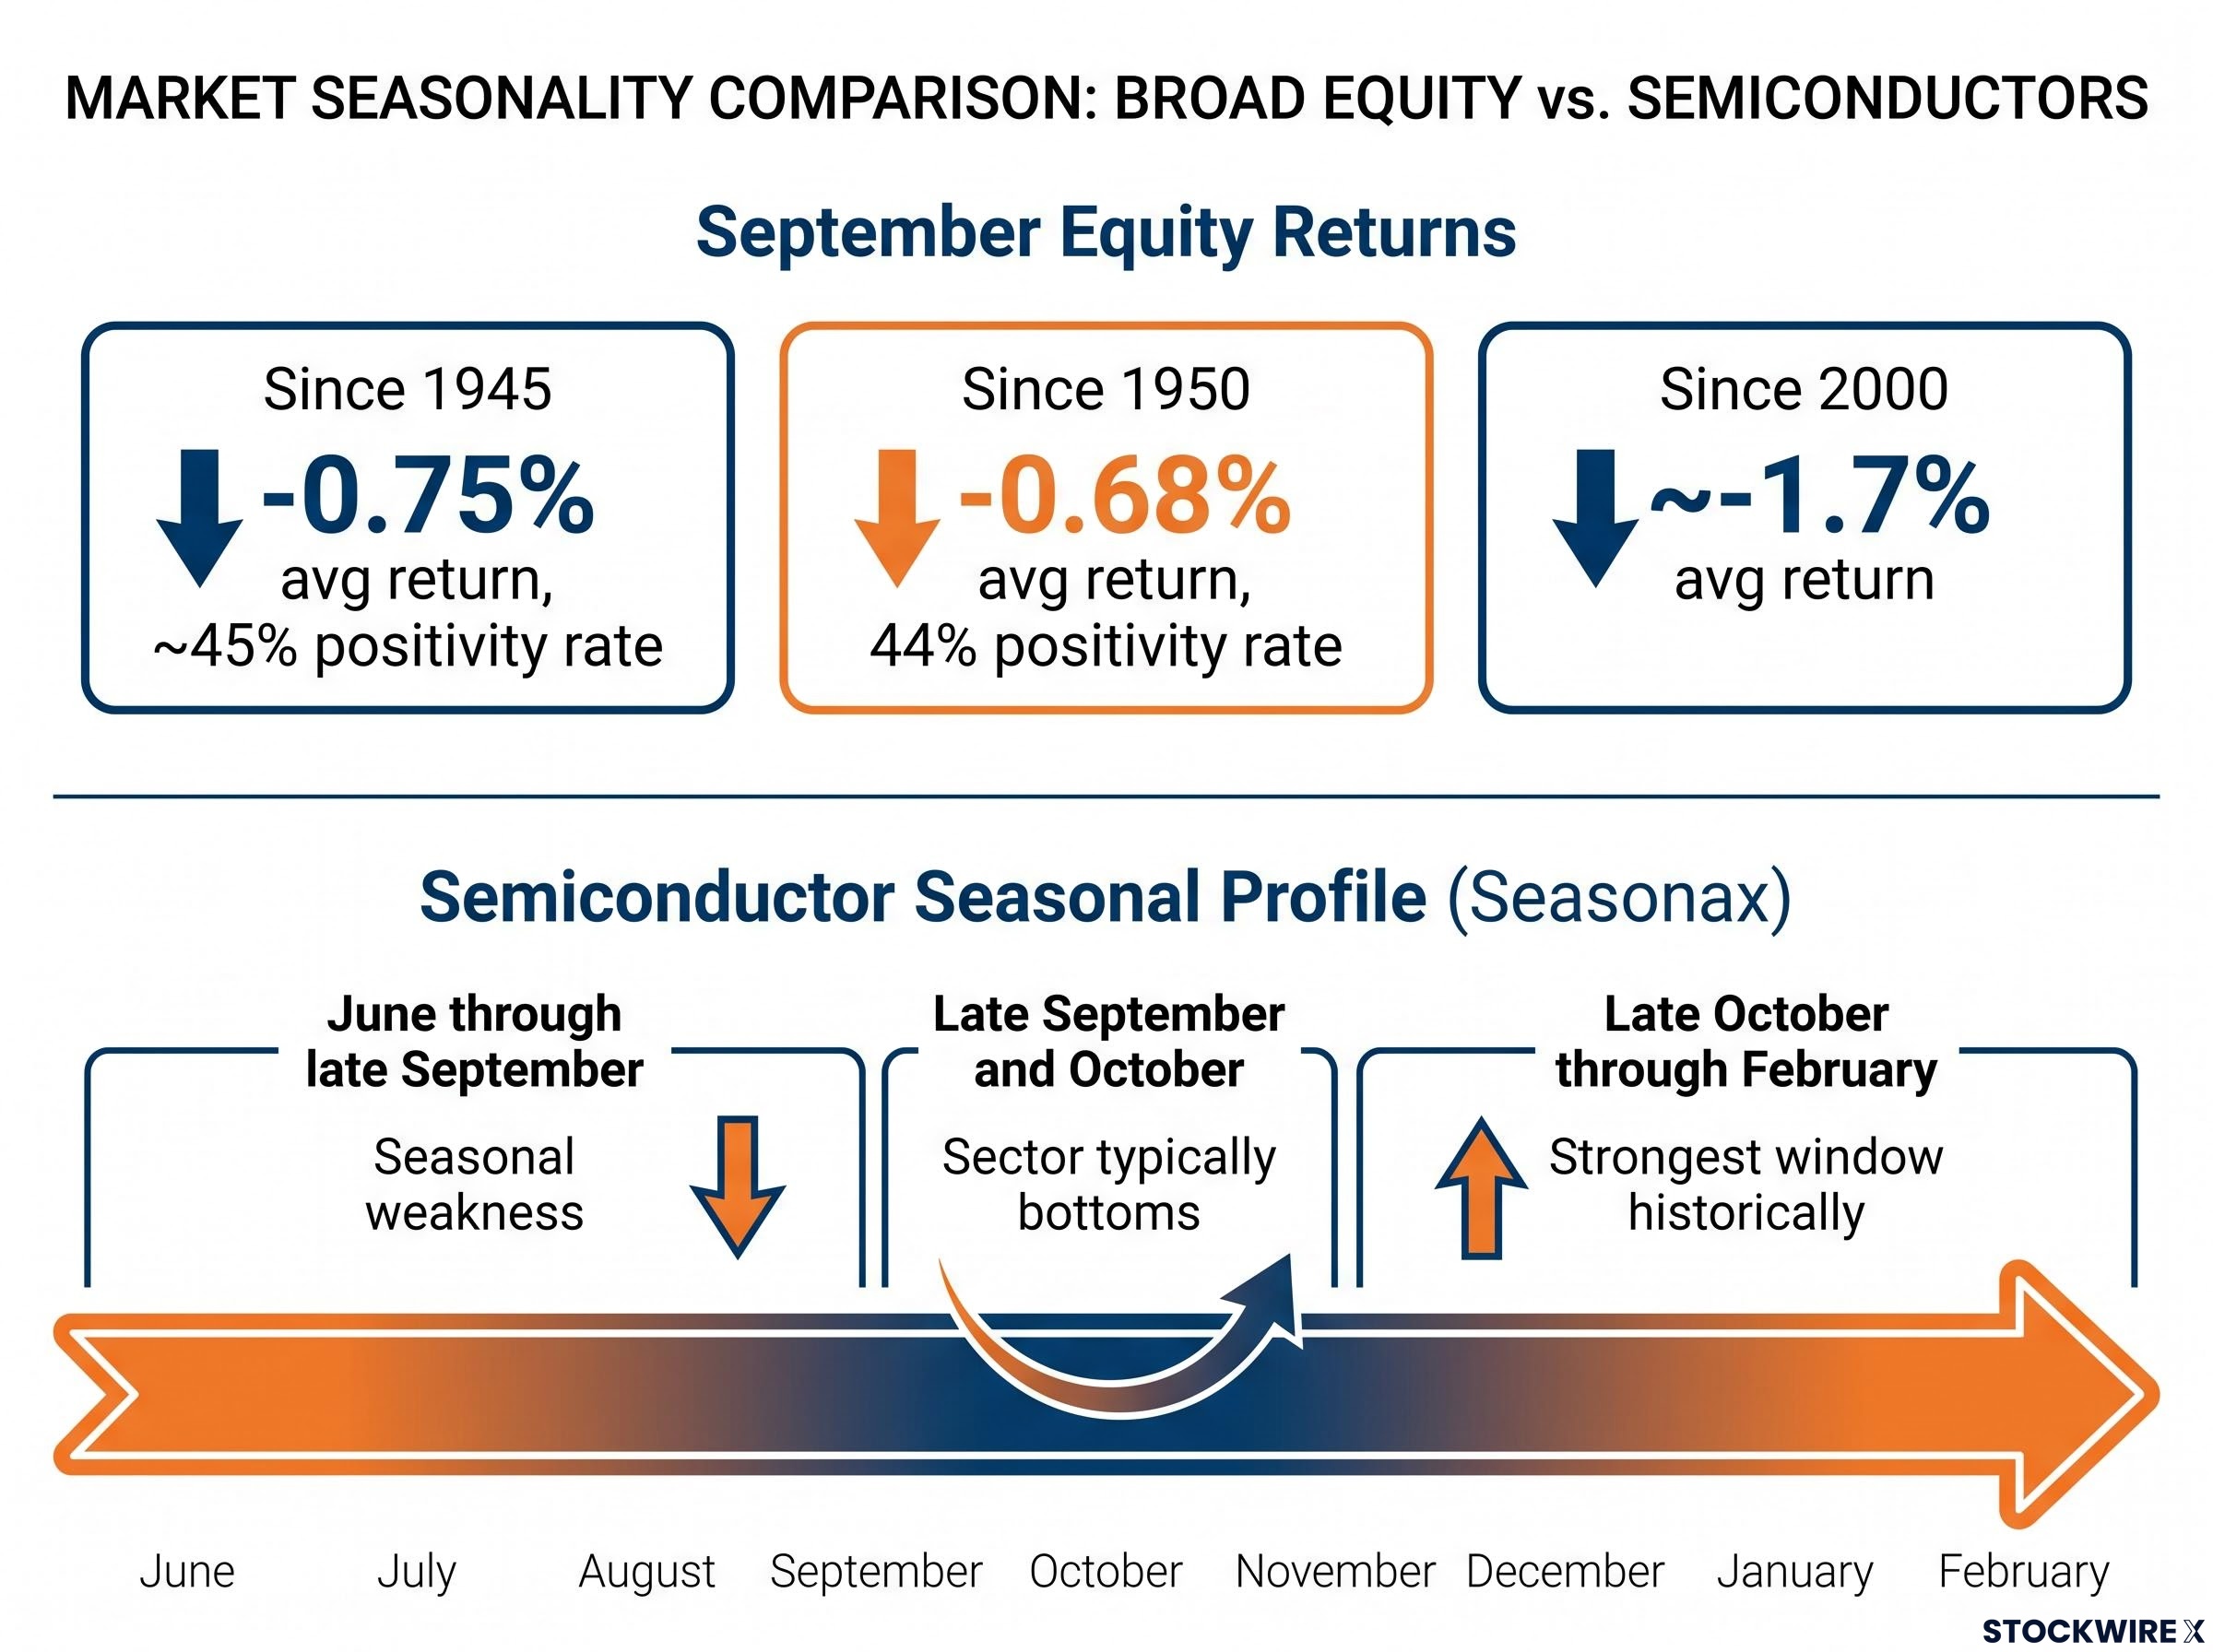
September has been the weakest month for US equities across every long-horizon study you can find. The pattern holds since 1945, since 1950, and since 1928, which makes it a persistent empirical feature rather than a one-year fluke.
| Study Period | Average September Return | Positivity Rate | Source |
|---|---|---|---|
| Since 1945 | -0.75% | ~45% | Verdence Capital Advisors |
| Since 1950 | -0.68% | 44% | Reuters / Carson Group |
| Since 2000 | ~-1.7% | n/a | Morningstar / FactSet |
The distribution matters as much as the average. When September finishes negative, the average loss is around -3.8%; when it finishes positive, the average gain is roughly +3.2%. The positivity rate of about 44-45% is the lowest of any calendar month.
Semiconductors carry their own seasonal profile that reinforces the broad pattern:
- Seasonal weakness runs from June through late September
- The sector typically bottoms between late September and October
- The strongest window historically arrives from late October through February
That is a Seasonax-based analysis summarised in July 2026, and it sits directly on top of the equity-wide September effect.
Here is where the pattern needs complicating. JPMorgan Private Bank has stated plainly that there is “no single proven driver behind the September effect,” which means the tilt is empirical, not causally understood. Fisher Investments went further in late August 2026, warning that seasonality does not drive markets and that fundamentals, not the calendar, determine returns.
The September effect deserves closer scrutiny before it is used as a forward-looking signal: the median S&P 500 return for the month is +0.1% and roughly 52% of all Septembers since 1925 have closed positive, meaning the pattern is closer to a coin flip than a directional indicator, and its measured strength has diminished in recent decades as awareness of it has spread.
The range of outcomes in any individual September is wide, and macro events plus earnings matter far more than the date. Treat the seasonality data as one factor tilting the odds against you, not a guarantee. It sharpens an already-stressed rate environment; it does not decide it on its own.
The AI supercycle bull case and why it does not cancel the near-term risk
Now the other side of the ledger, and it is a heavy one.
The structural demand story behind semiconductors is not soft, and it deserves to land with full force before any qualification:
- Omdia raised its 2026 semiconductor revenue forecast to a 94.1% year-over-year surge on 30 July 2026, driven by DRAM and NAND for AI
- Deloitte projects generative AI chips approaching roughly $500 billion in 2026 revenue, about half of all global chip sales
- IDC and KPMG both put the industry on track to cross the $1 trillion revenue threshold in 2026
- Server DRAM prices are expected to rise about 18% in Q3 2026, per OriginBrief
- AMD’s Lisa Su has pegged the AI accelerator total addressable market at roughly $1 trillion by 2030
That is a coherent body of evidence, not a scattering of optimistic data points. Long-term semiconductor ownership remains defensible on these numbers. What the data does not tell you is that now, with yields threatening to compress multiples further, is the right moment to add exposure.
This is the distinction that matters. A valuation reset driven by rates is not the same thing as a fundamentals breakdown, and August 2026 was the lived example.
Semiconductor valuation dispersion in 2026 is extreme enough to make sector-level verdicts unreliable: Micron trades at under 9x forward earnings while Intel sits at approximately 101x, meaning the multiple-compression risk from rising yields falls with very different force depending on which names carry the most weight in a given portfolio.
The pivot the whole section turns on Intellectia and Stratton Journal both characterised the August selloff as a valuation reset where AI demand, data-centre build-out, and memory price strength remained intact. The chips did not stop selling. Investors stopped paying premium multiples for them.
The real question for you is not whether AI demand is genuine. It is. The question is whether yields stay elevated long enough to force a prolonged derating before those fundamentals re-anchor prices.
AMD’s analyst picture as a sector read
AMD’s consensus offers a useful window into how the institutional view holds both truths at once, and it works better as a sector read than a stock pick.
As of 31 August 2026, 49 analysts carry an average 12-month target of $613.84, per Investing.com consensus. Raymond James analyst Simon Leopold upgraded AMD to Strong Buy on 26 August 2026 with a $641 target, and Rosenblatt Securities sits at $700.
Those targets are bullish and long-dated. Yet the same names sit inside a yield environment actively pressing on their multiples right now. The gap between a $613.84 consensus and the near-term rate drag captures the bull-bear tension in a single line: strong destination, hostile road.
How professional traders are positioning and what to watch from here
The theory is being acted on with real capital, which changes how you should read it.
Analyst Tim Knight holds active short positions across the sector as of 1 September 2026: SMH at $556.63, alongside AMD, Sienna, and AOI. His semiconductor holdings sit within a descending price channel with a recent price gap, and AMD is described as approaching a significant price ceiling, though that pattern has not yet fully formed.
Crucially, stop-loss levels are being adjusted daily across every position. That tells you this is a defined-risk tactical bet, not a conviction call on sector collapse.
The directional outcome comes down to two yield scenarios:
- Yields breach 4.8% and sustain: the discount-rate pressure intensifies, the seasonal window aligns, and accelerated semiconductor downside becomes the base case
- Yields stabilise or fall back below 4.8%: multiples get room to re-expand, and the structural bull case regains the upper hand
Two secondary signals complicate a purely bearish read. Knight notes that bond prices appear to have formed a short-term bottom on candlestick analysis, with the pace of declines moderating. And the VIX sat at very low levels in the prior session, which compresses option premiums and points to limited near-term fear priced into the market.
The number that matters most The 10-year Treasury yield sustaining above 4.8% is the specific trigger cited for accelerated semiconductor downside. At 4.77%, that line is seven basis points away.
You should not mirror the short trade blindly. But the takeaway is clear: professional capital is already treating this yield-seasonality setup as live, and the 4.8% level is a marker to monitor, not an academic footnote.
What the rate-seasonality collision means for your semiconductor exposure right now
Put the three forces together and the picture sharpens into a decision, not a summary.
Yield mechanics, September seasonality, and technical positioning are not three separate risks. They compound. A discount rate pressing on the most yield-sensitive equities, during the historically weakest equity month, with multiples already compressed from 25x to about 23x, produces a combined risk greater than the sum of its parts, and it lands hardest on the highest-multiple chip names.
The resolution conditions are equally clear. The bull case re-emerges if yields retreat from 4.8% and let multiples re-expand. The bear case deepens if yields hold above that level through a seasonal weakness window that, with the semiconductor bottom historically arriving between late September and October, is nowhere near exhausted.
What this convergence tells you is that your margin of safety in high-multiple semiconductor positions is at its thinnest point of the calendar year right now. The structural supports have not gone anywhere. Omdia’s +94.1% forecast and the $1 trillion revenue threshold are the reason to treat this as a tactical window rather than a broken thesis.
Three variables are worth tracking through September:
For investors wanting a systematic framework for managing exposure through cycle inflection points, our dedicated guide to semiconductor cycle positioning covers the five-indicator model for identifying peak-cycle conditions and the graduated de-risking sequence that prioritises memory and thin-moat AI plays before touching foundry or equipment names.
- The daily 10-year yield print against 4.8%, the single defining marker
- SMH’s behaviour within its descending price channel from $556.63
- Any sign of bond market stabilisation translating into genuine equity relief
This article is for informational purposes only and should not be considered financial advice. Investors should conduct their own research and consult with financial professionals before making investment decisions. Past performance does not guarantee future results. Financial projections are subject to market conditions and various risk factors, and forward-looking statements are speculative and subject to change based on market developments.