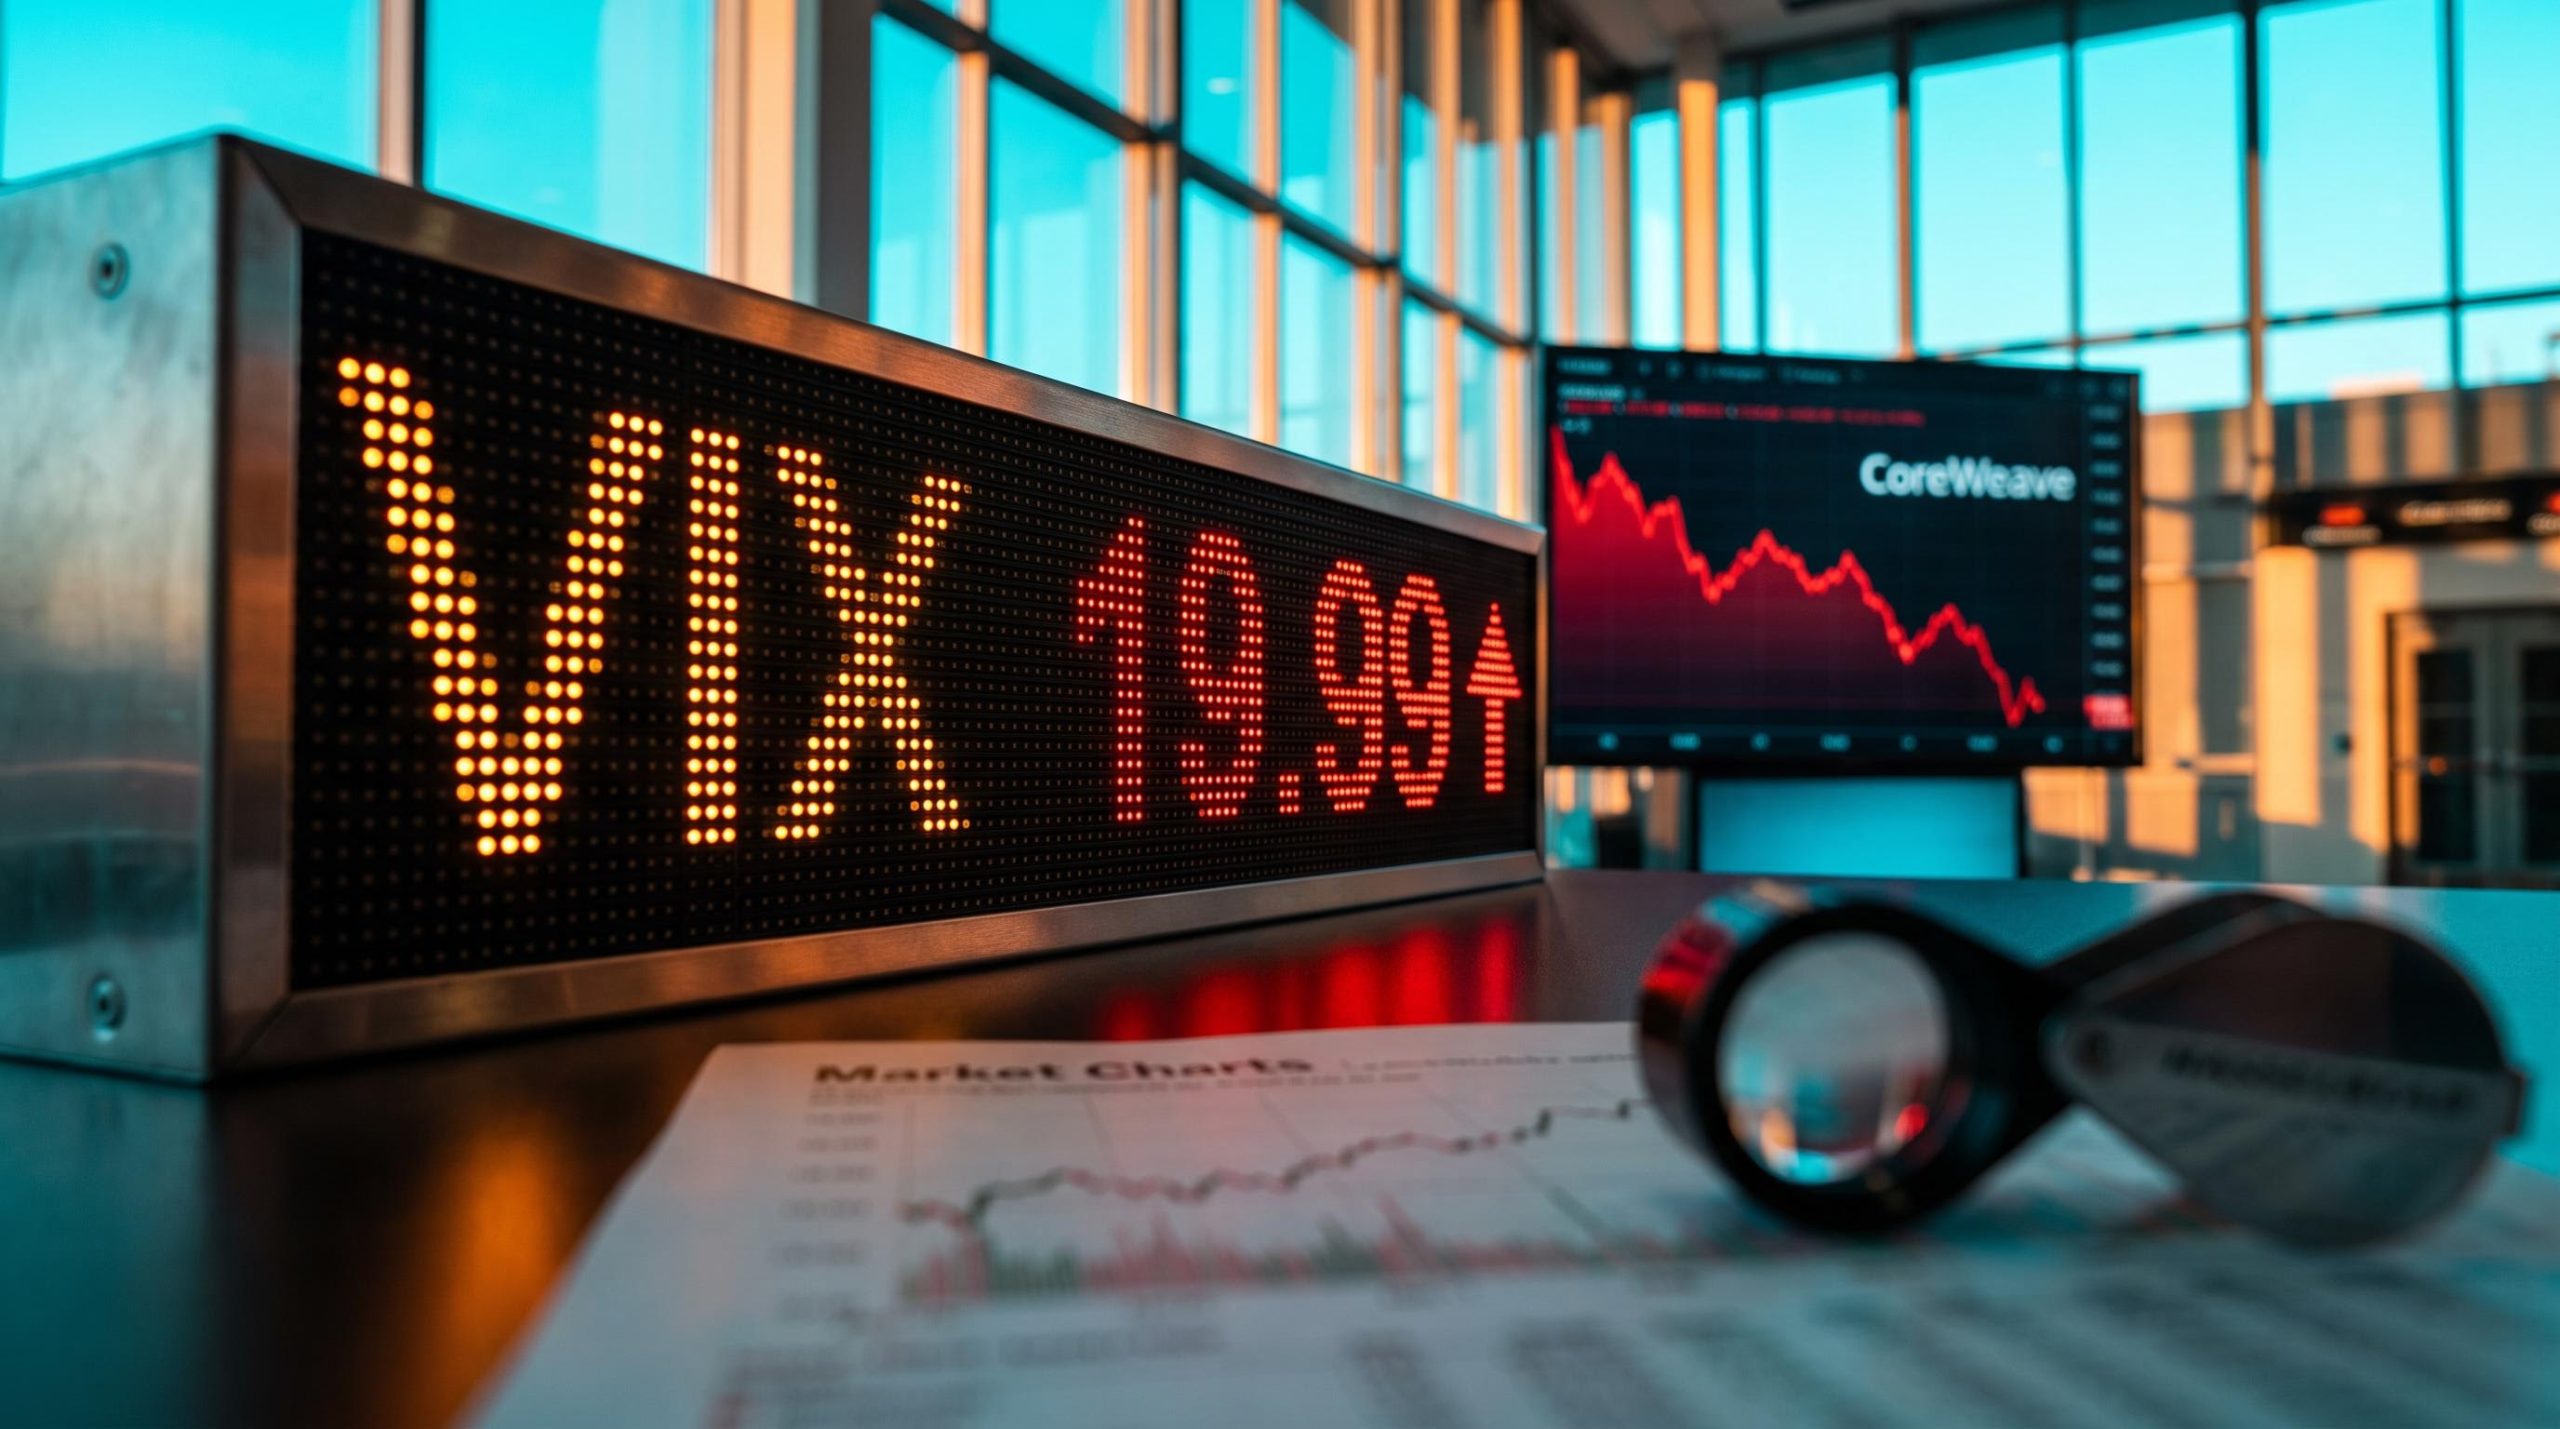
The exact same options contract, same stock, same strike, same expiration, can pay a seller $3 or $120. The only variable that changed is implied volatility.
That disparity is not hypothetical. It is the output of a standard Black-Scholes pricing model applied to a single $90 strike put on a $100 stock with 45 days to expiration, tested across four volatility regimes. The difference between those regimes determines whether the trade generates meaningful income or near-worthless cents-per-share exposure.
Implied volatility is the variable most traders learn last but experienced options sellers monitor first. It controls the size of the premium you collect, and its effect on that premium is nonlinear, meaning small changes in volatility can produce outsized swings in dollar terms. Here is how that mechanism works, grounded in actual dollar figures across four volatility levels, so you can assess whether any given environment is worth selling into.
What implied volatility actually measures (and what it does not)
The most common misconception about implied volatility is that it measures what has already happened. It does not. Historical (or realised) volatility looks backward, tracking how much a stock’s price actually moved over a past period. Implied volatility looks forward.
Implied volatility is the volatility input that makes the model match the market price of the option.
That means IV is derived from current option prices and reflects where the market collectively thinks the underlying could move over the life of the contract, not where it has been. It is expressed as an annualised percentage, but its practical consequence is measured in option dollar premium, which is the value you and every other participant actually transact on.
Here is what IV is not:
- It is not historical volatility (a backward-looking statistic based on past price changes)
- It is not a directional forecast (it does not predict whether the stock goes up or down, only how far it might move)
- It is not a fixed input (it changes continuously as options are bought and sold)
What it is: a market-consensus forecast of future price movement embedded in current option prices.
Every reading you make on an options chain, including call-to-put premium ratios, expected-move brackets, and far-OTM crowding, is a downstream expression of the IV surface at each strike; the same volatility input that drives the $3 to $120 premium range is what sets every figure you see on that screen.
This distinction matters because IV moves independently of the underlying stock price. The stock can sit flat for a week while IV rises or falls, pulling premium up or down in response. If you have ever watched a stock go nowhere while your options position gained or lost value unexpectedly, this is exactly why: the premium was repricing on volatility, not on the stock.
The direct relationship is intuitive once you see it. Higher IV widens the model’s expected range of future prices, increasing the probability that an option finishes in the money. Because that probability has risen, buyers pay more and sellers demand more. Lower IV narrows the range, compresses that probability, and shrinks the premium.
When big ASX news breaks, our subscribers know first
The mathematics behind the premium explosion: vega and convexity
Premium does not scale in a straight line with IV. It accelerates. The mathematical reason centres on a Greek called vega.
Vega is the partial derivative of an option’s price with respect to implied volatility. In plain language, it tells you the dollar amount an option gains or loses for each one-percentage-point change in IV. A vega of 0.10 means the option’s price rises by $0.10 per share (or $10 per contract) for every one-point jump in volatility.
The complication is that vega is not constant. It is itself a function of how close the option is to the money (moneyness) and how much time remains until expiration. Longer-dated options carry larger vega, so a given IV change produces bigger dollar moves when more time remains. And as IV climbs, vega itself grows, which is why each additional point of IV is worth more premium than the last. That compounding effect is the source of the nonlinearity you see in actual pricing data.
Vega does not operate in isolation; options Greeks interact continuously, and as IV rises and vega expands, delta on OTM options also shifts, altering your stock-equivalent directional exposure even when the underlying price has not moved.
Why out-of-the-money options react most to IV changes
Out-of-the-money (OTM) options, those where the strike is far from the current stock price, have near-zero intrinsic value. Almost all of their premium is extrinsic and therefore IV-dependent. That makes them the most volatility-sensitive contracts in the chain, for three structural reasons:
- Tail probability dominance. OTM options derive most of their value from the probability that the stock moves far enough to reach the strike. That probability lives in the tails of the expected return distribution.
- Distribution-tail growth at higher IV. As IV rises, the tails of that distribution fatten faster than the centre. The probability of reaching an OTM strike grows more than proportionally compared to an at-the-money (ATM) strike.
- Convexity of the payoff structure. Options pay nothing until the stock crosses the strike, then pay dollar-for-dollar beyond it. That asymmetric payoff amplifies the sensitivity to wider distributions.
The practical result: a seemingly modest volatility pickup can suddenly make a nearly worthless OTM contract worth trading as a premium-selling vehicle. The same mechanism that made the contract worth only cents can make it worth dollars, and the transition happens faster than a linear model would predict.
The $3 to $120 contract: what the Black-Scholes scenarios actually show
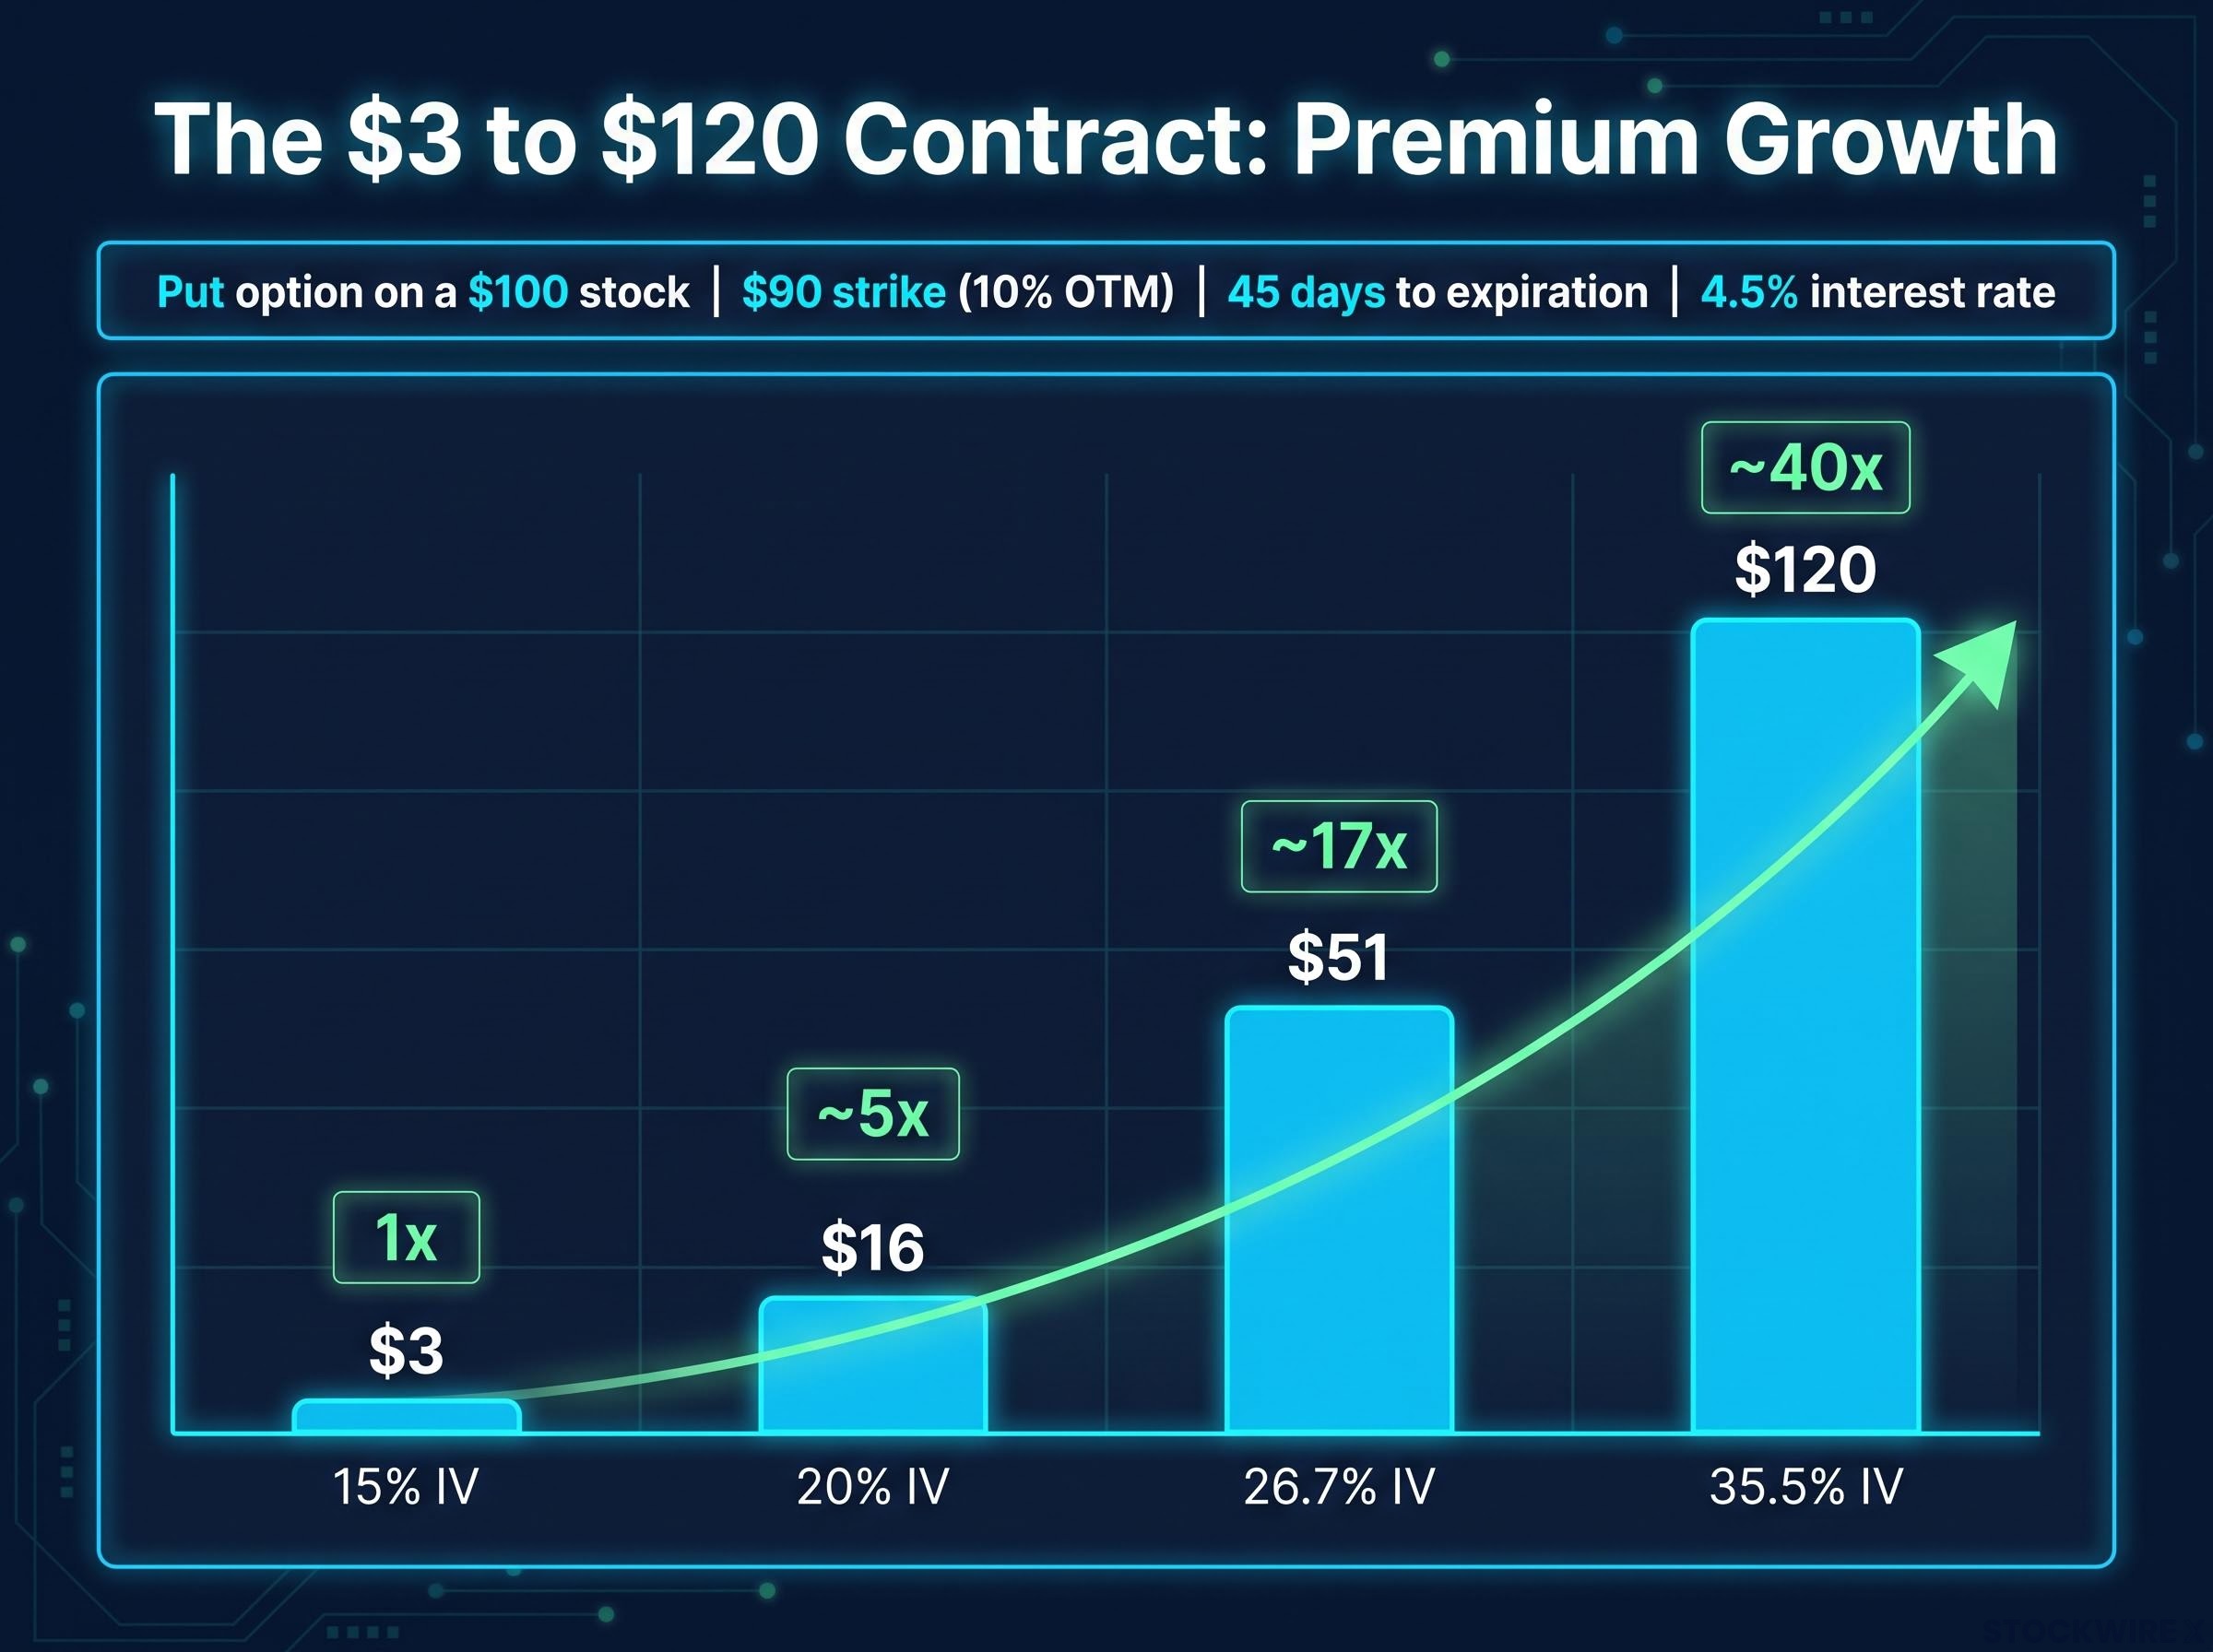
To see this play out in dollar terms, hold every input constant except IV. The contract: a put option on a $100 stock, $90 strike (10% OTM), 45 days to expiration, 4.5% interest rate. Four IV levels tested.
At 15% IV, the model assigns a very low probability that the stock falls far enough to make this put finish in the money. The theoretical value is $0.03 per share, or $3 per contract. For a seller, that is functionally untradeable.
When IV moves up to 20%, a rise of one-third from the starting level, the put’s value climbs to $0.16 per share, or $16 per contract. The $13 increase in dollar premium comes entirely from that volatility shift, with every other contract input held fixed.
Stepping IV up further to 26.7% lifts the put to $0.51 per share, or $51 per contract, a level roughly three times higher than the 20% scenario.
At 35.5% IV, the same OTM put is worth $1.20 per share, or $120 per contract.
| Implied Volatility | Put Value (per share) | Premium per Contract | Multiple vs. 15% IV |
|---|---|---|---|
| 15% | $0.03 | $3 | 1× |
| 20% | $0.16 | $16 | ~5× |
| 26.7% | $0.51 | $51 | ~17× |
| 35.5% | $1.20 | $120 | ~40× |
At 35.5% IV, the same OTM put that was worth $3 at 15% IV is worth $120 per contract, a roughly 40-fold difference.
These are illustrative Black-Scholes outputs for one fixed parameter set. In live markets, premiums vary with model choice, volatility smile and skew, and liquidity. The qualitative direction and nonlinear shape, however, are structurally sound.
Reading the acceleration, not just the endpoint
The endpoint ($120 versus $3) is striking, but the acceleration between steps is where the mechanism becomes clearest for your own analysis.
Moving from 15% to 20% IV (a roughly 33% increase in volatility) produced a five-fold jump in premium. Moving from 20% to 35.5% IV (a roughly 78% increase) produced a 7.5-fold jump from the 20% baseline. As vega expands alongside rising IV, each successive volatility increment delivers a larger dollar gain than the one before it, so equivalent proportional moves in IV produce progressively bigger swings in premium.
Keep in mind the scenario holds all other inputs constant. In practice, time decay, changes in the underlying, and market microstructure all interact, so these scenarios are a clean lens on one variable, not a complete trading model. But they give you a reference frame: when IV rises or falls on a real position, you now have a mental model for how dramatically premium may respond before you run a pricing calculator.
How options sellers use IV regime to decide whether a trade is worth placing
Understanding the mechanics is one layer. Applying it to actual trade decisions is the next. For premium-selling strategies, the IV regime often matters more than the underlying’s current price level, because it determines whether the resulting premium justifies the margin, effort, and tail-risk exposure of the position.
Look at the scenario data again. At 15% IV, a 45-day 10% OTM put generates only $3 per contract. That leaves you no practical room for adjustments, rolls, or absorbing adverse moves. At mid-to-high IV (mid-20s and above in the scenario data), premium reaches a level where defined-risk spread construction, realistic profit targets, and roll capacity become feasible.
Defined-risk spread construction becomes feasible once premium reaches a meaningful dollar level; at mid-to-high IV, the credit collected is wide enough to absorb adjustment costs while still encoding a probability-weighted edge through positive theta.
The practitioner tools for contextualising whether a given IV reading is genuinely elevated are IV rank and IV percentile. IV rank compares the current IV level to its range over a specified historical period (typically one year), expressed as a percentage. IV percentile tells you what proportion of days over that period had IV below the current level. Both help you distinguish between an IV that looks high in absolute terms and one that is genuinely elevated relative to where it has been for that specific underlying.
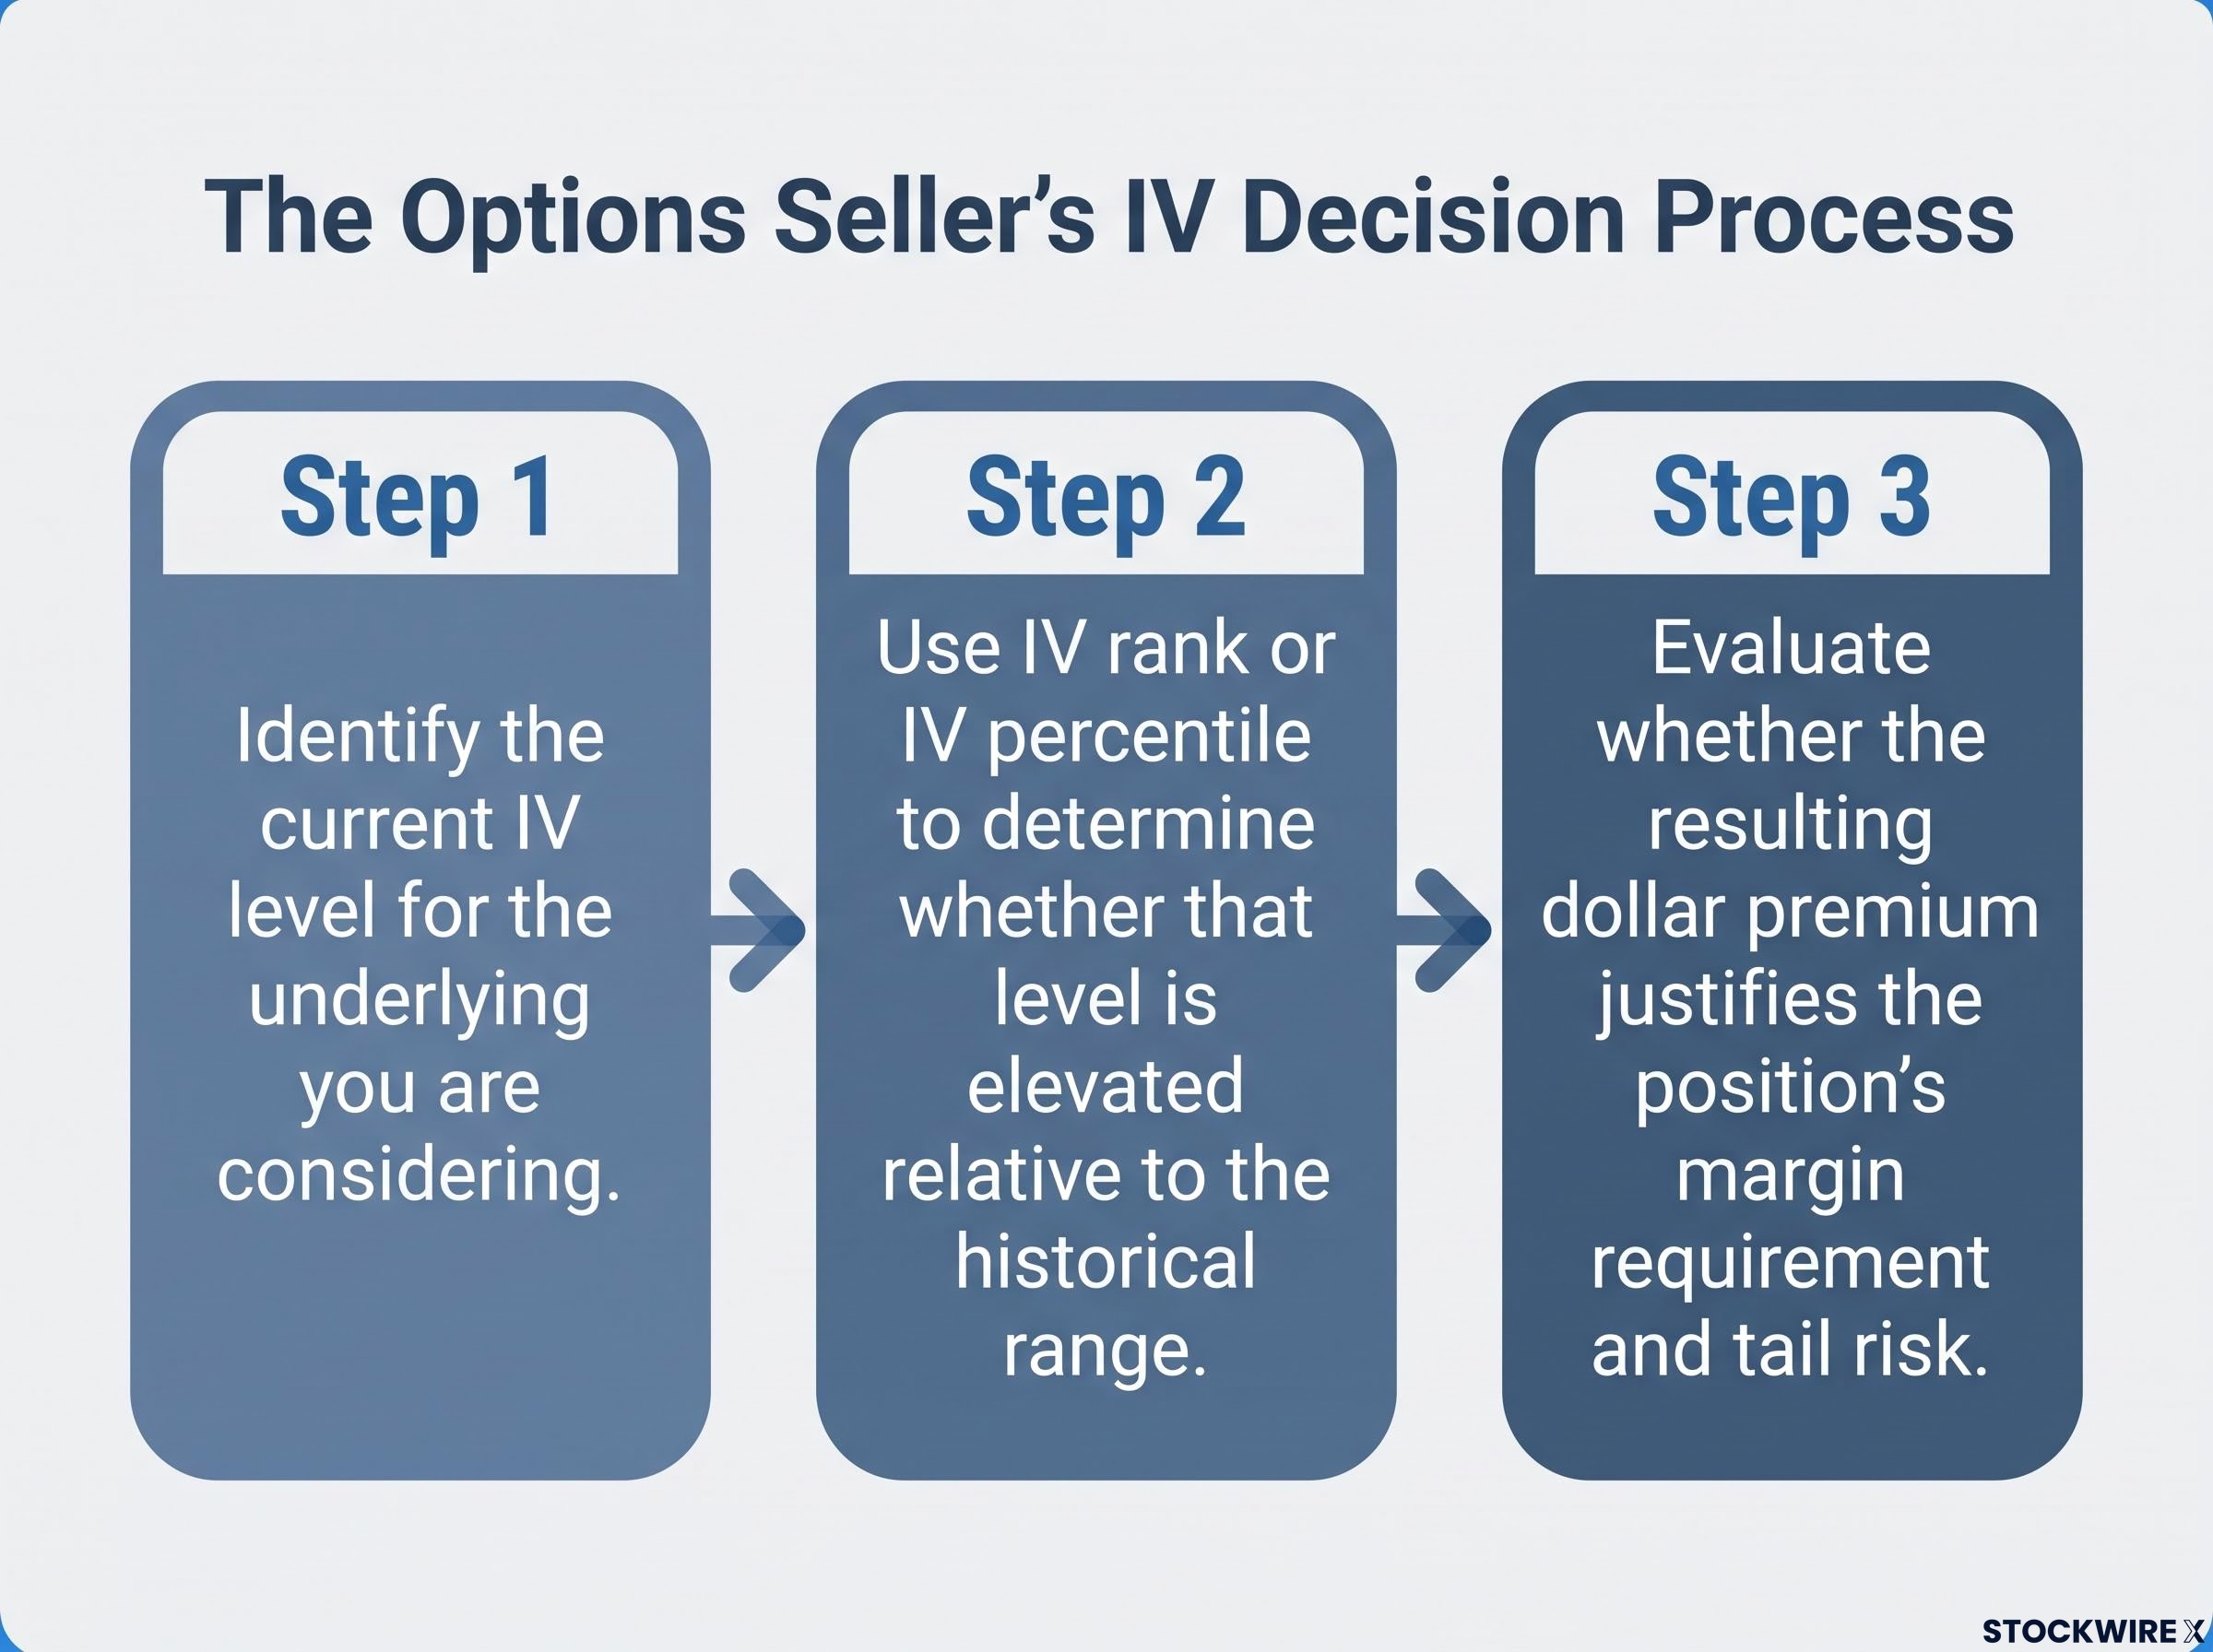
The decision process for a seller typically follows three steps:
- Identify the current IV level for the underlying you are considering.
- Use IV rank or IV percentile to determine whether that level is elevated relative to the historical range.
- Evaluate whether the resulting dollar premium justifies the position’s margin requirement and tail risk.
Elevated premium is the market’s compensation for the real possibility of large price moves, not a structural edge independent of risk.
That caveat is not a footnote. Higher IV reflects the market’s expectation of larger moves, so the premium you collect is compensation for real risk. IV can continue rising after you enter a position, creating mark-to-market losses on short options even before any directional move occurs in the underlying. The breakeven on a short put equals strike price minus premium received: the larger the premium collected, the wider the breakeven buffer, but that buffer must be weighed against the larger expected moves that elevated IV implies.
This article is for informational purposes only and should not be considered financial advice. Investors should conduct their own research and consult with financial professionals before making investment decisions.
Past performance does not guarantee future results. Financial projections are subject to market conditions and various risk factors.
Putting IV in its proper place in your options analysis
The chain from definition through mechanism through scenario data to practical decision-making lands on one conclusion: implied volatility is not a secondary input that fine-tunes premium. It is the primary engine that determines whether a premium-selling environment exists at all.
The $3 to $120 range on the same contract is not an edge case. It is the natural output of the nonlinear relationship between IV and option price, amplified for OTM contracts where tail probability drives nearly all of the value. Understanding that relationship is durable and model-agnostic; even as specific dollar figures vary by parameter set, model choice, and market conditions, the qualitative principle holds.
Three principles to carry forward:
- Check IV rank or IV percentile before entry. A raw IV number without historical context tells you very little about whether the environment is genuinely elevated.
- Use the dollar premium, not just the percentage, to assess whether the trade justifies its risk. A $3 contract and a $120 contract demand fundamentally different trade structures.
- Remember that high-IV premium is compensation for real expected volatility, not a risk-free income uplift. Position sizing, breakeven analysis, and risk limits remain non-negotiable regardless of how attractive the premium appears.
If you take one thing from this, let it be this: IV is not background information you check after deciding to trade an underlying. It is the first filter that determines whether the options market on that underlying is offering you a workable premium environment at all.
For readers wanting to see how the IV regime framework applies to a real market environment, our deep-dive into VIX seasonality patterns examines three decades of data on the late-summer volatility inflection and what historically elevated IV windows have looked like from a premium-seller’s perspective.