Germany’s flash August inflation figure lands today, the US jobs report closes the week on Friday, and between them these two releases could reprice bonds, shift EUR/USD, and alter rate expectations on both sides of the Atlantic in a matter of hours.
Both prints arrive at a moment when central bank policy trajectories are genuinely uncertain. The ECB is monitoring whether energy-driven headline moves signal durable underlying pressure or statistical noise. The Fed is watching a labour market that has been cooling for months but has not yet broken. How each number lands relative to forecasts will shape the policy narrative heading into autumn and, by extension, the valuations of rate-sensitive assets globally.
Here is a framework for reading each release intelligently: what to watch beyond the headline number, how the two reports interact in currency and bond markets, and where the real signals are likely to appear before media narratives settle.
What Germany’s flash inflation figure is actually telling you
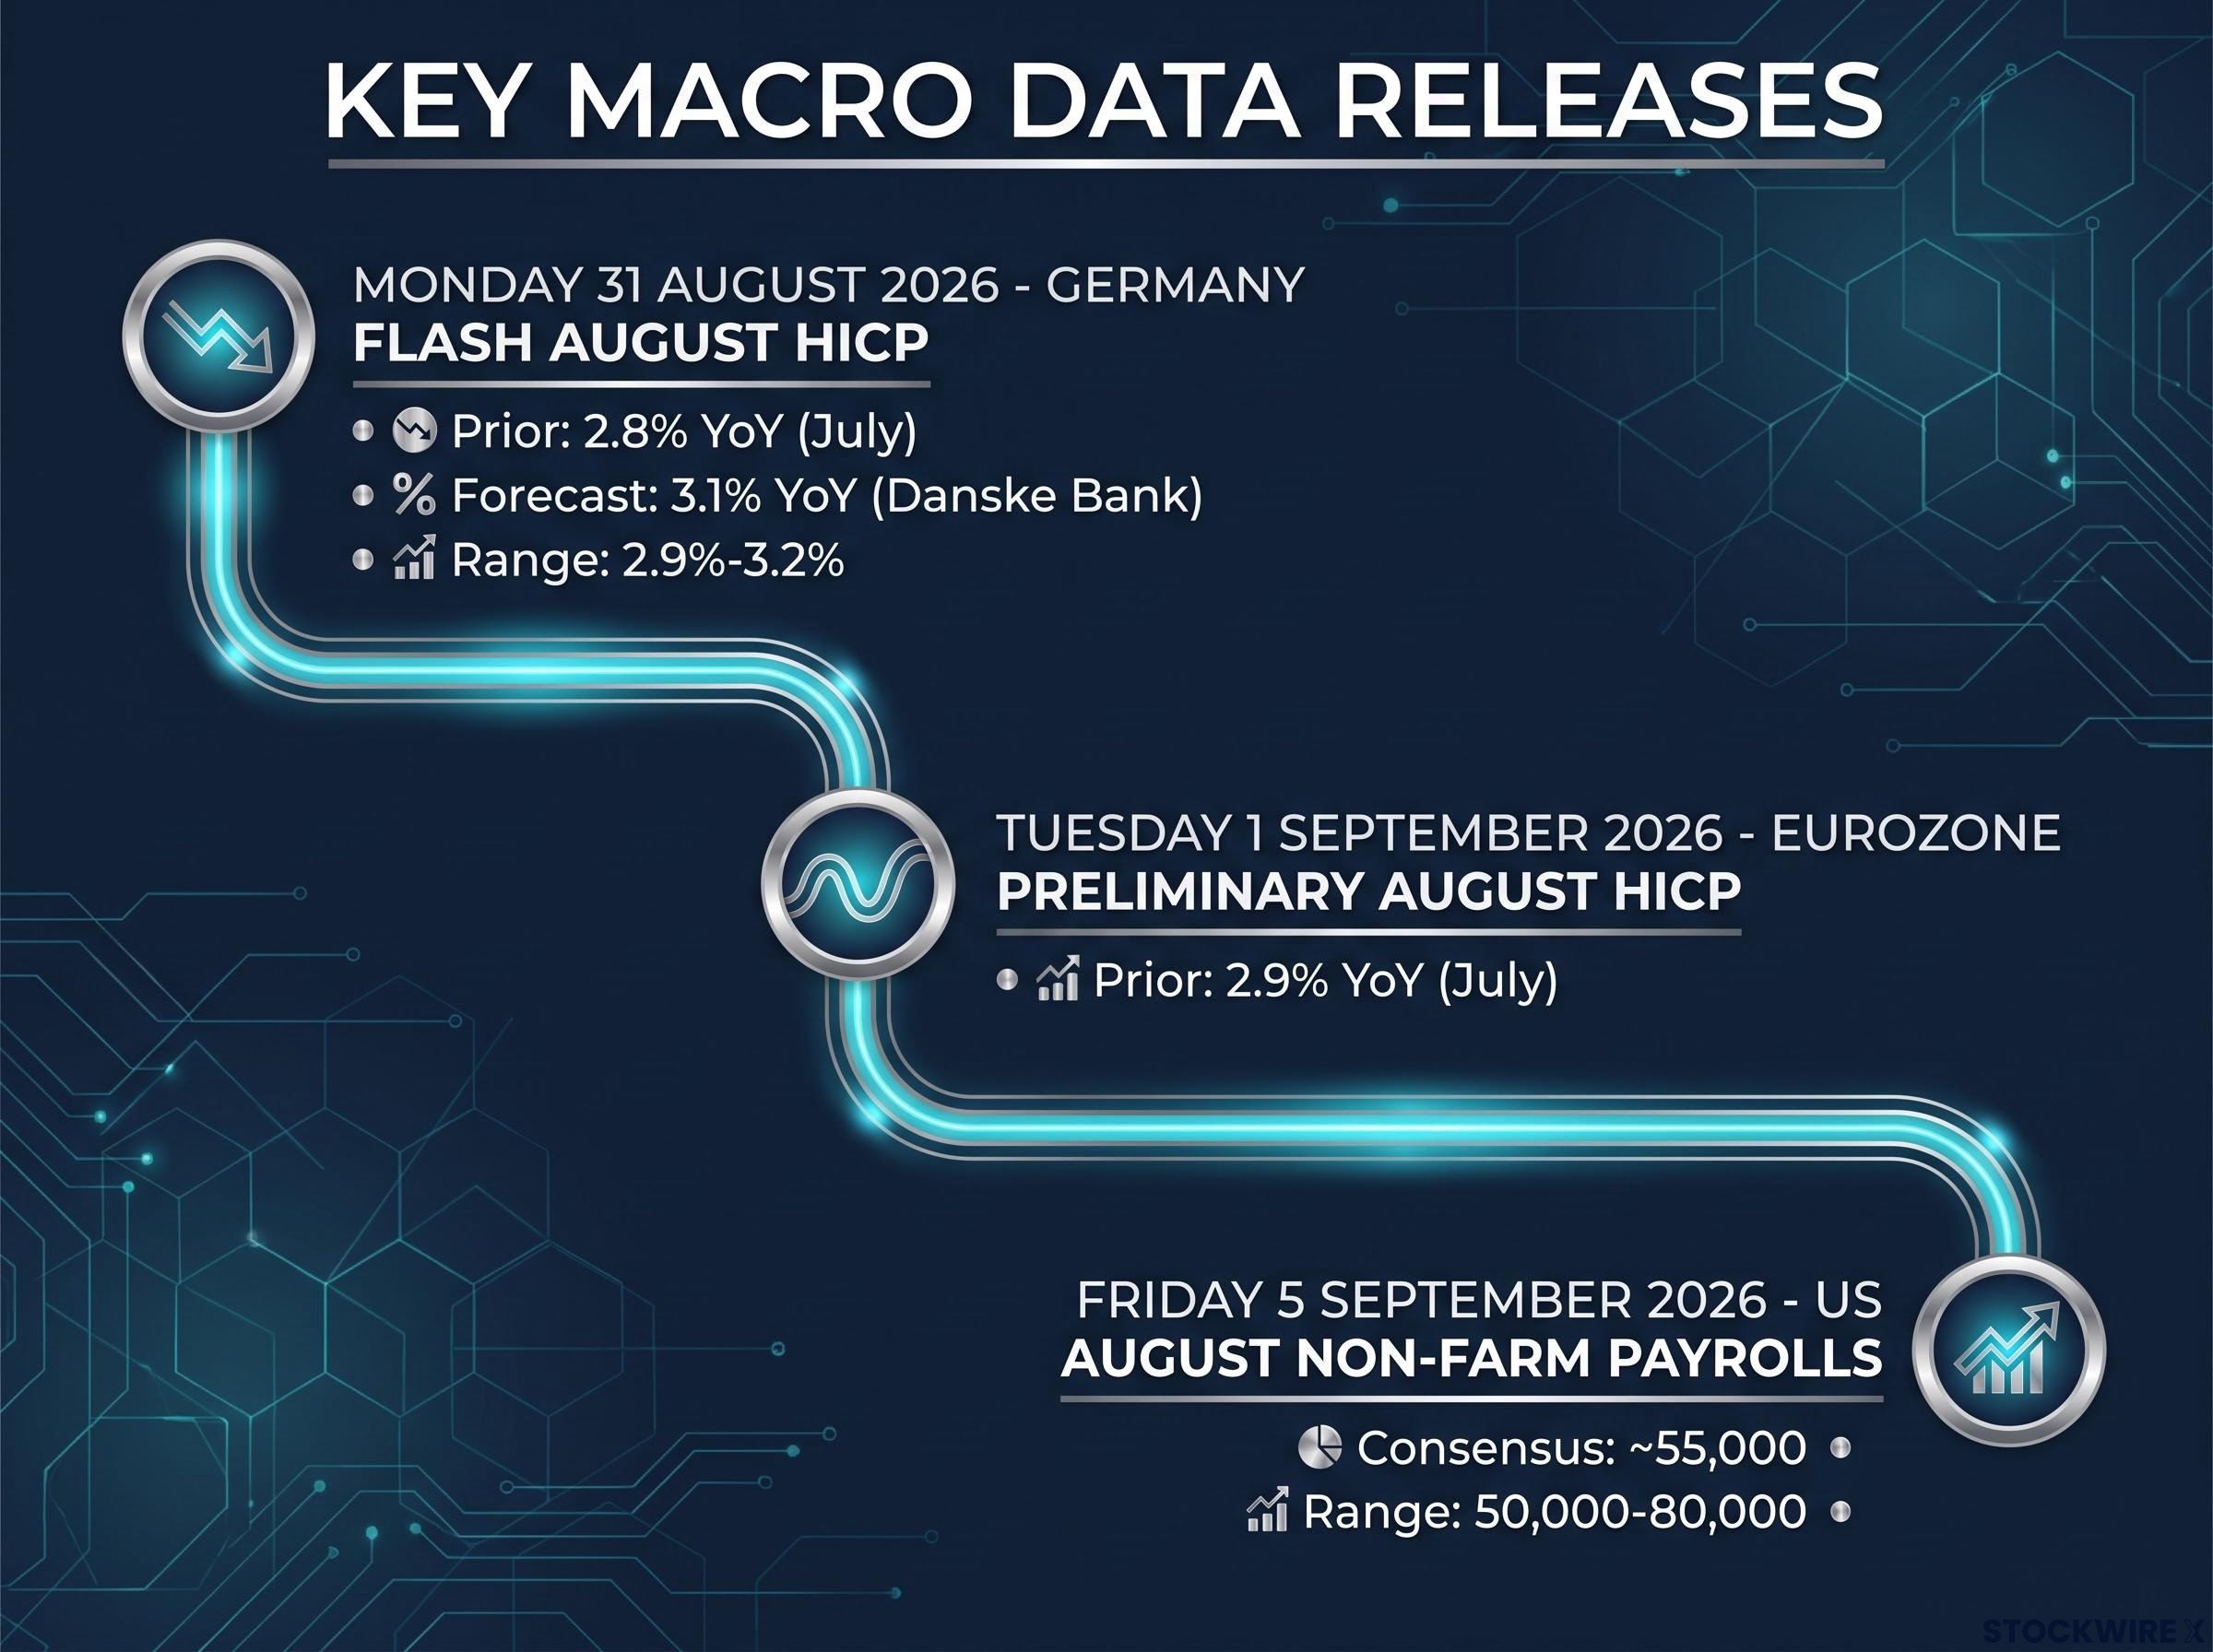
Germany’s July Harmonised Index of Consumer Prices (HICP), the inflation measure standardised across the eurozone, came in at 2.8% year-on-year. Today’s August flash reading is expected to print around 3.1%, according to Danske Bank Research, with broader survey estimates ranging from 2.9% to 3.2%. A jump of roughly 0.3 percentage points in one month sounds meaningful, and it is, but only if you read the right line.
Danske Bank Research puts its August flash HICP call for Germany at 3.1% year-on-year, with energy costs identified as the force lifting the reading above July’s 2.8% figure.
The energy component is doing the work here. That matters because energy-driven headline moves are categorically different from broad-based inflation in how they interact with ECB policy. The ECB cannot drill for oil. It cannot set energy prices. It can raise borrowing costs, but rate hikes do not directly reduce energy costs for households and businesses. When the headline moves because fuel and electricity prices rose, it tells the ECB something different from a move driven by wages or services prices accelerating.
Energy accounts for only around 9% of the eurozone HICP basket, which caps the direct contribution of even a sharp energy price surge at roughly 1.8 percentage points on the headline reading, a structural ceiling that explains why core stability alongside a rising headline is the analytically significant outcome.
Core inflation, the reading that strips out energy and food, stood at approximately 2.4%-2.6% in July. That is the figure to compare today’s release against. When Spain and France published their figures last week, underlying inflation held steady even as the same energy pressures drove their headline readings sharply higher, and that divergence provides the analytical lens through which today’s German data should be assessed.
Three sub-components to watch when the data arrive:
- Headline HICP (the top-line year-on-year figure, expected near 3.1%)
- Core HICP (excluding energy and food, the measure of underlying price pressure)
- Month-on-month change (the pace of the most recent shift, which reveals whether the acceleration is intensifying or plateauing)
If today’s figure arrives in line with the 3.1% forecast while core stays contained, it tells you that energy is driving the move, not embedded wage or services inflation. That distinction means the ECB’s policy calculus is less disrupted than the headline number implies.
| Release | Date | Prior reading | Consensus forecast | Primary driver |
|---|---|---|---|---|
| Germany flash August HICP | Monday 31 August 2026 | 2.8% YoY (July) | 3.1% YoY (Danske Bank); range 2.9%-3.2% | Energy prices |
| Eurozone preliminary August HICP | Tuesday 1 September 2026 | 2.9% YoY (July) | Not specified; expected to reflect Germany’s move | Energy prices; core stability is the key variable |
| US August non-farm payrolls | Friday 5 September 2026 | Cooling trend through 2025-2026 | ~55,000 consensus; prominent forecasts 50,000-80,000 | Broad labour demand |
When big ASX news breaks, our subscribers know first
How Tuesday’s eurozone-wide figure confirms or contradicts Monday’s signal
Germany is the eurozone’s largest economy, and its inflation figures feed directly into the bloc-wide aggregate that the ECB formally targets. July illustrates the relationship clearly: Germany printed 2.8% year-on-year while the eurozone aggregate came in at 2.9%. When Germany moves, the aggregate tends to move with it.
That makes Tuesday’s eurozone preliminary HICP the confirmation layer, not a separate story. Monday gives you the data point. Tuesday tells you whether it is a one-country energy quirk or a signal that inflation pressures are building across the bloc. The ECB’s formal target is 2% over the medium term, and whether the gap between current readings and that target is widening matters most when the movement is broad-based rather than concentrated in a single economy.
The ECB deposit rate trajectory through year-end turns significantly on whether Tuesday’s eurozone core reading confirms stable underlying inflation or signals a re-acceleration, with September already pricing near-certainty of a move to 2.50% and December sitting at a genuinely open 40-50% probability.
The two outcomes that matter
- Core stays stable alongside a rising headline: This outcome reinforces the interpretation that energy is the driver, not a shift in underlying price pressures. It leaves the ECB’s gradual easing trajectory largely intact and is unlikely to trigger a sustained repricing in European rate expectations.
- Core surprises upward: This is the scenario that most directly threatens the consensus view that the ECB is on a gradual easing path. If underlying prices are accelerating alongside energy costs, the ECB faces a more persistent inflation problem than markets have priced, and the repricing in European bond yields could be sharp.
If you hold European bond funds or rate-sensitive European equities, the core reading on Tuesday is the number worth pre-planning for. A core surprise is the outcome that changes the policy outlook; a headline move driven by energy alone is the one markets are already expecting.
Reading the US jobs report: four numbers that matter more than the headline
Friday’s non-farm payrolls report will draw the other half of this week’s macro picture. The US labour market has been cooling through 2025 and into 2026: the unemployment rate has moved higher, hiring has slowed, and recent reports have featured meaningful downward revisions that changed the retrospective tone of the data after the initial headlines faded. The August consensus sits near 55,000 new jobs, with prominent forecasts ranging from 50,000 to 80,000, a subdued but positive expectation.
Most coverage will focus on the single payrolls headline. That is the least useful number in the report for understanding what the Fed does next. Here are the four components in descending order of policy relevance:
- Total jobs added: A print near the 50,000-80,000 range cements the story of a cooling but not collapsing labour market. A significant beat revives “higher for longer” rate concerns; a sharp miss fuels rate-cut expectations.
- Wage growth (average hourly earnings): This is the line that links the jobs report to inflation. Soft payrolls with firm wages keeps inflation risks alive. Weak wages combined with weak jobs gives the Fed more room to ease. For your bond or rate-sensitive equity exposure, wage growth carries more forward-looking weight than the jobs count because wages drive the inflation persistence that determines how long the Fed keeps rates elevated.
- Unemployment rate: Any further uptick, building on the move higher through 2025-2026, signals that tighter policy is continuing to cool demand for labour, which shifts the probability toward earlier rate relief.
- Revisions to prior months: Downward revisions to June and July figures, even alongside a decent August headline, strengthen the narrative of a gradually weakening jobs backdrop. Recent reports have shown this pattern repeatedly, and the revision line deserves as much interpretive weight as the top-line number.
The combination that matters most: soft payrolls paired with firm wages keeps the inflation question alive and limits the Fed’s room to cut. Weakness across both payrolls and wages is the scenario that most clearly opens the door to easing.
Understanding this four-component framework means you arrive at Friday with a more accurate read on how the Fed is likely to interpret the data, and therefore a better basis for assessing your duration and sector risk through the rest of the week.
For investors wanting a complete breakdown of how to sequence the wage, revision, and unemployment data before the headline settles, our dedicated guide to reading NFP sub-components covers the full analytical framework with specific attention to the first 5-15 minutes of market reaction, when the durable directional move typically forms.
The cross-market interaction: where EUR/USD, bonds, and equities move first
These two reports are not independent data points. They are inputs into a single rate-differential equation that drives EUR/USD, bond yields, and the relative performance of rate-sensitive equity sectors on both sides of the Atlantic.
Currencies and bonds
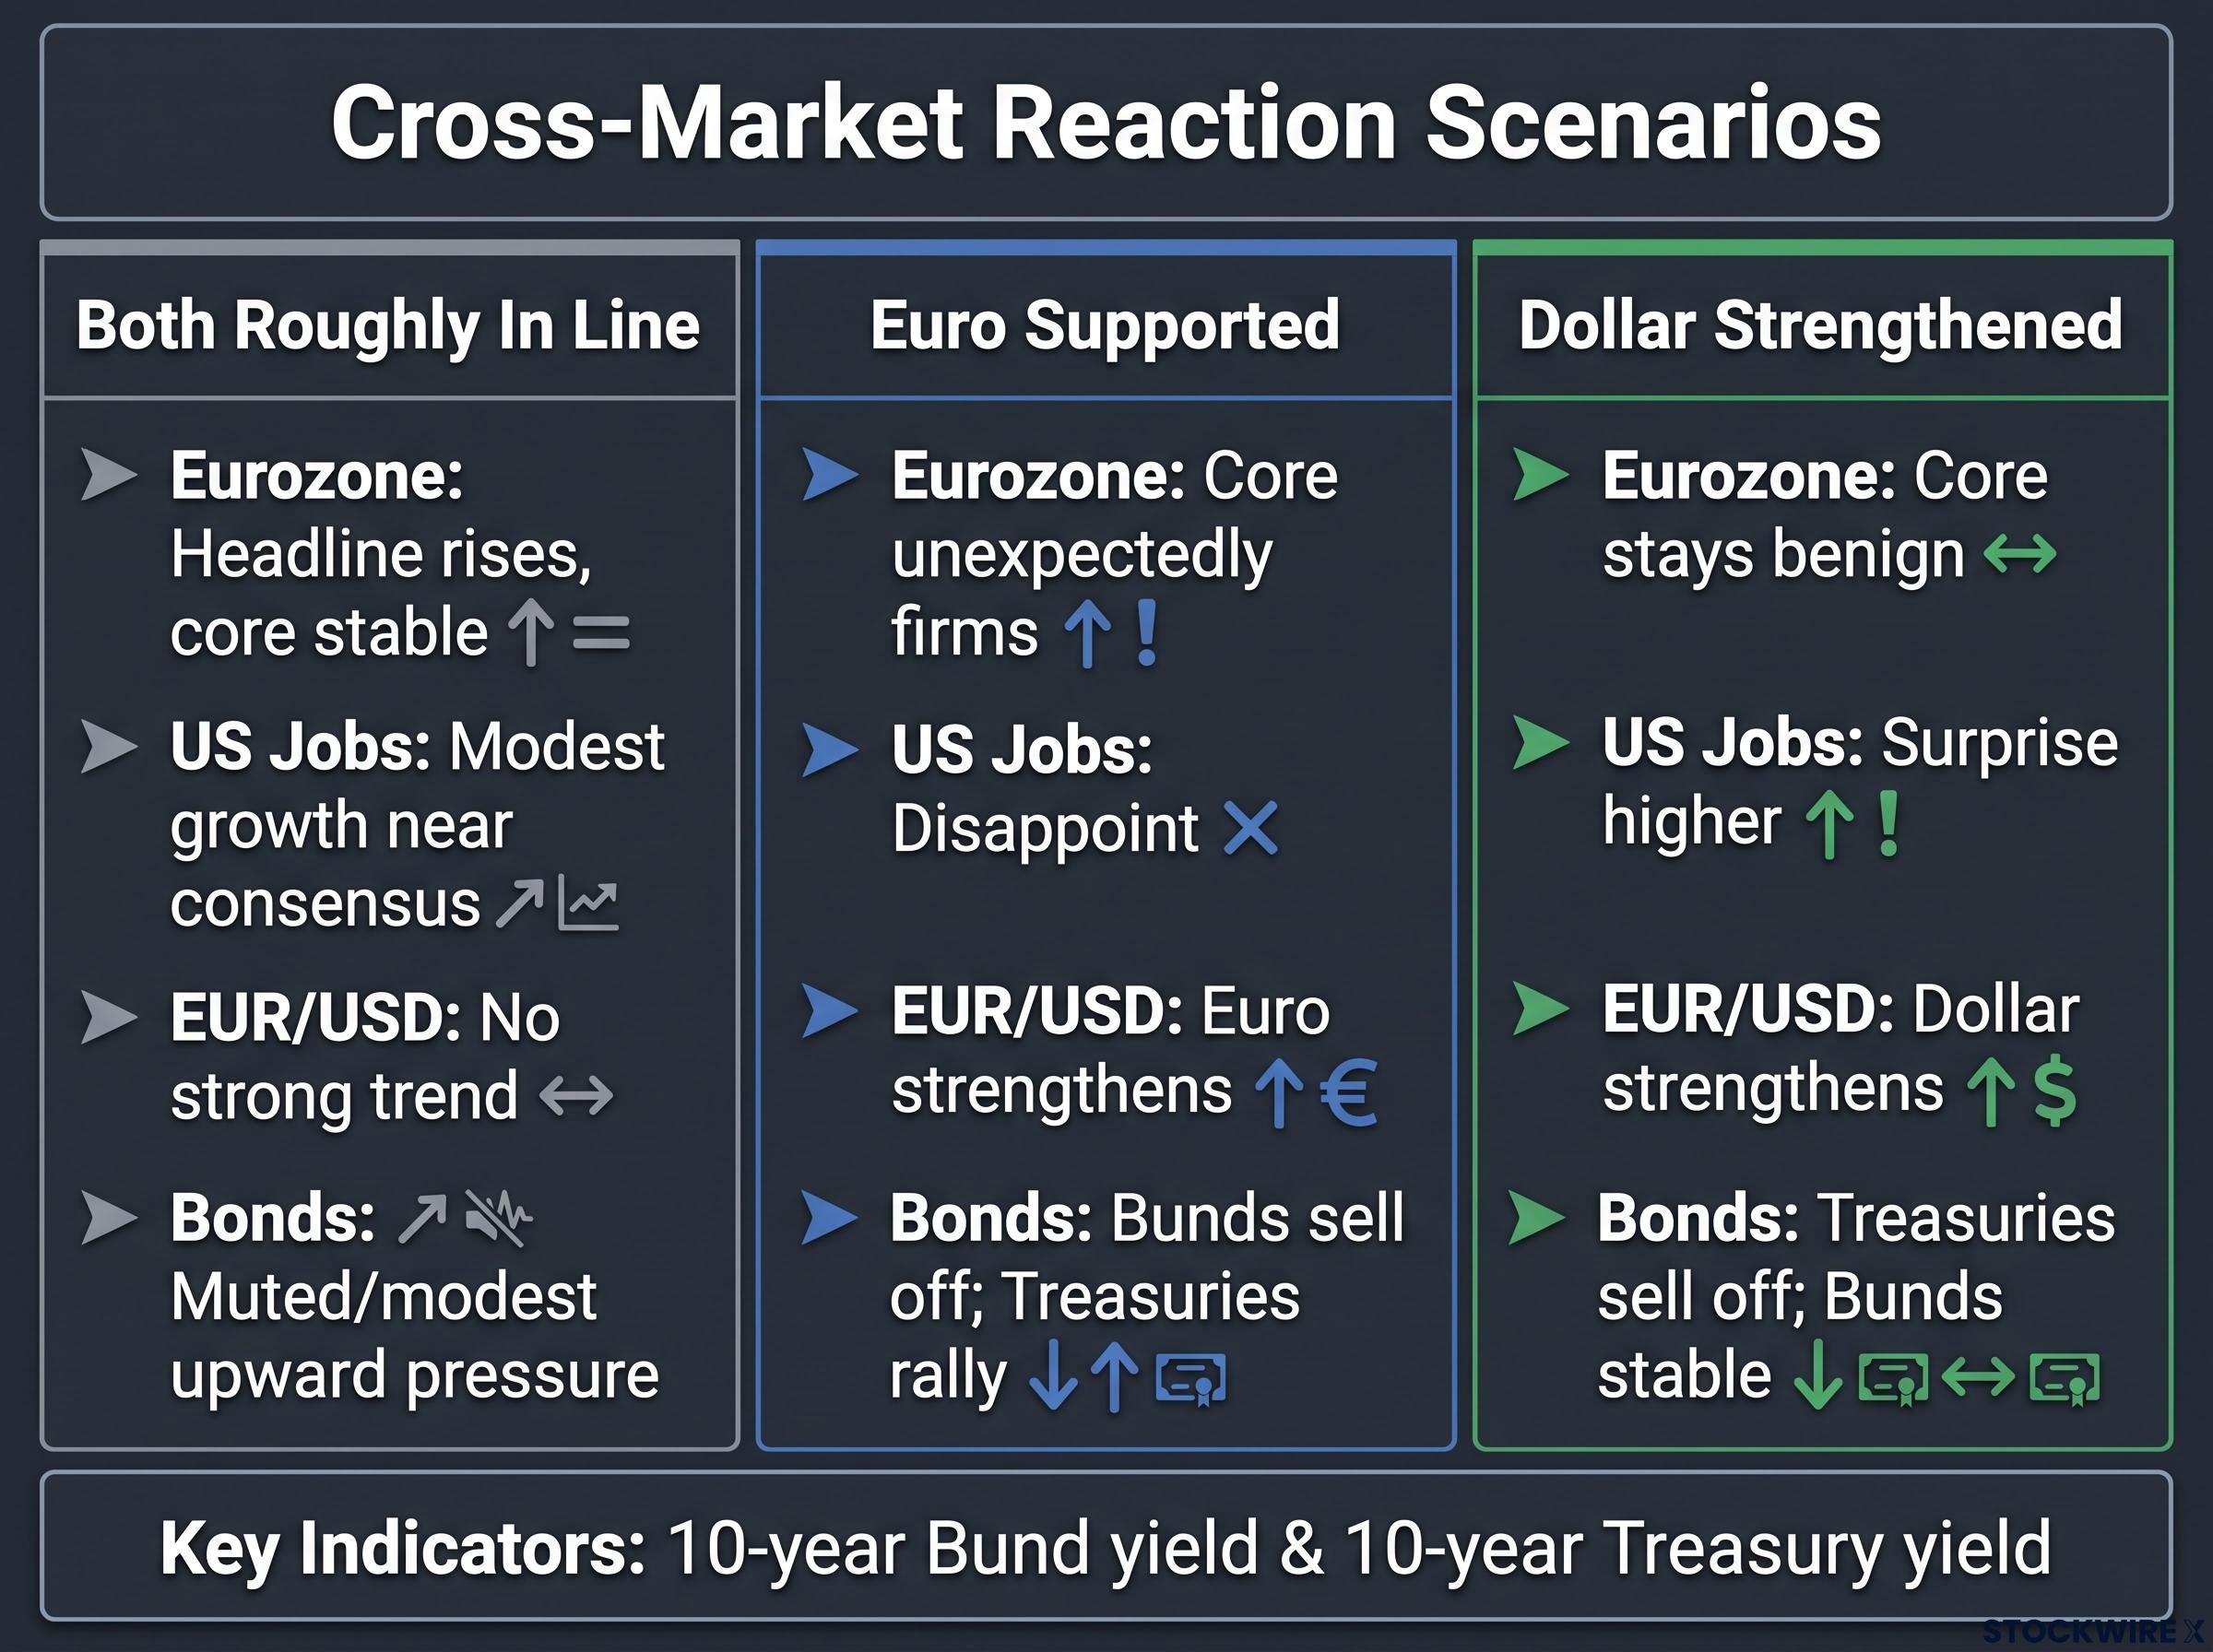
FX markets react primarily to expected rate differentials between the ECB and the Fed. Three scenarios frame the likely directional outcomes:
Rate differential mechanics explain why EUR/USD can move sharply on a single inflation print that misses consensus by 0.1% while a fully priced-in central bank decision produces almost no reaction, a distinction that matters when positioning around this week’s back-to-back macro releases.
| Scenario | Germany/eurozone outcome | US jobs outcome | EUR/USD direction | Bond yield direction |
|---|---|---|---|---|
| Both roughly in line | Headline rises as expected; core stable | Modest growth near consensus | Trades on relative surprise; no strong trend | Muted; modest upward pressure if both beat |
| Euro supported | Eurozone core unexpectedly firms | Jobs and wages disappoint | Euro strengthens as rate gap narrows | Bunds sell off; Treasuries rally |
| Dollar strengthened | Core stays benign | Payrolls and wages surprise higher | Dollar strengthens as differential widens | Treasuries sell off; Bunds stable |
The 10-year Bund yield and 10-year Treasury yield are the two real-time indicators to watch in the hour after each release. Their moves give you a cleaner read on how institutional investors are interpreting the data than media headlines or equity market reactions, which take longer to settle and are noisier.
Equity sector implications
The immediate equity impact will be most visible in three areas:
- Rate-sensitive sectors (technology, utilities, REITs): Valuation multiples in these sectors compress when long-term yields rise and expand when yields fall. A coordinated sell-off in sovereign bonds would pressure these names first.
- Financials: Banks tend to benefit from a steeper yield curve, where short rates fall faster than long rates. That outcome becomes more likely if data push central banks toward gradual easing while longer-term inflation expectations stay anchored.
- European energy and utilities: If the data reinforce a narrative of persistently elevated energy costs in Germany and across the eurozone, companies exposed to power and gas pricing may see outsized moves as investors reassess margins.
If you hold unhedged foreign equity funds or long-duration bond funds, the FX and yield moves this week are not background noise. They are the mechanism by which this week’s data directly affect your portfolio returns, regardless of what local equity indices do.
What to do with the data before, during, and after each release
The investors most likely to make poor decisions this week are those without a pre-set framework for what constitutes a meaningful surprise. Without one, you end up reacting to headlines rather than to the sub-components that actually drive policy. Here is a three-phase approach:
- Before the releases (now through Monday’s open)
- Decide what you consider a hawkish surprise versus a dovish surprise for both Monday/Tuesday inflation and Friday’s jobs data.
- Check your currency and duration exposure. If you hold unhedged foreign equity funds or long-duration bond funds, understand how much of your risk comes from rates and FX rather than stock selection.
- Pre-set your interpretation framework: what would you actually do if eurozone core surprises higher? What if US wages come in firm alongside weak payrolls?
- During each release (the first hour after each print)
- Watch the 10-year Bund yield and 10-year Treasury yield first. These are the institutional signal.
- Watch EUR/USD second. Sharp, sustained moves in yields and FX after each release are more informative than initial media commentary.
- Do not react to the headline payrolls figure in isolation. Wait for the wage growth and revision data to fill in the picture.
- After both releases (Friday evening onward)
- Treat the combined week of data as one input into a longer-term view, not a trigger for wholesale portfolio changes. Recent data history shows how quickly the narrative can shift via revisions and subsequent releases.
- Update your probability assessment for ECB and Fed policy, but update it proportionally. A single week does not resolve a policy trajectory; it moves the distribution.
- If data landed broadly in line with expectations, the framework’s value is in confirming that no action was needed, which is itself a disciplined outcome.
The core signal across both reports: Core inflation and wage growth are the two sub-components that carry real policy information this week. Tracking those before the headline number settles reduces the risk of reacting to noise.
What this week’s data actually changes, and what it does not
The analytical thread running through this week is straightforward: headline numbers matter less than sub-components, the interaction between the two reports matters more than either in isolation, and bond and FX markets will tell you how institutional investors have read both before equity analysts finish writing their notes.
A single week of data does not resolve the ECB’s or the Fed’s policy trajectory. It moves the probability distribution. The autumn policy calendar, with ECB and Fed meetings ahead, is the next major decision point that this week’s releases feed into. Treating Monday through Friday as one input into that broader context, rather than a standalone verdict, is the appropriate analytical posture.
This article is for informational purposes only and should not be considered financial advice. Investors should conduct their own research and consult with financial professionals before making investment decisions. Past performance does not guarantee future results. Financial projections are subject to market conditions and various risk factors.