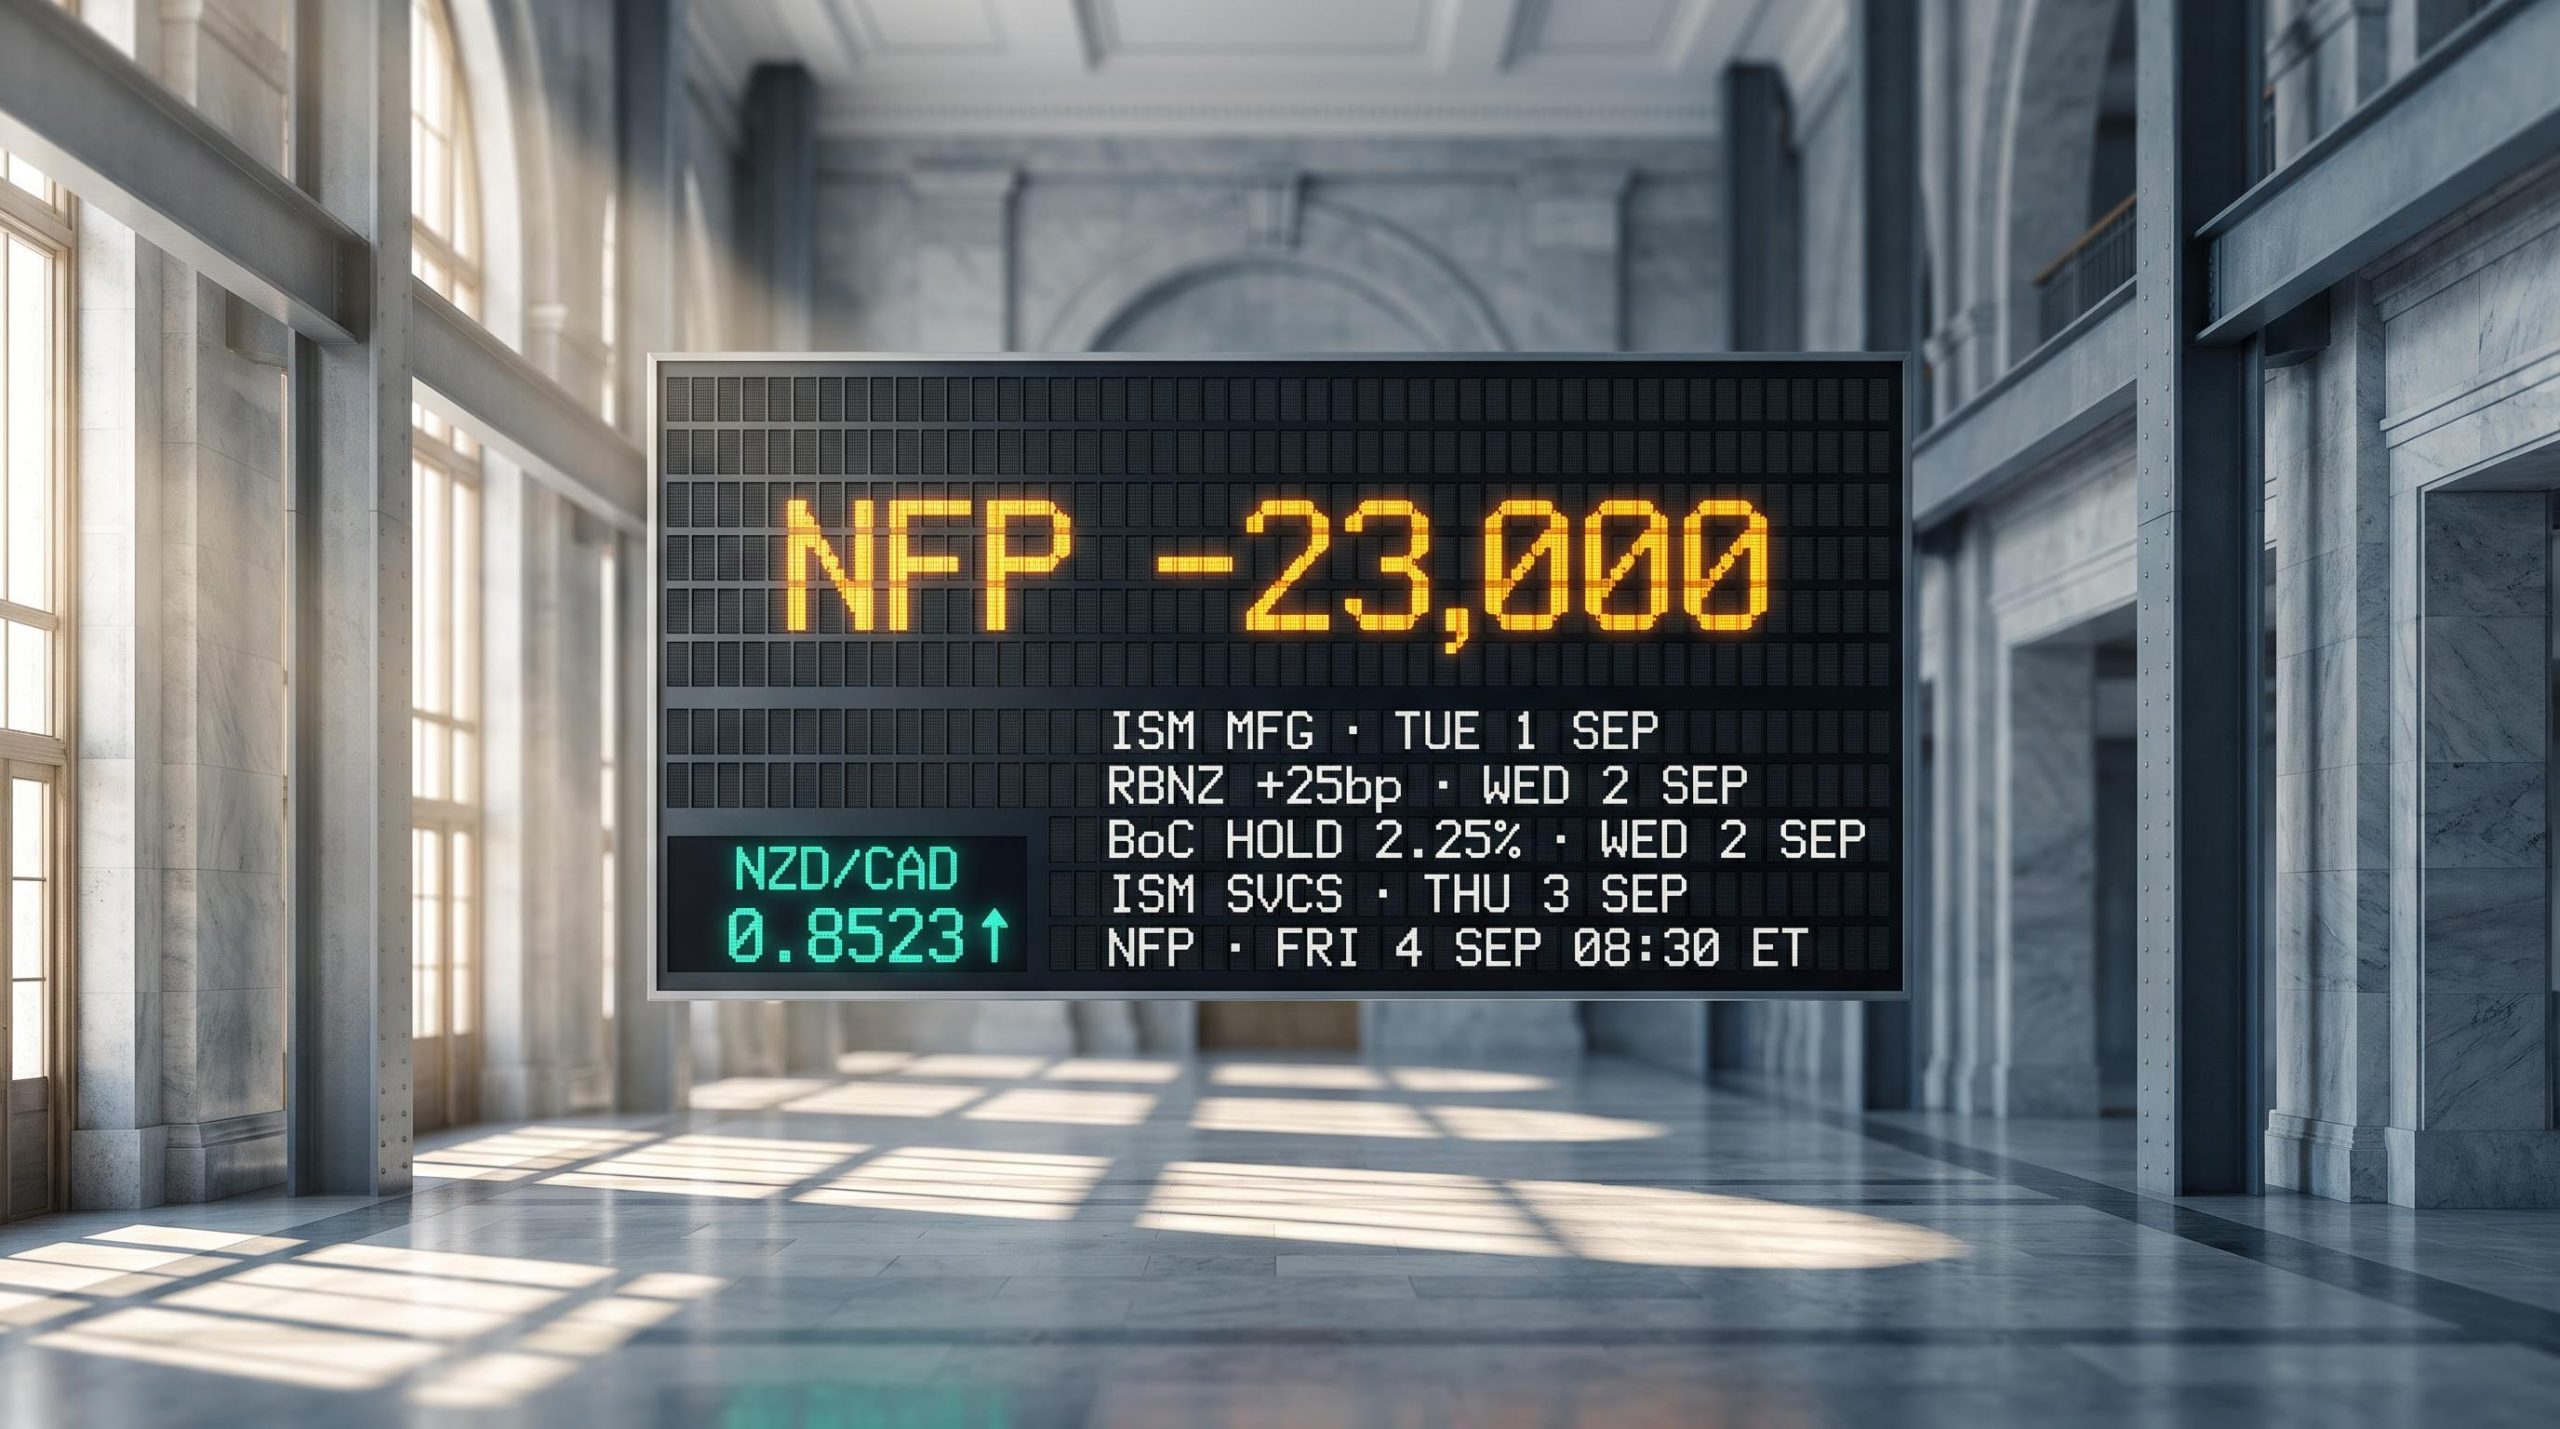
After weeks of thin summer liquidity and data-light sessions, the calendar is about to snap back. The five trading days starting Tuesday 1 September deliver two ISM surveys, two central bank decisions, and the most consequential US jobs print of the northern-hemisphere summer, all landing less than two weeks before the Federal Reserve’s September policy meeting.
The week functions as a compressed policy referendum. The Fed has limited remaining data before it must signal its September posture, and every ISM subindex, every central bank statement, and every payroll figure this week acts as a partial vote on whether policymakers stay patient or are forced to signal greater openness to cuts. Running simultaneously in the background is a structurally independent story: the Reserve Bank of New Zealand (RBNZ) hiking while the Bank of Canada (BoC) holds, creating a live divergence trade that commodity-currency desks will be watching through NZD/CAD.
What follows maps each release to the market variable it is most likely to move, identifies the specific subindices worth tracking inside each headline number, lays out the scenario framework for Friday’s Non-Farm Payrolls (NFP), and pinpoints where the clearest trade expression of the week’s central bank divergence sits.
Tuesday’s manufacturing survey sets the tone for the week
The ISM Manufacturing report on Tuesday 1 September is the week’s opening conditioning data point, and the number that matters most is not the headline.
The headline is forecast at 55.1, a marginal step down from July’s 55.5, with both readings sitting solidly in expansion territory and pointing to GDP growth above 2%. Rates desks will barely glance at it. The subindex they are watching is prices paid. The prices paid component is projected to tick higher to 71.8 from 71.1 in the prior period.
An upside surprise there would harden resistance to any near-term Fed easing regardless of what headline payrolls show on Friday, because it tells you the goods-side inflation problem has not eased. That is the reading that reprices front-end Treasuries on Tuesday afternoon.
The three subindices to watch, in order of market sensitivity this week:
- Prices paid (consensus 71.8): The inflation signal. An upside surprise raises the bar for a September cut.
- Headline (consensus 55.1): Growth confirmation. Relevant mainly if it drops below 54, which would signal deceleration.
- New orders (projected to increase modestly): The forward-looking growth signal, more relevant for equities and cyclicals than for rates.
Prices paid expected at 71.8, up from 71.1 previously.
If that figure prints above consensus, the week’s Fed narrative begins with inflation pressure, not labour-market weakness, and everything that follows on Thursday and Friday gets interpreted through that frame.
When big ASX news breaks, our subscribers know first
What the RBNZ hike and BoC hold mean in the same session
Wednesday 2 September is the week’s most analytically layered session. Two commodity-linked central banks move in opposite directions on the same day: the RBNZ delivers a near-certain 25 basis point hike to 2.75%, while the BoC holds unanimously at 2.25%. The structural divergence between the two is the story, not either decision in isolation.
For the RBNZ, the hike itself is largely priced. The operative variable is forward guidance. If the statement signals at least one further quarter-point increase by the end of 2026 and avoids introducing pause or data-dependency language, NZD finds support. If the tone softens, the divergence trade weakens before it can fully develop.
The RBNZ rate path beyond September is where the real repricing risk sits: while the 25bp hike to 2.75% is priced above 90% probability, the December 2026 and February 2027 decisions remain genuinely open, and upside inflation is the single variable that could push the terminal rate above the projected 3.30% peak.
For the BoC, the hold is unanimous and unsurprising. A Reuters poll found unanimous economist expectations for the BoC to remain at 2.25% and to keep it there for approximately one year. Markets have only about 16 basis points of additional tightening factored in through to December 2026. The announcement arrives at 9:45 ET, with the press conference at approximately 10:30 ET. CAD positioning is expected to be light ahead of Friday’s paired labour data, so market impact on Wednesday is likely modest.
The BoC rate outlook extends well beyond Wednesday’s hold: TD Securities projects 2.25% through every quarter of 2026, with the first move a hike rather than a cut, arriving no earlier than January 2027, a timeline that reframes CAD positioning as a medium-term structural story rather than a near-term event trade.
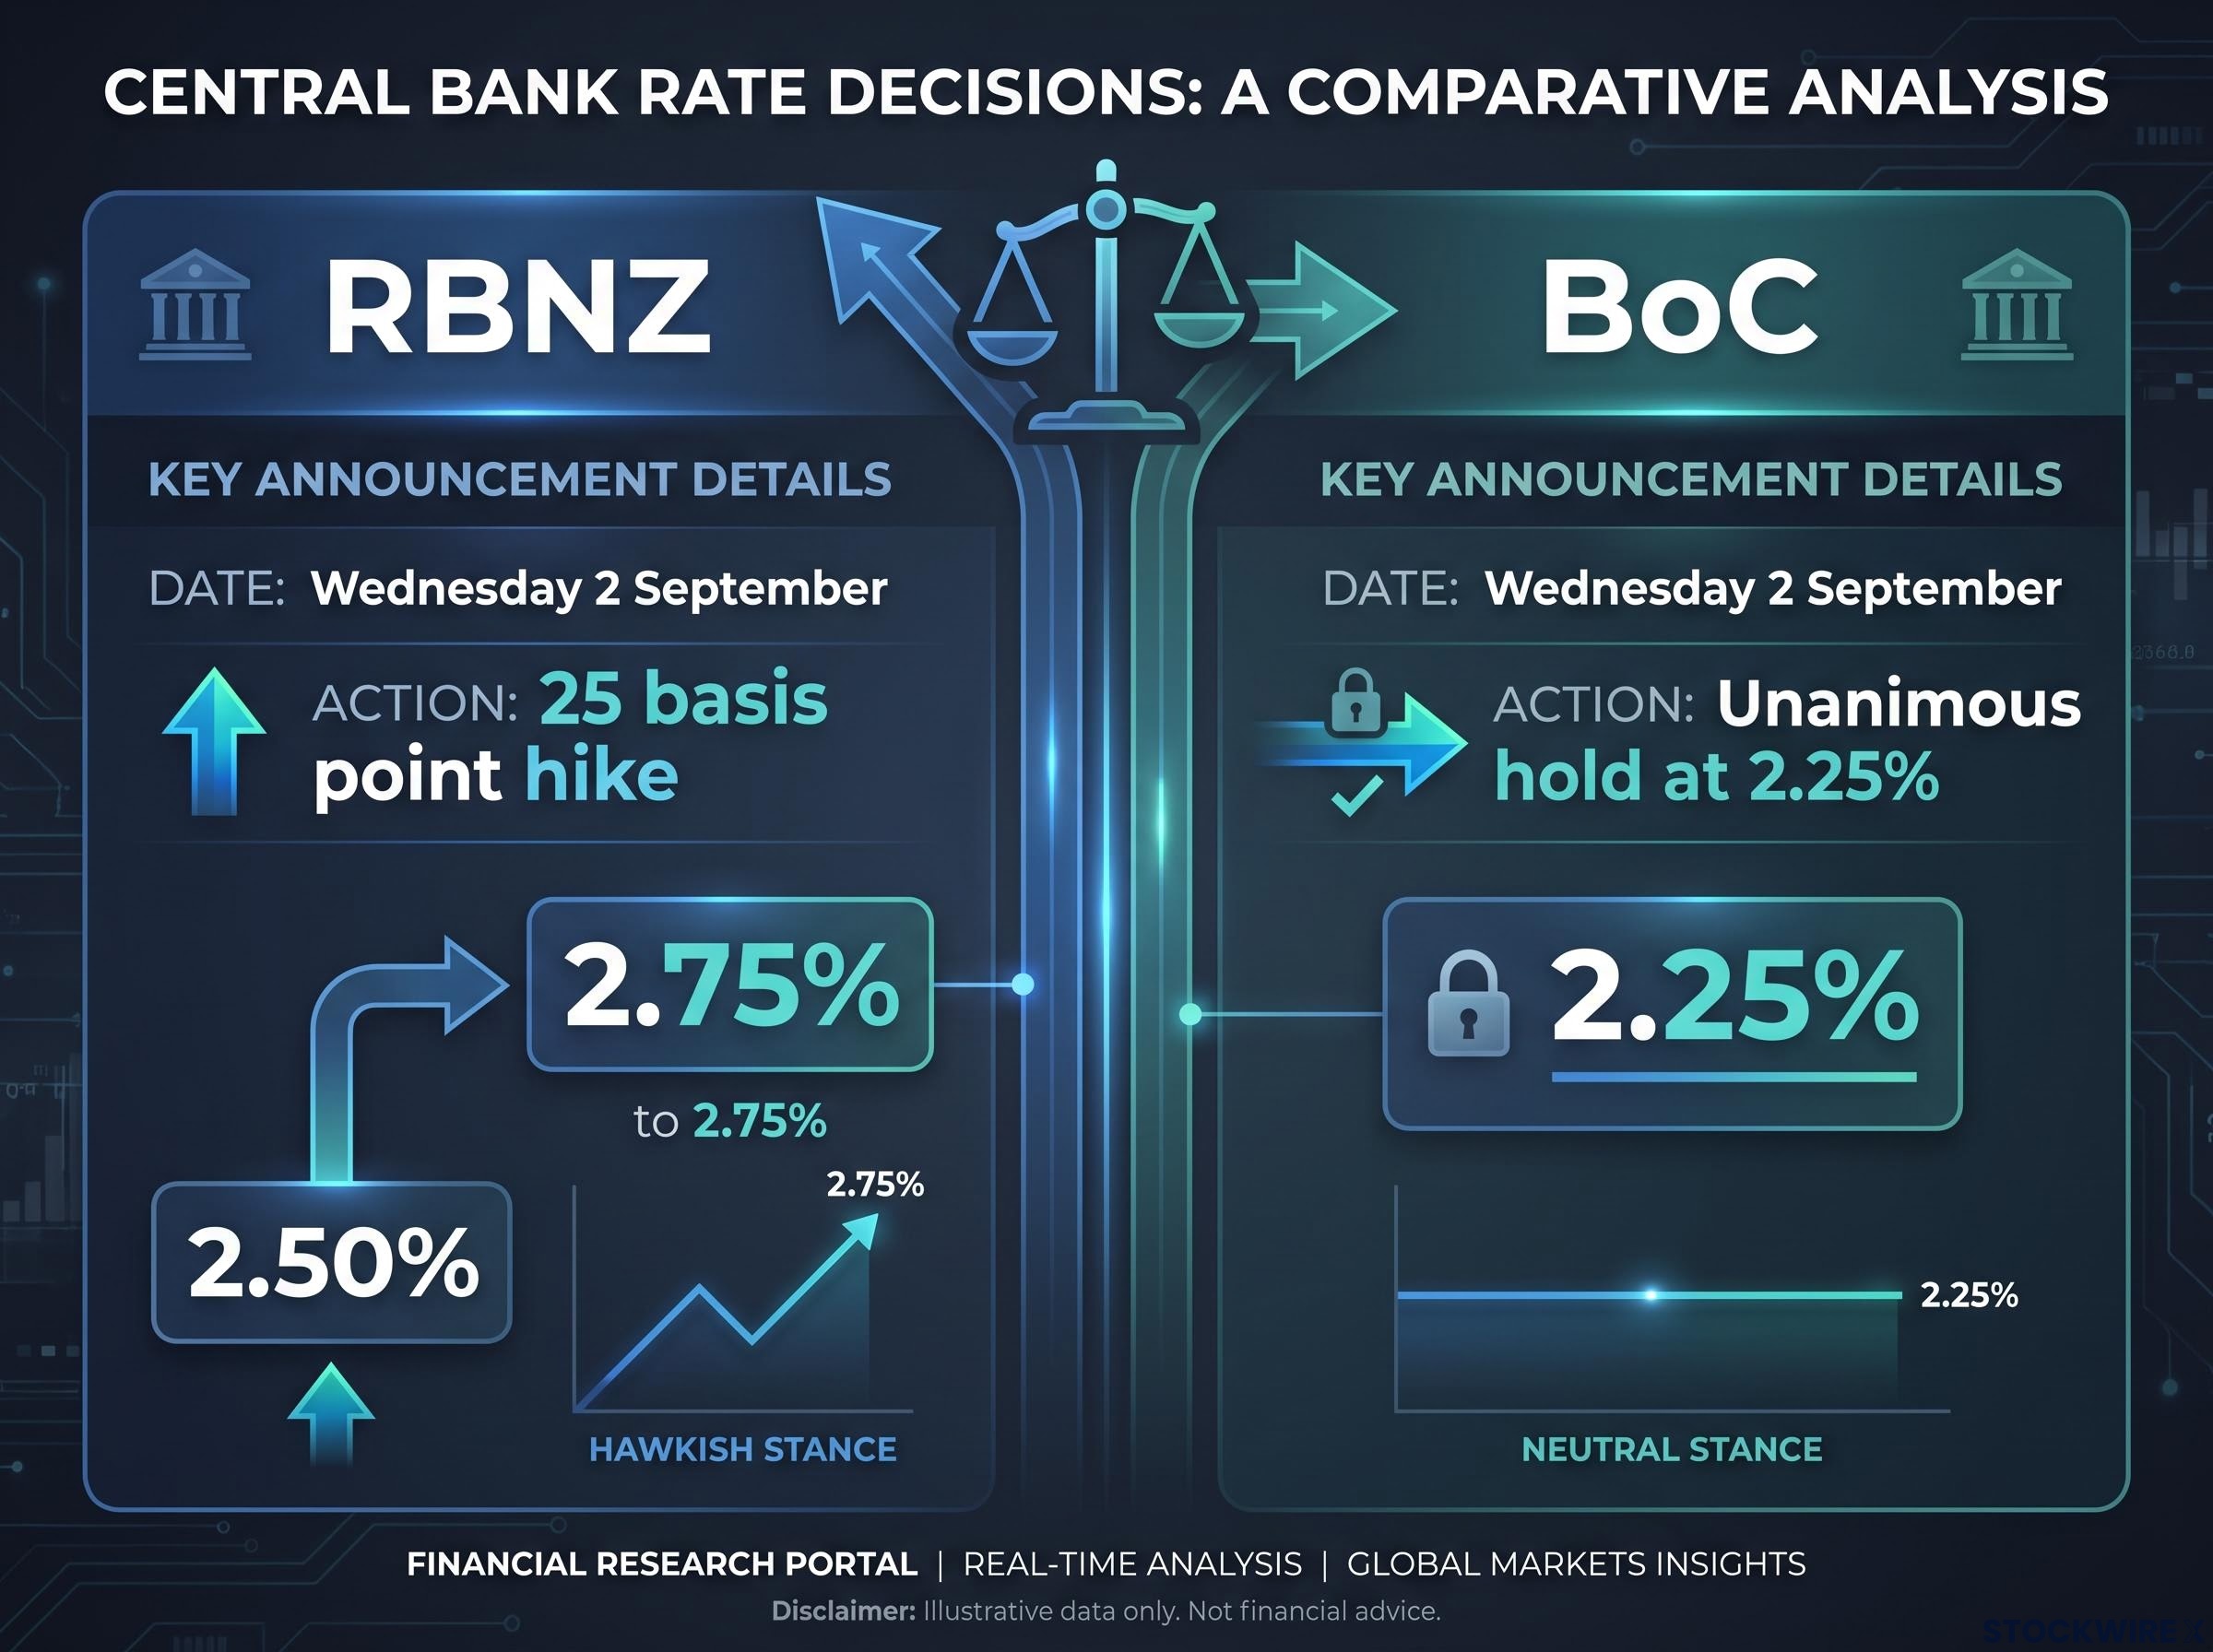
| Central Bank | Current Rate | Decision Expected | Key Forward Signal | Primary FX Impact |
|---|---|---|---|---|
| RBNZ | 2.50% | +25 bp hike to 2.75% | Signal of at least one further hike | NZD strength vs commodity FX |
| BoC | 2.25% | Unanimous hold | Prolonged pause; trade uncertainty | CAD neutral to soft |
NZD/CAD as the week’s structural divergence trade
NZD/CAD captures this divergence more cleanly than either NZD/USD or USD/CAD because it strips out the dollar variable entirely. One central bank is actively hiking with a hawkish bias; the other is on an indefinite hold. The yield-spread logic is straightforward, and it shows up most directly in the cross.
The primary risk: a weak NFP print on Friday could trigger global risk-off that temporarily overwhelms the divergence signal. That makes position sizing and timing around Wednesday versus Friday important. This is a structural theme for the week, not a set-and-forget position.
Why this week’s ISM data matters more than a typical survey week
ISM surveys normally generate a moderate amount of positioning noise and move on. This week, their weight is amplified by proximity to the September Fed meeting and the limited remaining pre-meeting data window. Understanding why requires grasping the conditioning-data concept: how one release changes the market’s sensitivity to the next.
The weight this week’s data carries is amplified by a structural shift in the Fed communication regime: with forward guidance explicitly abandoned under Warsh, each incoming data point now absorbs the full market-moving burden that official rate-path signals previously shared, leaving ISM subindices and payroll figures to do interpretive work they rarely had to do alone.
ISM Services lands on Thursday 3 September with consensus at 54.1, essentially unchanged from the prior period. The July reading came in below analyst forecasts, yet still extended the services sector’s unbroken expansion run to 25 consecutive months. The headline is unlikely to surprise anyone. The employment subindex is another matter.
Services employment is expected to remain below 50, the threshold separating expansion from contraction. A reading below 50 means labour demand in the dominant sector of the US economy is contracting. That is the component most cited by rates and FX desks when framing NFP expectations.
Here is how the conditioning chain works. Tuesday’s ISM Manufacturing prices paid tells you whether inflation pressure is rising on the goods side. Thursday’s ISM Services employment tells you whether labour demand is softening in services. Together, they frame how positioned the market is heading into Friday’s payrolls. If prices paid beats on Tuesday and services employment stays contractionary on Thursday, the market walks into NFP primed for a stagflationary read: inflation sticky, jobs weak.
The two ISM releases side by side:
- ISM Manufacturing (Tuesday 1 September): Headline consensus 55.1. Watch: prices paid (71.8 consensus).
- ISM Services (Thursday 3 September): Headline consensus 54.1. Watch: employment subindex (expected below 50).
Services employment expected to remain below 50 for the period, signalling contractionary labour demand in the dominant sector of the US economy.
Easing services prices would provide a modestly disinflationary counterweight to Tuesday’s manufacturing prices, leaving the inflation narrative mixed heading into Friday. But it is the employment reading that sets the market’s posture for payrolls. An ISM Services employment subindex below 50 on Thursday means the market enters Friday already primed for soft labour demand, which amplifies the price impact of any NFP miss.
The NFP scenario map: what each outcome means for September
The August NFP report arrives at 12:30 UTC / 8:30 ET on Friday 4 September, and it arrives into a market that cannot agree on what to expect.
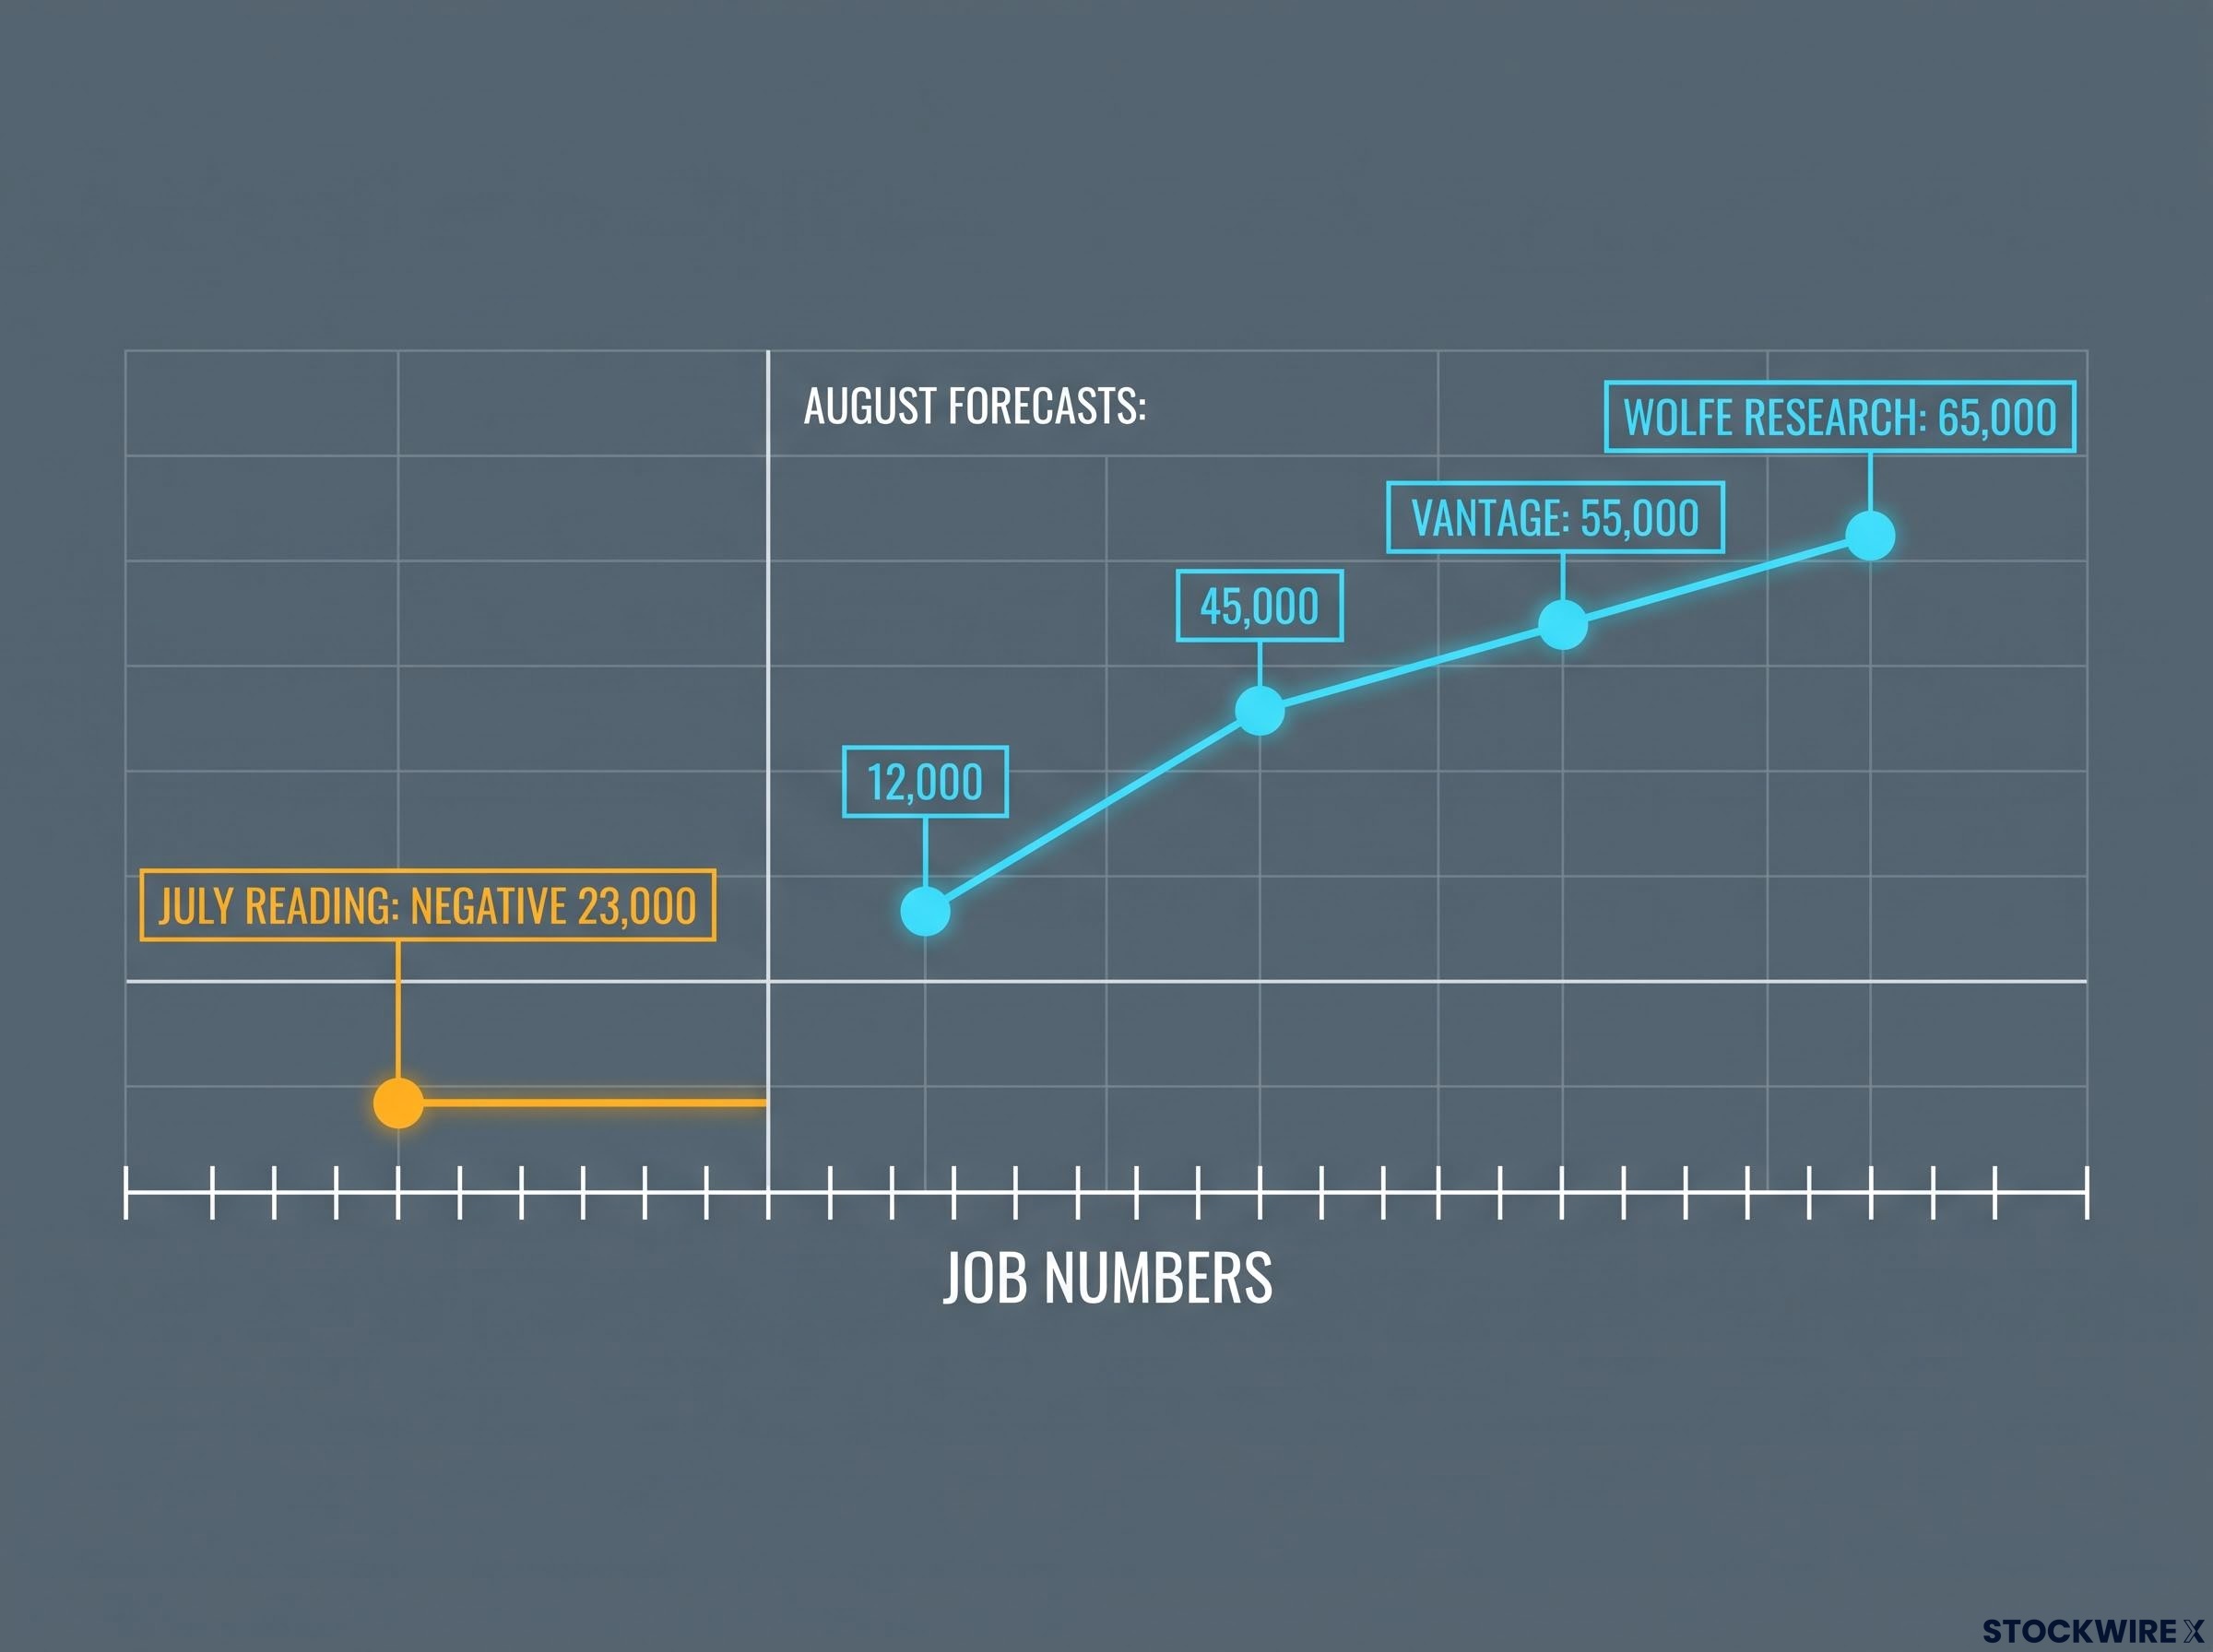
The prior July reading was negative 23,000. The three-month trend remains weak. The combined downward revisions to May and June payrolls totalled 103,000, and that pattern of downward revisions means any adjustment to the July figure is itself a market variable. Jamie Dutta, Market Analyst at Vantage, originally cited the August consensus at 55,000. Current forecasts have since dispersed, with some clustering near 12,000, others near 45,000, and Wolfe Research projecting approximately 65,000. The dispersed consensus is itself the message: professional forecasters cannot agree on even the direction of the labour market, which means the NFP print will move markets more than usual regardless of which scenario materialises.
| Scenario | Approximate Range | USD Direction | Rate Market Reaction | Fed Implication |
|---|---|---|---|---|
| Clear beat | Above ~65,000 with firm wages | Dollar strength | Front-end yields rise; curve steepens | Higher bar for September cut signal |
| In-line print | ~20,000-50,000 | Neutral to slightly weaker | Focus shifts to wages and household survey | Fed stays data-dependent; no forced hand |
| Miss or negative | Below ~10,000 or negative | Dollar weakness | Sharp rally in front-end; curve flattens | Near-term easing expectations revive |
The escalation through those three scenarios captures how the stakes rise. A clear beat is the outcome markets can absorb most easily: growth is confirmed, the Fed can wait, and rate volatility subsides. An in-line print pushes the focus away from the headline and into the composition details, which is where the read gets more ambiguous. A miss or negative number, following July’s negative 23,000, would generate the sharpest moves and revive near-term easing bets almost immediately.
Why wages and revisions matter as much as the headline
Even if the headline lands in the comfortable middle, wages at a forecast of 0.3% month-on-month and 3.2% year-on-year sit uncomfortably above the Fed’s 2% inflation target. The Fed cannot simply ignore a soft headline if wages remain firm; the combination creates a stagflationary signal that complicates the policy calculus.
Revision risk is equally important. Any upward or downward revision to the July negative 23,000 shifts the three-month average that Fed officials watch and can change the labour-market narrative independently of the August headline. Survey-based indicators, including the household measure, are flagging vulnerability on the downside for the August print.
The dispersed consensus across professional forecasters this cycle reflects a broader truth about NFP report internals: the headline jobs number is routinely the least informative figure in the release, with wages, revisions, and sector composition doing the real analytical work.
Composition details, private versus government jobs, full-time versus part-time, can alter the underlying narrative even on an in-line headline. One additional CPI report is scheduled before the mid-September Fed meeting, but this payroll print carries the most weight.
Canadian jobs and the BoC’s medium-term calculus
The Canadian employment report lands simultaneously with US NFP on Friday, and it will almost certainly be overshadowed. CAD trades primarily off the American print on release day, and intraday moves will reflect NFP first and domestic data second. That dynamic means the Canadian numbers matter for different reasons than the ones that move the screen on Friday morning.
Forecasters expect Canada to add 17,500 jobs in August, a sharp pullback from the 75,100 recorded in July. The headline gap looks dramatic, but seasonal softness in August is the primary driver of the lower forecast rather than structural deterioration. The unemployment rate is forecast to hold at 6.4%.
- July employment: +75,100 jobs (strong)
- August consensus: +17,500 jobs (seasonal deceleration)
- Unemployment rate: 6.4% (unchanged)
- Seasonal context: August is typically a weaker month for Canadian employment
The August Canadian employment forecast of 17,500 reflects a pronounced step-down from July’s 75,100 gain, with seasonal hiring patterns responsible for the bulk of that gap rather than any fundamental weakening.
A soft but not disastrous print fits with the BoC’s cautious hold posture. Strong second-quarter 2026 GDP provides a supportive backdrop, and the combination of decent growth with manageable labour-market deceleration supports the case for patience rather than rate action. Trade uncertainty continues to act as a brake on further tightening.
The Bank of Canada Monetary Policy Report from July 2026 identifies the evolution of Canada’s trade relationship with the United States as one of the most significant risks to the inflation outlook, providing the institutional basis for treating trade uncertainty as a structural brake on further BoC tightening rather than a transient consideration.
If Canadian jobs come in soft on Friday while US NFP beats, CAD will likely weaken on the spread even though the Canadian data was predictably seasonal. Understanding that mechanism prevents a misread of the intraday move. The Canadian report matters for where the BoC goes in Q4 2026 and beyond, not for Friday’s price action.
What the full week tells you before markets open Monday
Every release this week feeds into a single question: does the Fed enter its September meeting under market pressure to act, or with enough data ambiguity to remain patient? The answer builds sequentially across five days, not in any single number.
Two distinct analytical threads run simultaneously. The US labour-market/Fed thread connects ISM Manufacturing on Tuesday, ISM Services on Thursday, and NFP on Friday into a single conditioning chain. The RBNZ-BoC divergence thread plays out on Wednesday with NZD/CAD as the live expression. They are structurally independent stories that happen to share the same calendar week.
The three variables to watch most closely:
- ISM Services employment subindex (Thursday): The directional primer for Friday. Below 50 means the market is already positioned for soft labour demand before payrolls hit.
- NFP headline and wage combination (Friday, 12:30 UTC / 8:30 ET): The week’s highest-stakes release. The dispersed consensus amplifies the price impact of any outcome.
- RBNZ forward guidance language (Wednesday): Determines whether the NZD/CAD divergence trade holds or fades before Friday’s risk-off potential.
| Event | Date / Time | Consensus | Prior | Key Variable to Watch |
|---|---|---|---|---|
| ISM Manufacturing | Tue 1 Sep | 55.1 | 55.5 | Prices paid (71.8) |
| RBNZ Decision | Wed 2 Sep | +25 bp | 2.50% | Forward guidance tone |
| BoC Decision | Wed 2 Sep (9:45 ET) | Hold 2.25% | 2.25% | Press conference language |
| ISM Services | Thu 3 Sep | 54.1 | ~54.1 | Employment subindex (below 50) |
| US NFP (Aug) | Fri 4 Sep (12:30 UTC) | Low-to-moderate positive | -23,000 | Headline + wages (3.2% YoY) |
The most uncomfortable scenario for markets is the one where the pieces do not fit neatly together: soft ISM employment plus weak NFP with still-firm wages. That combination would likely express itself through a flatter yield curve, higher rate volatility, and choppy USD trading. One additional CPI report is scheduled before the mid-September Fed meeting, so this week’s data is not the only remaining input, but it is the most heavily weighted.
The reader who tracks all five events through the conditioning chain built across this article will be positioned to interpret each release in context rather than reacting to individual headlines in isolation. That is the difference between watching the data and understanding what it is telling you.
This article is for informational purposes only and should not be considered financial advice. Investors should conduct their own research and consult with financial professionals before making investment decisions.
Financial projections and scenario frameworks presented here are subject to market conditions and various risk factors. Past performance does not guarantee future results.
—