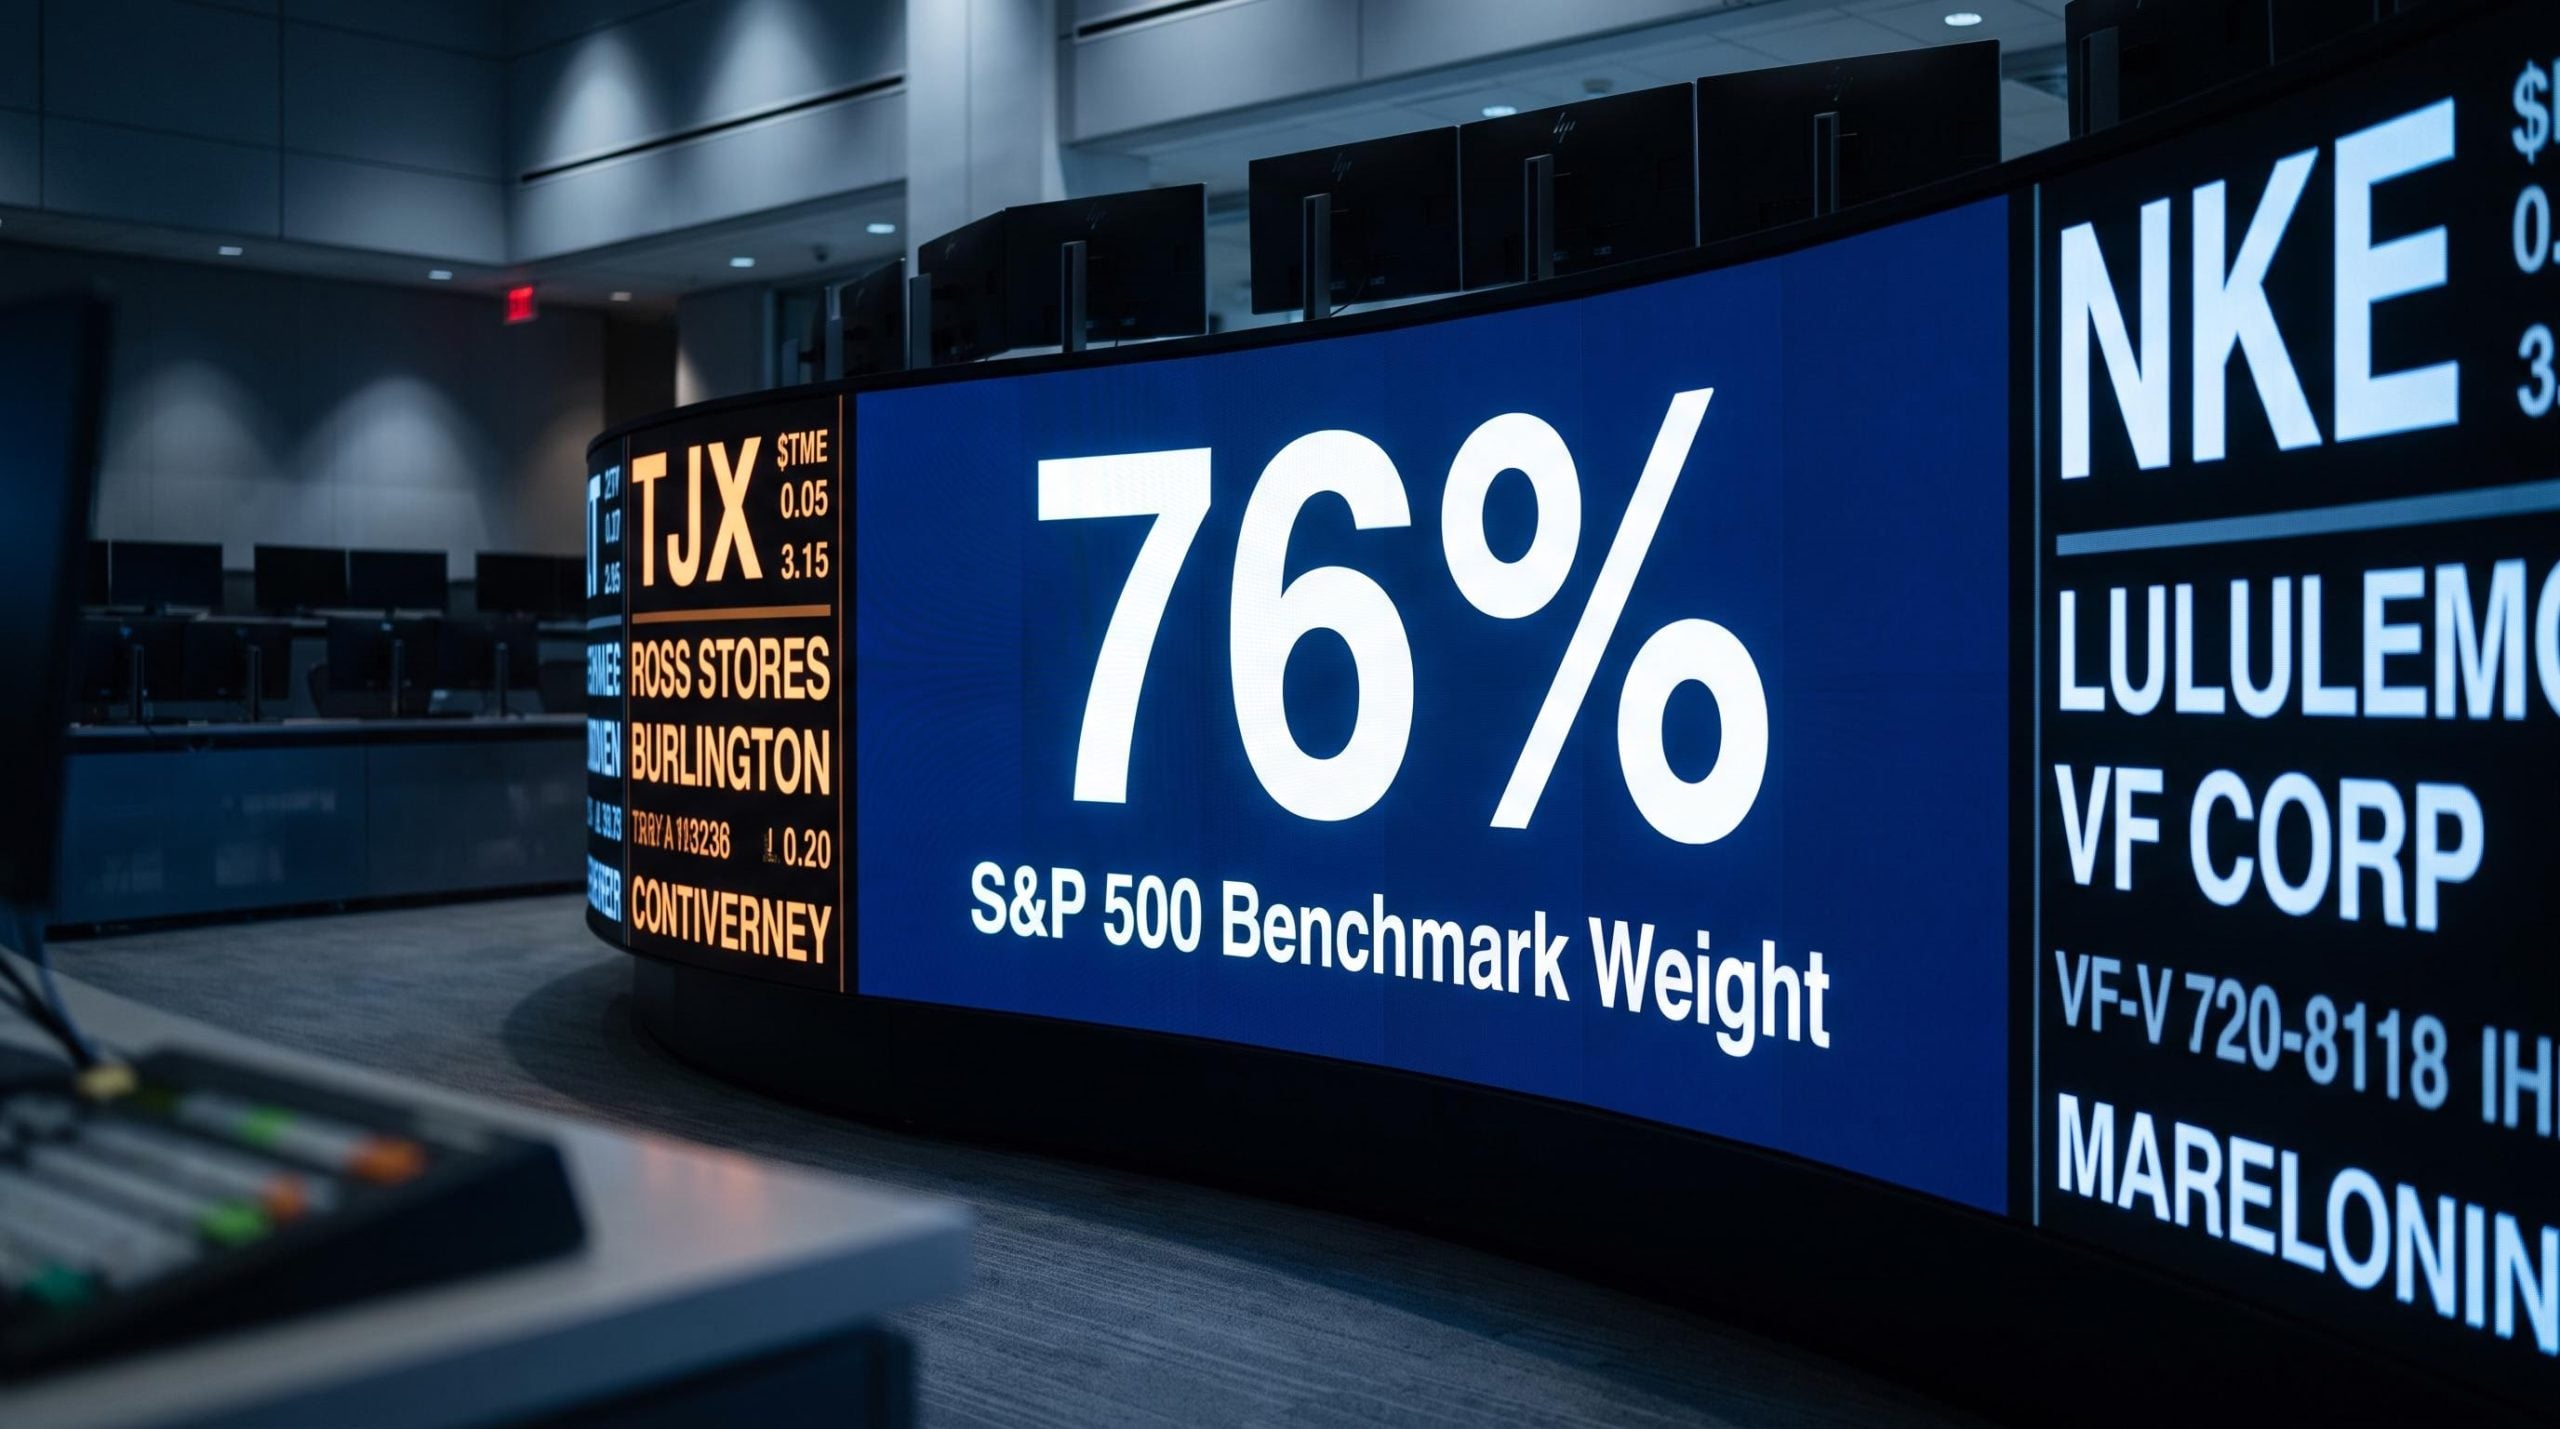
Among the 25 largest S&P 500 mutual funds, softlines equities represent a persistent underweight story, with holdings sitting at just 76% of the sector’s benchmark allocation. That gap has shown no meaningful tendency to close across a three-year window. What looks like a positioning footnote is actually a structural exclusion that has quietly reshaped how institutional capital flows through eight major consumer names, from TJX to Nike to Lululemon.
Fresh data from Evercore ISI, published in August 2026, provides one of the most granular reads available on how the largest active managers are positioned across a specific sector. For equity investors who hold or are evaluating any of these eight companies, the flow and benchmark mechanics sitting beneath the stock prices are as important as the earnings narrative sitting above them.
Here is what sustained institutional underweighting actually means in practice, why it has persisted in softlines specifically, and what conditions would need to change before that positioning normalises. The data tells a more precise story than the price charts do.
Three years of soft signals: what the Evercore ISI data actually shows
The headline number is stark enough on its own.
The 25 largest S&P 500 mutual funds held softlines at approximately 76% of the sector’s benchmark weight as of June 2026, essentially unchanged over the prior quarter. (Evercore ISI)
That is not a one-quarter dislocation. It is three years of the largest pools of active U.S. equity capital choosing, quarter after quarter, to hold meaningfully less softlines exposure than the index demands.
The breadth makes the signal harder to dismiss. Across the eight softlines names that Evercore ISI covers within the S&P 500, the largest mutual funds carried positions below index weight in six of them. Those six span off-price retail, premium activewear, beauty, and luxury business models. This is not a single-company call.
The individual positioning data sharpens the picture:
| Company | Segment | Ownership (% of index weight) |
|---|---|---|
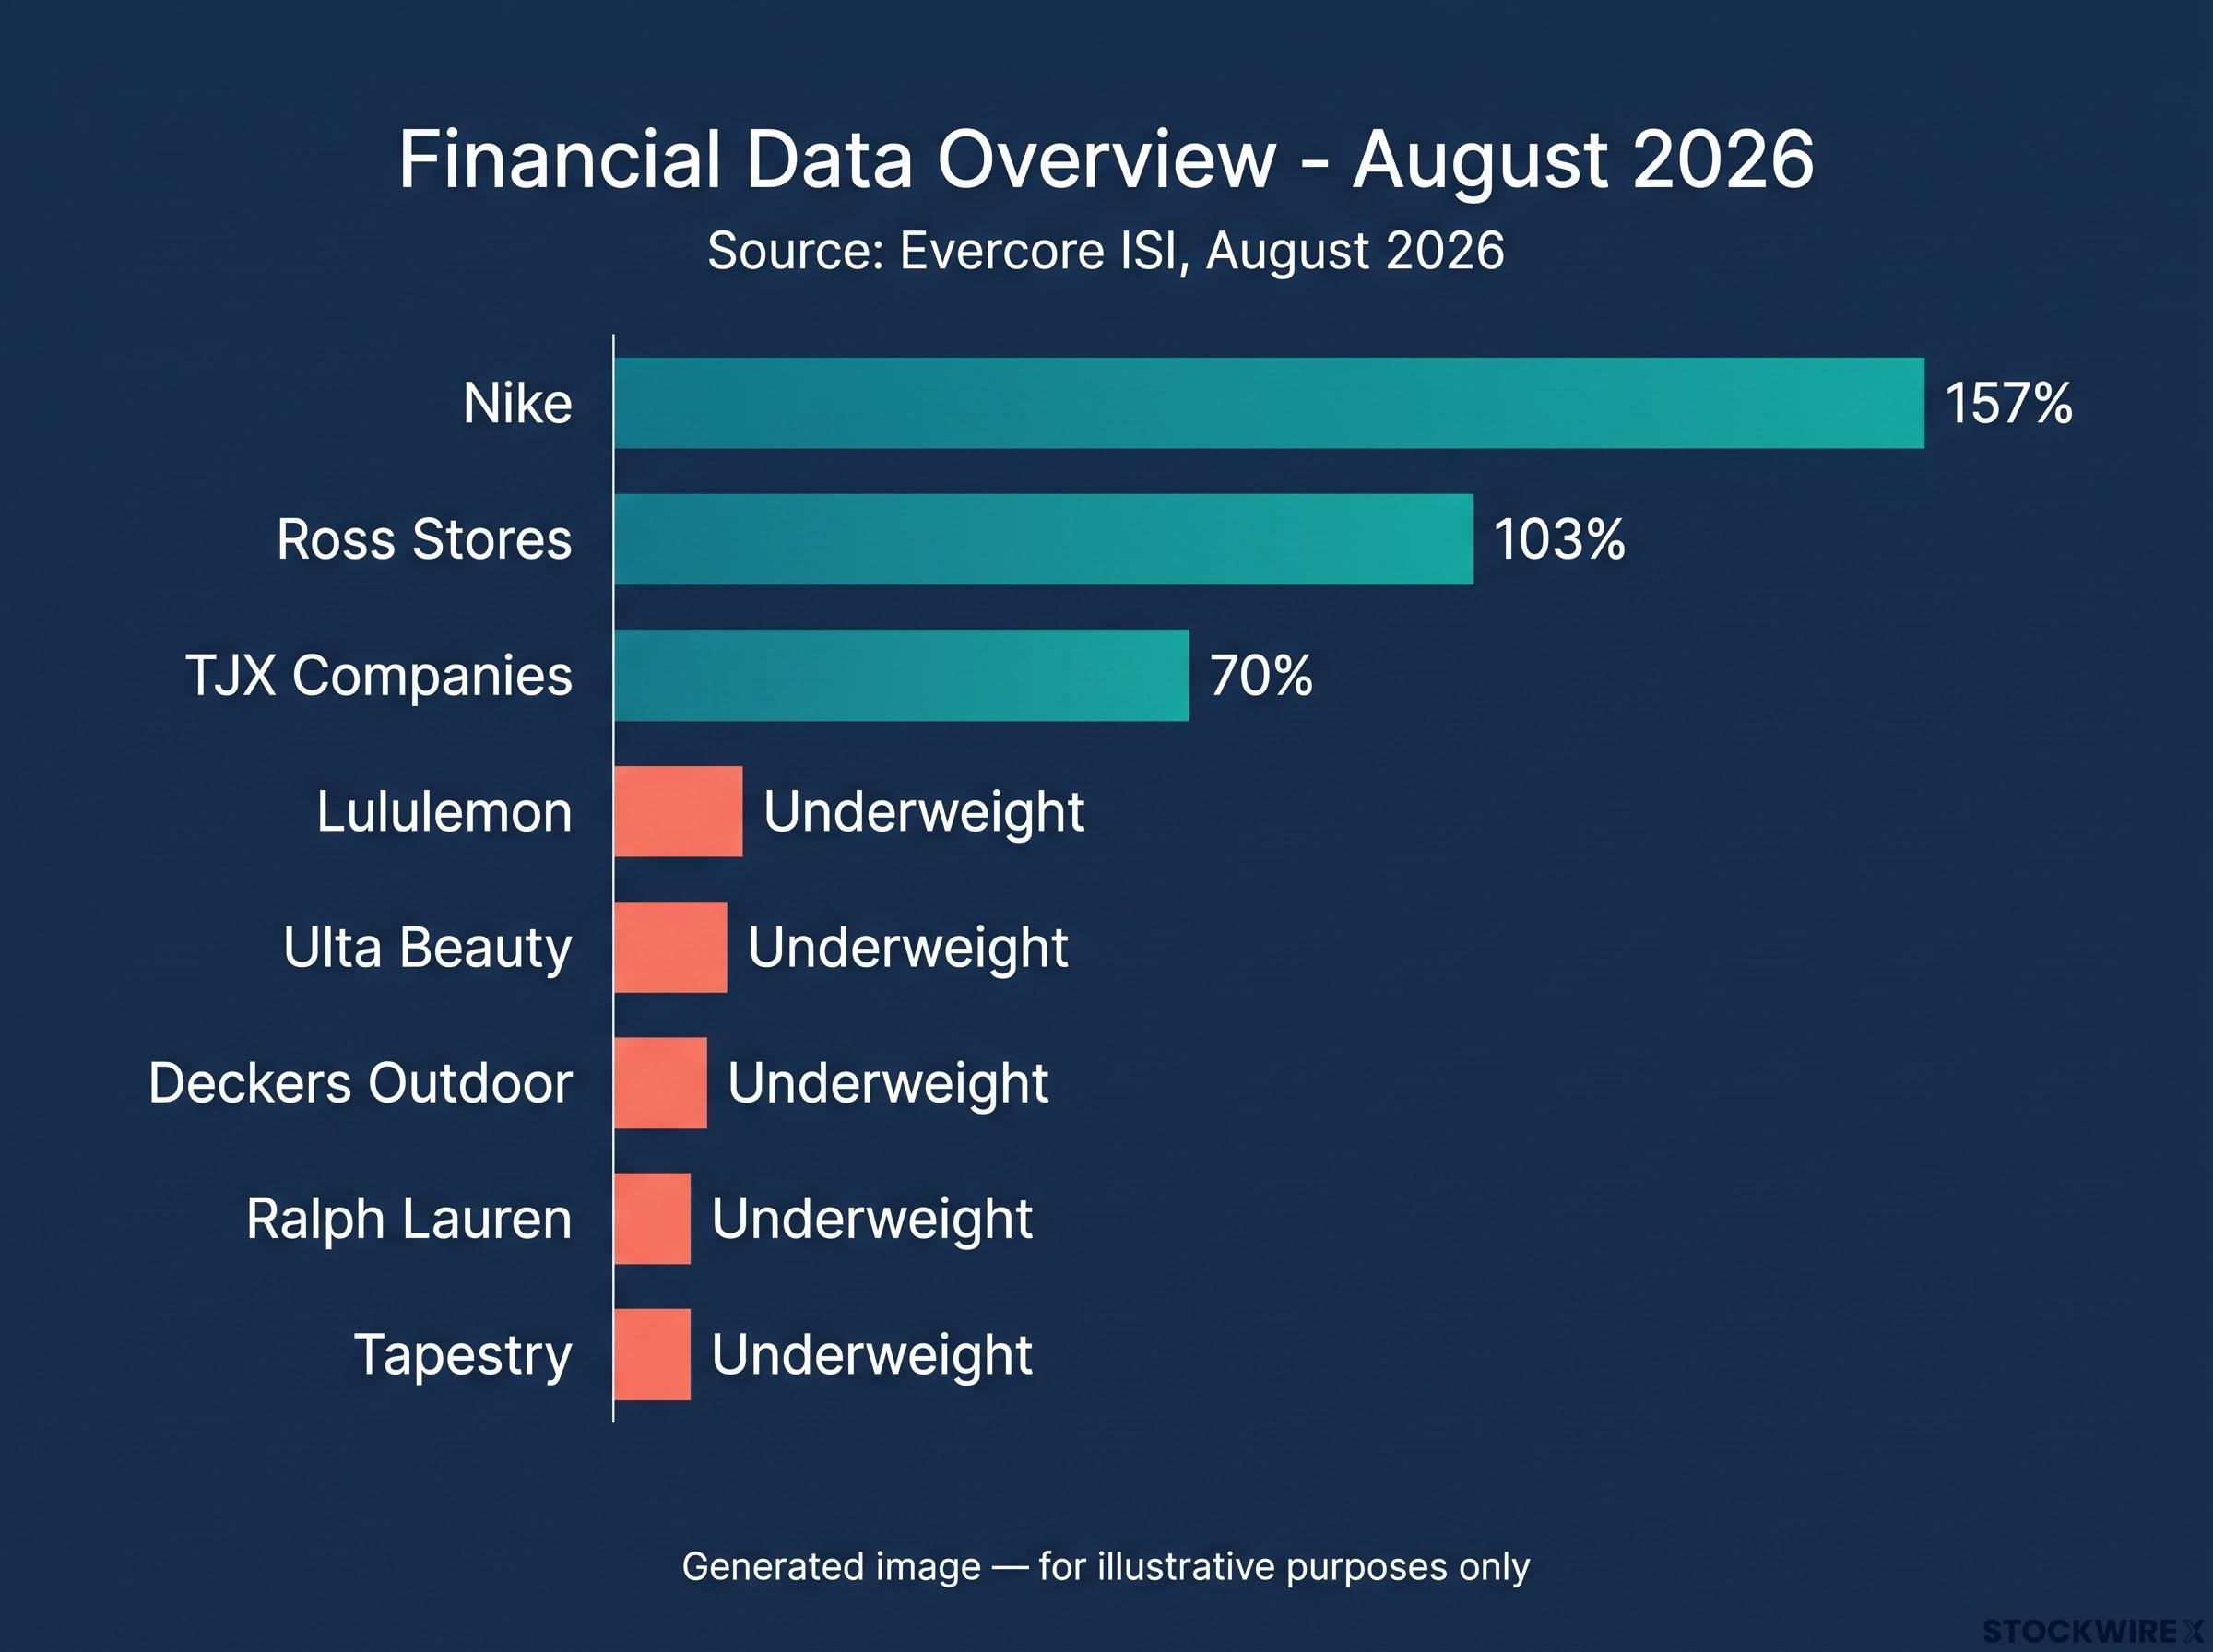
| Nike | Global athletic brand | 157% |
| Ross Stores | Off-price retail | 103% |
| TJX Companies | Off-price retail | 70% |
| Lululemon | Premium activewear | Underweight |
| Ulta Beauty | Beauty specialty retail | Underweight |
| Deckers Outdoor | Lifestyle | Underweight |
| Ralph Lauren | Luxury / lifestyle | Underweight |
| Tapestry | Luxury / accessories | Underweight |
Nike at 157% is the clear outlier: the one name where large funds have actively overweighted. Ross Stores sits roughly at parity. TJX, despite being the largest off-price retailer in the world, is held at just 70% of its index weight. The breadth of the underweight across such varied business models tells you this is a categorical sector judgement by institutional managers, not a stock-by-stock assessment of individual company merit.
The index weight erosion compounding the problem
Measured against where the sector stood three years ago, softlines’ slice of the S&P 500 has contracted by roughly 25 basis points in total. The decline accelerated recently, with approximately 14 basis points of that erosion occurring in Q2 2026 alone, between March and June.
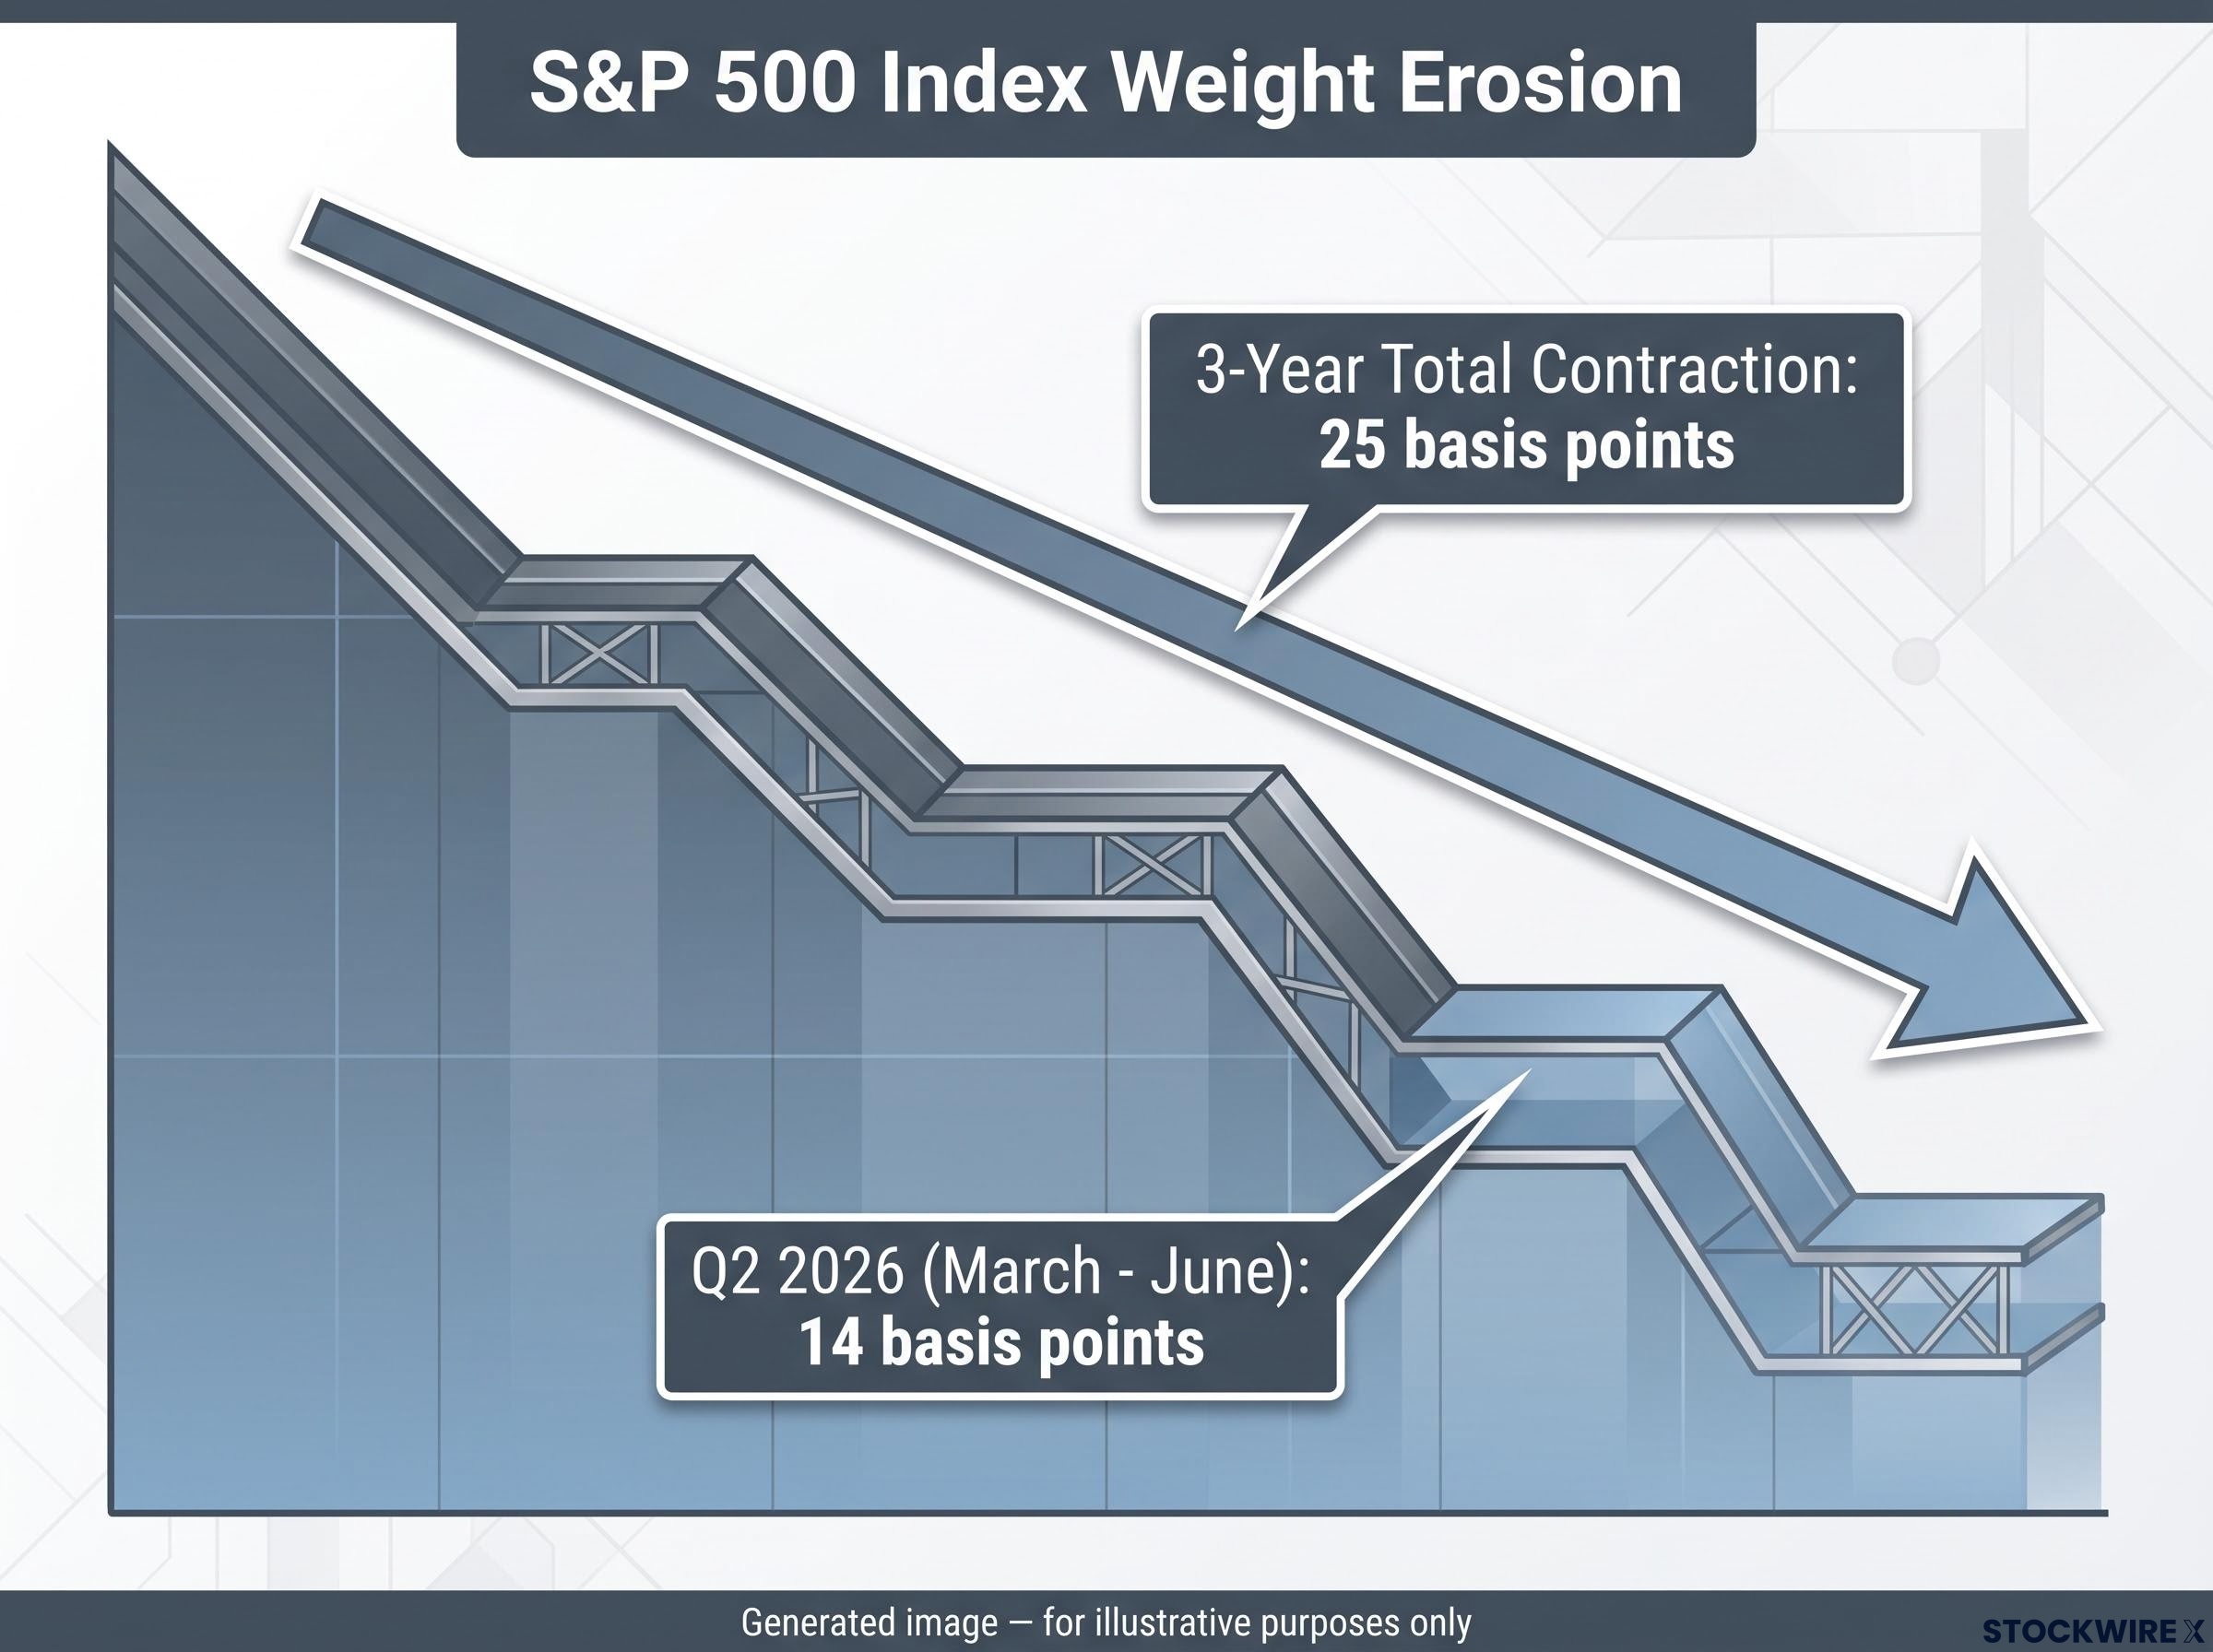
This weight erosion is not just a symptom of underperformance. It is a mechanical force. As the sector’s benchmark slice shrinks, even a market-weight position represents fewer actual dollars of exposure. The index itself is quietly telling passive capital to own less softlines, and every quarter the drift continues, the bar for attracting fresh institutional interest rises.
When big ASX news breaks, our subscribers know first
Why the rotation out of softlines has been structural, not tactical
The dominant force behind three years of institutional underweighting is not softlines-specific scepticism alone. It is where the capital went instead.
Multi-year institutional rotation into large-cap technology and AI has been the primary funding mechanism. As mega-cap tech companies appreciated, their S&P 500 index weights rose. Benchmark-aware managers, those who manage tracking error tightly and measure relative performance quarterly, were effectively compelled to overweight them. That overweight had to be funded from somewhere.
S&P 500 concentration risk is the structural backdrop that made softlines a natural funding source: as technology’s index weight surged to absorb roughly 85% of the index’s 2026 gains, benchmark-aware managers faced a binary choice between tracking error and underweighting everything else.
Softlines became a natural funding source because the sector sits at the intersection of four distinct headwinds:
- Consumer cycle sensitivity: employment, wages, confidence, and savings rates all flow directly through softlines demand
- E-commerce and omnichannel competition: margin and market share pressure from digital-first competitors
- Input cost and promotional margin pressure: inventory missteps, freight costs, and promotional intensity compress earnings predictably in downturns
- Fashion and brand risk: consumer preference shifts can de-rate multiples quickly, adding a layer of idiosyncratic risk that benchmark managers prefer to avoid
Against a clear “AI infrastructure and software” narrative, the softlines story is messier and more execution-dependent. In a world where relative performance to the benchmark is constantly measured, managers have had a straightforward choice: own more of the secular tech winners and less of complex, cyclical softlines. The fact that six of eight tracked names are underweight confirms this is a sector-thesis call, not stock-specific scepticism.
The self-reinforcing weight erosion loop
What makes this structural rather than tactical is the feedback loop that locks the underweight in place.
It works in three steps. Softlines underperform, and their market capitalisations lag, which shrinks their S&P 500 weight. A smaller index weight means the sector consumes less risk budget and less mindshare for portfolio managers who are already underweight. Reduced attention and smaller active positions further dampen price support, making it harder for the group to regain lost benchmark share.
This is not a situation that self-corrects with time. The feedback loop between index weight erosion and institutional underweighting means a reversal requires a catalyst, not just patience. Every quarter the loop runs, the structural exclusion deepens.
What it means in practice when a sector is structurally under-owned
Understanding why softlines are underweight is half the picture. The other half is what that absence of a full institutional buyer base actually feels like in real market behaviour.
Current headwinds from the underowned configuration
A sector held at 76% of benchmark weight by the largest mutual funds faces a specific set of mechanical disadvantages.
The buyer base is thinner. When a softlines name reports a strong quarter or issues an upward revision, the population of large-scale institutional holders who would normally add on strength is smaller than it would be for a fully-owned sector. Price response to positive fundamental news is slower and less decisive.
At the same time, shrinking index weights trigger passive outflows. As the S&P 500 benchmark weight of softlines falls, passive vehicles tied to the index or to the consumer discretionary slice automatically reduce dollar exposure, regardless of whether the underlying companies are performing well. That is a mechanical headwind that operates independently of fundamentals.
The combination makes the sector more vulnerable to de-rating when macro data softens. With fewer committed holders and weaker passive support, negative surprises hit harder.
The latent tailwind in a positioning normalisation
The same underweighting that has been a headwind is also the source of the sector’s most compelling optionality.
If the 25 largest mutual funds simply moved from 76% of benchmark weight toward 90-100%, that would imply a substantial increase in dollar demand across a group of large, liquid S&P 500 components. Even modest percentage-point shifts in institutional weights translate into significant flows when spread across names like Nike, TJX, and Lululemon.
Positioning inflection points can be powerful catalysts entirely independent of earnings changes. The normalisation trade, where flows drive price before fundamentals confirm the move, is one of the most well-documented patterns in institutional equity markets.
On valuation: UBS data (not independently confirmed) suggests softlines now trade at approximately a 21% price-to-earnings (P/E) discount to the S&P 500, compared with a long-run historical pattern of roughly a 15% premium. Even directionally, that reversal from structural premium to structural discount is significant context for the positioning discussion.
Consumer discretionary valuation context sharpens the asymmetry argument: with the Consumer Discretionary index ratio to the S&P 500 at a 20-year low through July 2026, spending data across clothing and leisure categories remains above baseline, a divergence that reinforces the case that institutional pessimism has overshot the fundamental reality.
What this means for anyone evaluating names in this group is that the risk-reward calculus is asymmetric. The underowned configuration creates outsized upside on positive surprises but also sharper drawdowns when macro or company-specific data disappoints. Knowing which side of that asymmetry is more likely requires watching the catalysts.
What would have to change for institutional positioning to normalise
Rather than a bullish call, what follows is a framework. Four plausible catalysts could push institutions to close their softlines underweights, presented in order from most to least market-driven:
- Tech and AI de-rating or consolidation. If the narrow group of mega-cap tech winners experiences a valuation reset or a period of sideways consolidation, risk budget currently locked in technology would free up for redeployment into other sectors. Softlines, already cheap on a historical basis, would be a natural beneficiary.
- Index weight recovery. A period of softlines outperformance, even modest, would begin to restore some of the 25 basis points of benchmark share lost over three years. Rising index weights force passive vehicles to buy and make it harder for active managers to stay underweight without taking on tracking error.
- Clear evidence of margin resilience or expansion. Better inventory control, mix shifts toward higher-margin categories, or improved pricing power across apparel, footwear, and specialty retail would directly address the margin scepticism that has kept institutional money away.
- A durable consumer spending recovery. Sustained strength in discretionary categories would drive earnings beats and upward estimate revisions across the group, giving benchmark-aware managers fundamental cover to rebuild positions.
None of these is guaranteed. Some depend on macro conditions entirely outside the sector’s control. But the framework gives you something to monitor beyond price action.
For investors wanting to stress-test the catalyst framework against institutional forecasts, our dedicated guide to JPMorgan’s consumer recovery thesis covers the specific macro triggers, including oil price declines, tariff easing, and sentiment floor signals, that JPMorgan identified as the conditions for sector re-rating in H2 2026.
Connecting the catalysts to the individual names
The catalyst framework applies differently across the eight tracked companies. Off-price names like TJX and Ross Stores are already closer to benchmark weight, meaning the normalisation trade is smaller but the fundamental case (margin resilience in a weak consumer environment) is the most straightforward to make. Nike, already at 157% of index weight, is a different story entirely; it is already overowned and would benefit primarily from broad sector re-rating rather than a positioning catch-up.
The names where the catalyst framework matters most are those that are both underweight and fundamentally pressured: Lululemon and Tapestry in particular. For those stocks, a margin improvement story arriving in a world where institutions hold just 76% of benchmark weight looks very different than the same story would if funds were already at 95-100%. The positioning context changes the magnitude of the potential move.
Reading institutional positioning as a signal, not just a scoreboard
Three years of sustained underweighting have produced a setup that operates on two frequencies simultaneously. On one frequency, it is a headwind: a thin buyer base, passive outflows as index weights erode, and a valuation discount relative to the sector’s own history. On the other, it is a latent source of significant upside, because moving from 76% toward benchmark weight implies material dollar inflows across a group of large, liquid names.
The Evercore ISI data is the kind of fund flow intelligence typically available only to institutional investors. Retail equity investors who understand how to read it, who know what 76% of benchmark weight means mechanically and what the six-of-eight breadth signal implies about sector-level consensus, occupy a genuine informational edge.
The question the data equips you to answer is personal: given the positioning, the catalysts, and the valuations, where does softlines fit in a portfolio that may already be overexposed to tech and AI? That is not a question the price chart can answer. It is a question that positioning data, read properly, can.
For readers wanting the macro context behind institutional capital behaviour in 2026, our full explainer on 2026 global equity fund flows examines how the Federal Reserve pause and dual deployment out of cash into both equities and bonds is reshaping where active managers can afford to take sector-level risk.
This article is for informational purposes only and should not be considered financial advice. Investors should conduct their own research and consult with financial professionals before making investment decisions. Past performance does not guarantee future results. Financial projections are subject to market conditions and various risk factors.