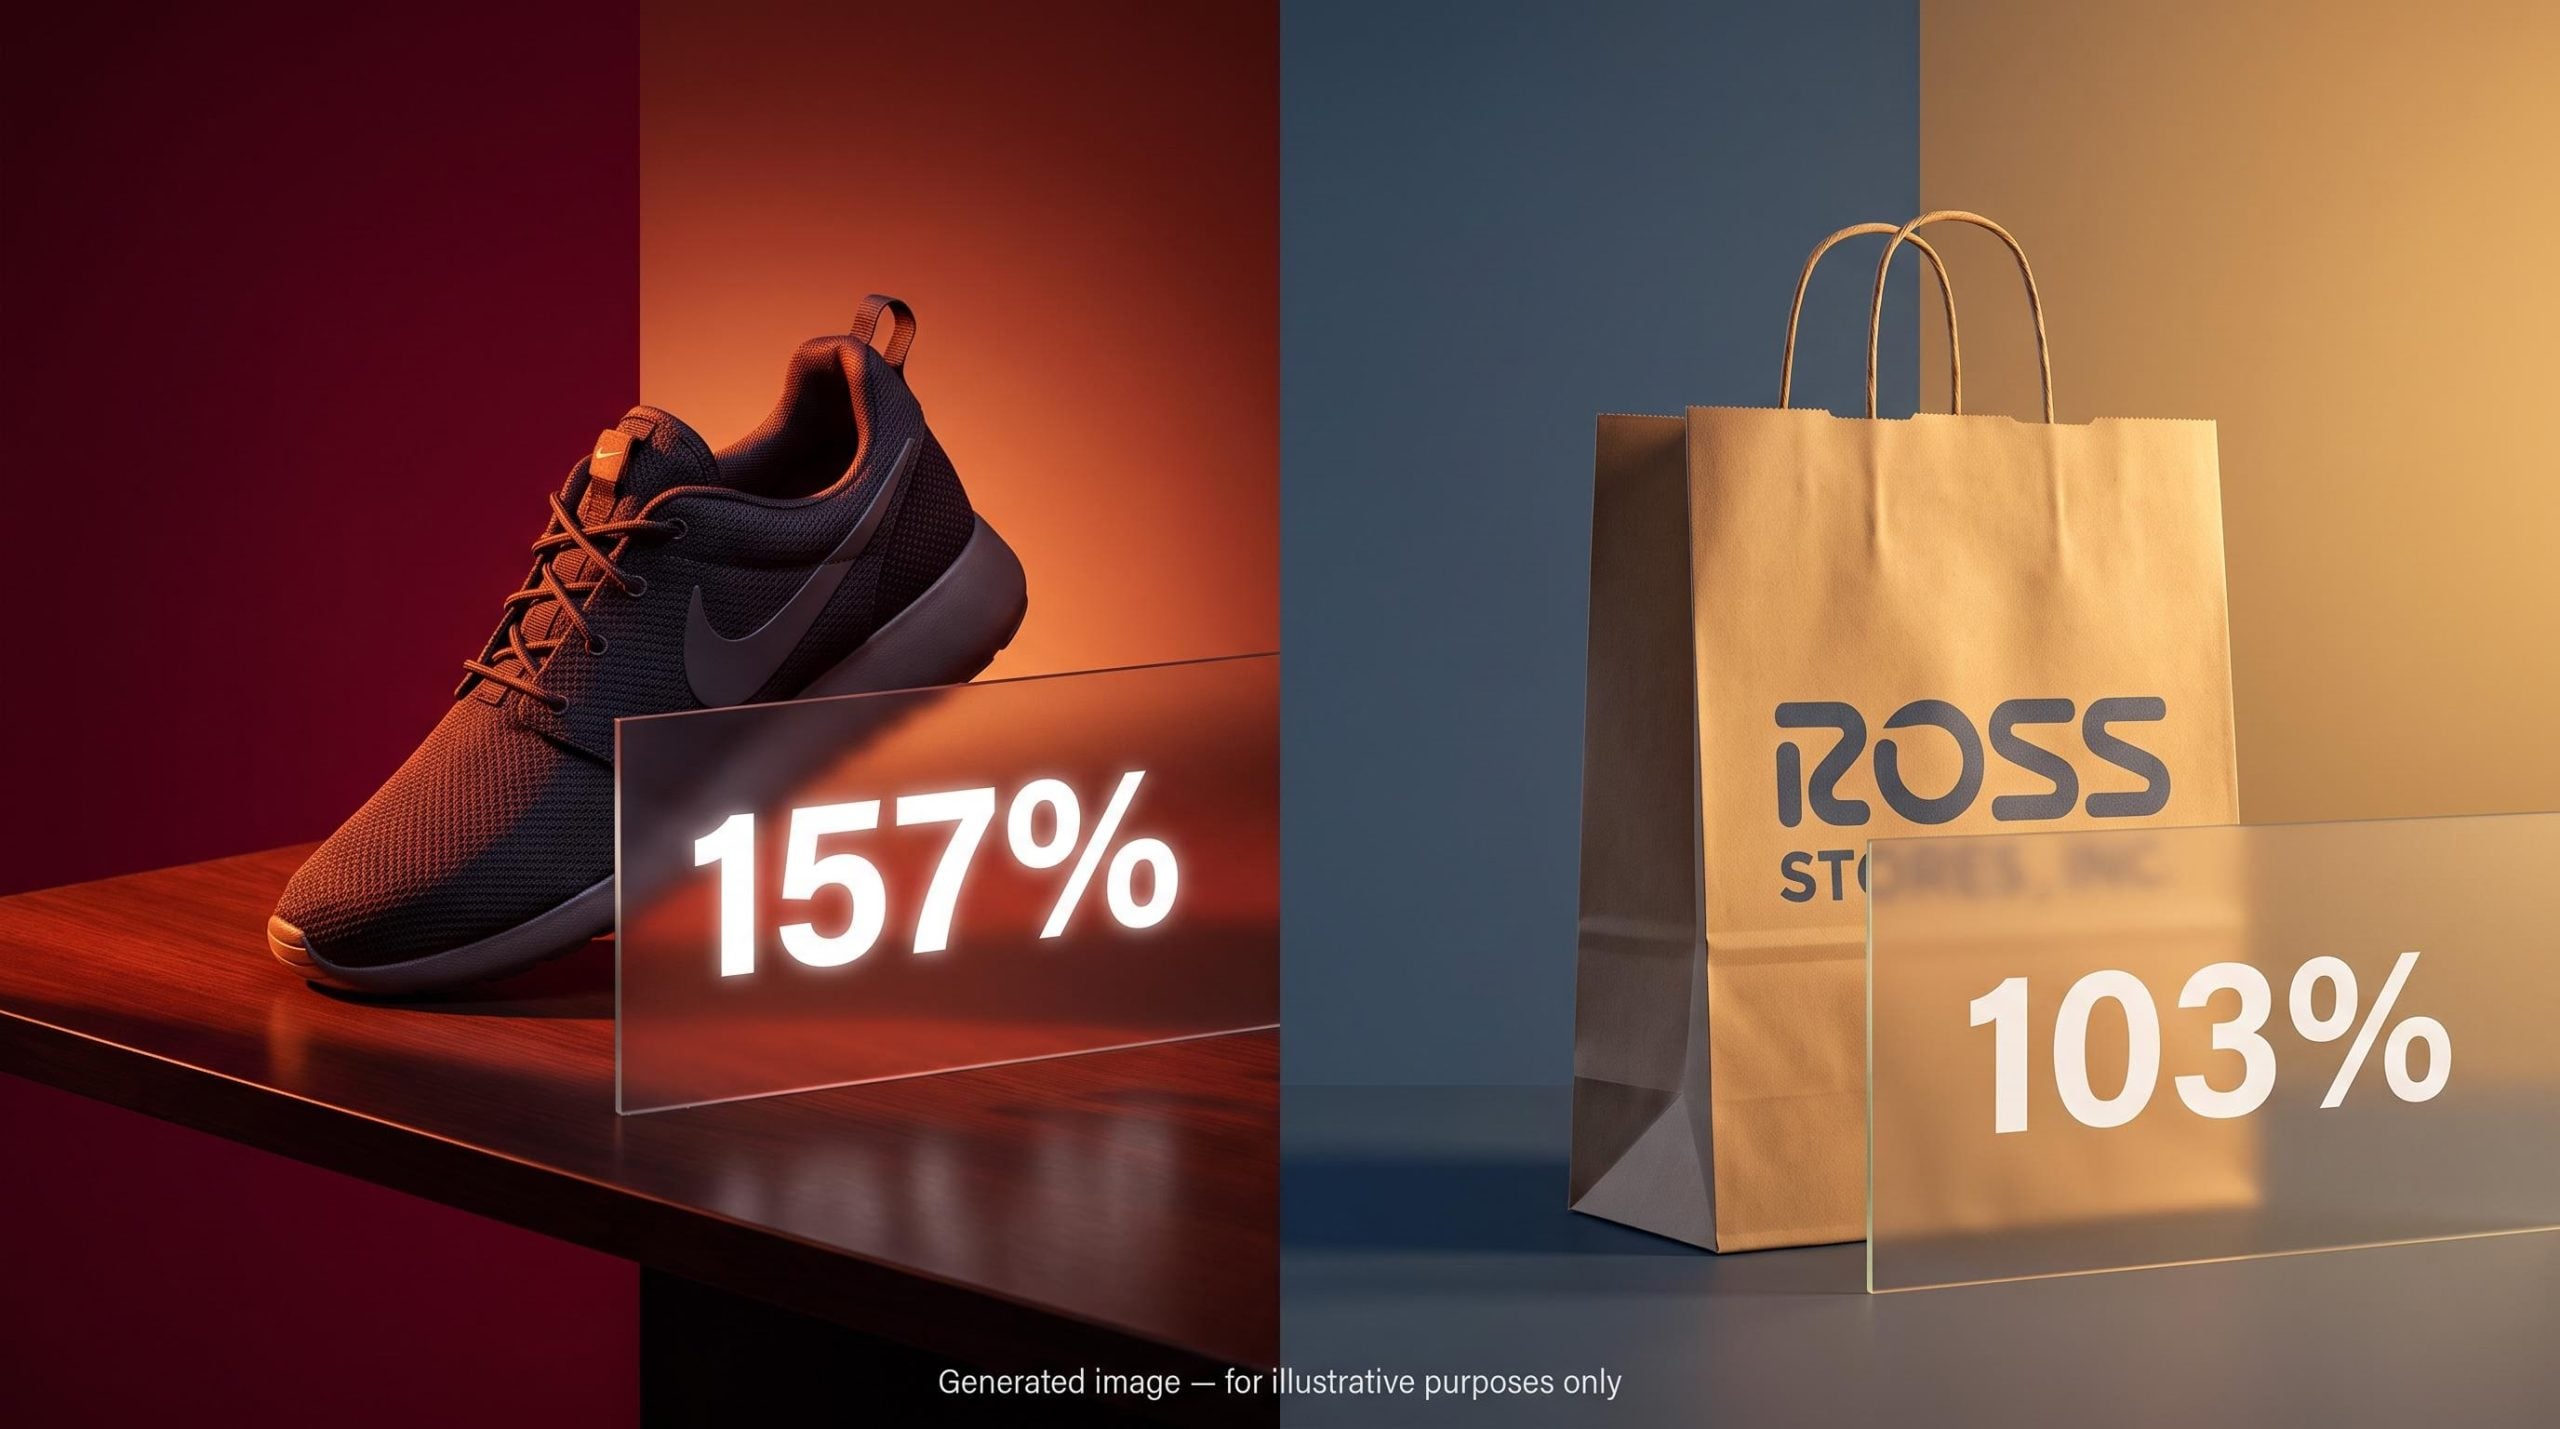
Among the Evercore ISI-tracked softlines names, Nike carries the heaviest institutional overweight, with large mutual funds positioned at 157% of its S&P 500 benchmark weighting, a reading that places it firmly at the top of the crowding risk spectrum. Ross Stores has attracted active fund interest of its own, sitting at 103% of benchmark weight and standing clearly ahead of its nearest peer on that measure. These two numbers tell very different stories about where the risk actually lives.
Institutional ownership relative to benchmark weight is one of the more underused signals in equity analysis. When large funds are crowded into a stock well above their index exposure, any disappointment does not just move the stock; it forces portfolio-wide adjustments across funds with similar positioning. The Evercore ISI softlines data, current as of end of June 2026, provides a clean, quantified illustration of both dynamics playing out simultaneously in the consumer discretionary sector.
Here is the framework for reading benchmark-relative ownership data, and how it applies directly to the Ross Stores and Nike positioning trade-off heading into H2 2026 results season. The goal is not just what the numbers show, but what to do with them.
What benchmark-relative ownership actually measures, and why it matters
Two metrics sound similar but measure fundamentally different things when it comes to institutional positioning:
- Total institutional ownership: The percentage of a company’s shares held by institutions. It tells you how widely sponsored a stock is but says nothing about whether those institutions are making an active bet.
- Benchmark-relative ownership: How much a fund holds in a stock versus that stock’s weight in its benchmark index. This is the figure that captures active conviction, because it reveals whether managers are deliberately overweighting or underweighting the name.
The distinction matters because of how the crowding mechanism works. When many funds are overweight the same stock, a fundamental miss does not simply reprice the equity. It triggers simultaneous portfolio rebalancing across similarly positioned managers, each selling into the same pressure. The exits compound.
Positioning extremes in individual stocks follow the same mechanical logic as those Citi documented across global indices in its June 2026 audit: crowded longs with embedded profits provide no cushion when sentiment shifts, and the exits compound in ways that purely fundamental models do not capture.
Of the eight softlines companies that Evercore ISI tracks within the S&P 500, large mutual funds sit above benchmark weight in just one: Nike, and by a considerable distance.
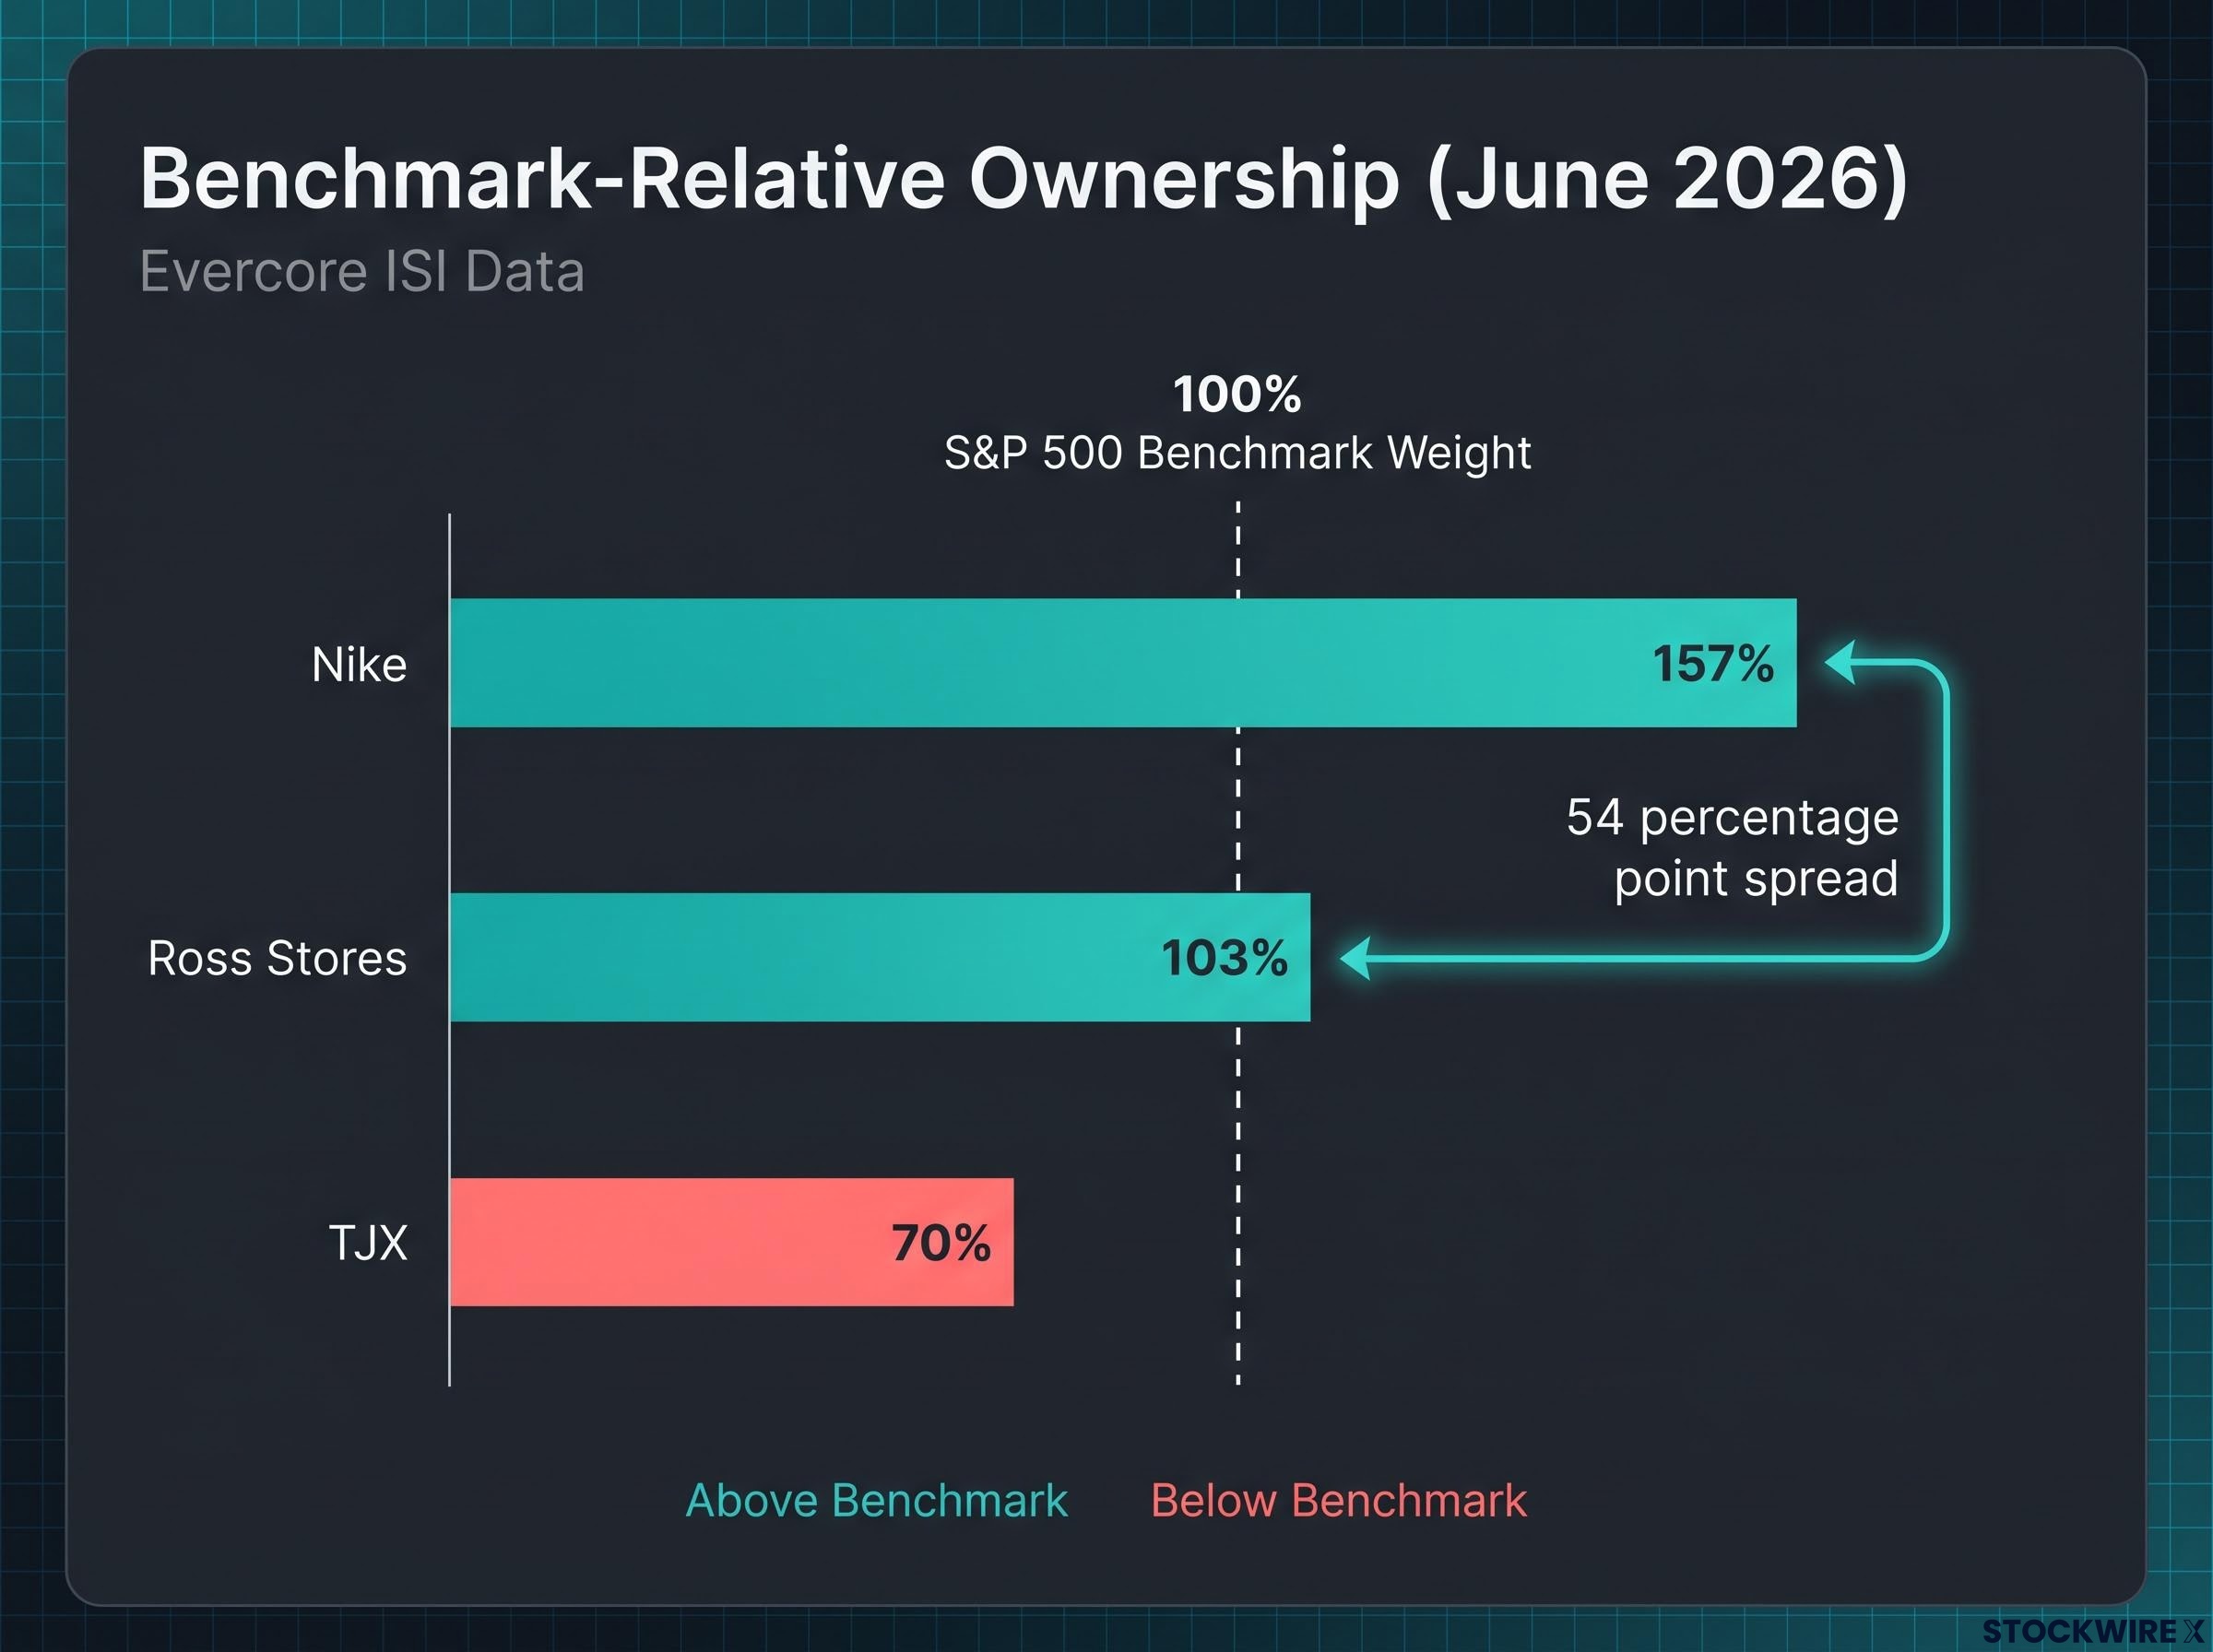
Benchmark-relative ownership is a two-sided signal. A modest overweight, like Ross at 103%, indicates room for incremental buying if a catalyst lands. A large overweight, like Nike at 157%, indicates the stock already embeds significant optimism and has fewer incremental buyers left. The 54 percentage point spread between those two figures is the core risk differential. If you are sizing both positions at the same dollar amount, you are taking on materially different crowding exposure, and the benchmark-relative data is the metric that makes that asymmetry visible.
Note that total institutional ownership figures (approximately 87% for Ross and 80% for Nike) are sometimes cited, but these headline numbers do not capture the active positioning story. The benchmark-relative figure is the analytically operative one.
When big ASX news breaks, our subscribers know first
Ross Stores: constructive positioning with a live catalyst ahead
The absolute benchmark-relative figure for Ross, 103%, is only modestly above index weight. The more instructive reading is the peer comparison. At 103% for Ross versus roughly 70% for TJX, the ownership gap between the two names is wider now than at any point in the prior three years, according to Evercore ISI data through June 2026.
Active managers have pushed the Ross ownership premium over TJX to a multi-year high as of June 2026, a pattern that points to deliberate stock selection within off-price retail rather than a generalised call on discount spending.
That gap tells you managers are making a deliberate call on Ross versus TJX, not simply buying the off-price theme. According to Evercore ISI, Ross features in the firm’s Top 5 Outperform list, with analysts pointing to company-specific operational programmes that should drive a pickup in same-store sales performance; they anticipate two-year stacked comparable sales growth to pick up pace in the second half of 2026, which positions Q3 and Q4 results as the specific tests for this thesis.
Evercore also noted that TJX’s sustained history of dependable results makes it unlikely that active managers would maintain a material underweight in that name for long, which frames the Ross call as a relative rather than absolute position. Funds are not abandoning TJX; they are tilting toward Ross on a near-term catalyst basis.
The Ross Stores earnings beat reported in August 2026, which showed comparable-store sales growth of approximately 10% driven by higher customer traffic, provides the first concrete data point against which the Evercore ISI comp acceleration thesis can be measured.
| Stock | Benchmark-Relative Ownership | Ownership vs. Peer | Catalyst Timeline | Evercore Designation |
|---|---|---|---|---|
| Ross Stores | 103% of S&P 500 weight | +33 pts vs. TJX | H2 2026 comps (Q3-Q4) | Top 5 Outperform |
| TJX | ~70% of S&P 500 weight | Baseline peer | — | — |
For a portfolio manager evaluating off-price retail exposure, the data argues for tilting toward Ross over TJX on a near-term catalyst basis. But the trade has a defined re-evaluation timeline that should be set before entering: Q3 and Q4 2026 results. If comps deliver, the positioning setup has a plausible path to further institutional re-rating. If they miss, the relative overweight versus TJX reverses cleanly.
Nike: when maximum ownership becomes maximum vulnerability
Nike’s 157% of benchmark weight is not simply a sign of strong institutional sponsorship. It is a structural condition that changes how the stock responds to news in both directions, independently of what Nike’s fundamentals do next.
Start with the asymmetry. In a crowded stock, the mechanics work against you on both sides:
- Downside amplification: Bad news forces similarly positioned funds to reduce simultaneously, because they are all overweight the same name. The selling compounds, and the move exceeds what the fundamental miss alone would justify.
- Muted upside: Good news struggles to find incremental buyers because the natural audience, large active managers, is already fully allocated. The stock needs not just better fundamentals but active de-crowding before the technical setup turns favourable.
Across the eight softlines names monitored by Evercore ISI, Nike is the sole stock where large mutual fund ownership exceeds its S&P 500 benchmark weight, and the gap is substantial.
That isolation matters. When every other name in the group sits at or below benchmark weight, Nike’s 157% reading concentrates both the analytical and portfolio risk into a single position. There is no sector-wide crowding to diffuse the pressure; it is Nike-specific.
Operational context compounds the risk
The crowding would be less concerning if Nike were executing cleanly. It is not. Evercore ISI has flagged a range of headwinds specific to Nike’s athletic apparel business, including disruption from shifts in distribution channels and inventory management, as factors that layer additional fundamental risk on top of an already stretched ownership position. Fundamental disappointments are a non-trivial possibility during a period of strategic change, which makes the crowded ownership structure particularly poorly timed.
What this tells you: if you currently hold Nike at market weight or above, the 157% figure is a signal to define a tighter loss threshold and resist the temptation to add on dips until there is visible evidence of institutional de-crowding (ownership drifting back toward benchmark weight) or a clear fundamental inflection. Nike’s brand quality is not in dispute. That is precisely the trap: conflating long-term franchise value with near-term technical setup leads to underweighting the exit risk embedded in the current ownership structure.
Applying the ownership framework to your portfolio positioning right now
The analytical contrast between Ross and Nike translates into three distinct decision contexts. Each carries a different directive:
- If you hold Ross: The positioning supports holding or modestly extending, but set an explicit re-evaluation trigger at Q3 2026 earnings. If two-year stacked comps accelerate as Evercore expects, the thesis is validated and further overweighting has a data-backed rationale. If comps miss, normalise exposure toward TJX or the broader index. This is not an open-ended overweight.
- If you hold Nike: Apply a stricter risk framework. That means position size caps, tighter loss thresholds, or a defined waiting condition: either visible de-crowding (ownership moving back toward benchmark weight) or a clear fundamental inflection before adding any exposure. Do not average down into a crowded position without one of those conditions being met.
- If you are evaluating new softlines exposure: The benchmark-relative data favours Ross over Nike on a near-term risk-reward basis. But the framework itself is the more durable takeaway: look not just at whether a stock is widely owned, but specifically at ownership versus benchmark and versus key peers. That distinction is more informative than headline institutional ownership percentages across all of consumer discretionary.
| Stock | Benchmark Weight Position | Near-Term Catalyst | Risk Framework | Re-Evaluation Trigger |
|---|---|---|---|---|
| Ross Stores | 103% (modestly above) | H2 2026 comp acceleration | Hold or extend modestly | Q3 2026 earnings |
| Nike | 157% (substantially above) | No near-term catalyst identified | Tighter loss thresholds; wait for de-crowding | Ownership drift toward benchmark |
The framework does not require a bearish thesis on Nike or a bullish thesis on consumer spending generally. It simply tells you that at current ownership levels, the risk-reward for incremental Nike exposure is structurally unfavourable relative to Ross, and position sizing should reflect that asymmetry.
Beta-weighted position sizing makes the risk asymmetry between Ross and Nike quantitatively visible: a fund running equal dollar weights in both names is not running equal risk, because the crowding-amplified volatility on the Nike side produces a meaningfully higher effective market exposure than the dollar allocation suggests.
What the Ross-Nike spread signals for the rest of 2026
The Ross-versus-TJX rotation is evidence of active manager selectivity within off-price, not a broad consumer discretionary theme play. That distinction has implications for how you read sector-level ETF positioning: the active money is making stock-specific bets within the sub-sector, which means sector-level flows may obscure the real story.
Two conditions would change the analytical picture materially. First, Ross comps delivering in H2 2026 could trigger further active re-rating and additional benchmark-plus positioning. Second, Nike ownership drifting back toward benchmark weight would shift the risk-reward dynamic to something closer to neutral, potentially opening a more favourable entry.
The ownership framework laid out here is repeatable. It applies to any sector where Evercore ISI or similar institutional research publishes benchmark-relative positioning data, giving you a durable analytical tool beyond the current Ross and Nike setup. If you monitor the Ross-TJX ownership gap and the Nike benchmark-relative figure over the coming two earnings cycles, you will have a more precise early warning system for when to add or reduce softlines exposure than price action alone provides.
H2 2026 portfolio positioning decisions extend well beyond the softlines sector: the broader style reset documented through June 2026 has closed valuation gaps that justified concentrated bets, making benchmark-relative ownership data in consumer discretionary one input among several that active managers need to integrate before Q3 results season.
Benchmark-relative ownership is a leading indicator of technical risk, not a substitute for fundamental analysis. The two must be read together: positioning tells you where the crowding sits, fundamentals tell you whether the crowd is right.
This article is for informational purposes only and should not be considered financial advice. Investors should conduct their own research and consult with financial professionals before making investment decisions. Forward-looking statements regarding same-store sales acceleration, institutional positioning shifts, and earnings catalysts are subject to change based on market developments and company performance.