
Prominent voices in finance have spent the better part of four decades predicting catastrophe from US government debt. Not one of those predictions has come to pass. Debt levels continued rising, the warnings multiplied, and the Treasury market absorbed it all without the collapse its critics anticipated.
The fiscal problem is real. The numbers are genuinely alarming. But being right about the problem and being right about the crisis are two very different things, and the gap between those positions is where most investors lose money or lose sleep unnecessarily. The structural mechanics of the Treasury and repo markets explain that gap far better than opinion or hope ever could.
Here is the structural case for why the collapse keeps not happening, and what the fiscal deterioration is actually doing to your mortgage payment, your equity multiples, and your rate-sensitive holdings right now. By the end, you will be able to separate catastrophic risk from realistic risk, and you will have five specific indicators to monitor instead of waiting for a crisis that structural evidence says is not imminent.
The structural plumbing that keeps Treasuries irreplaceable
Start with the plumbing that most investors never see. Overnight lending between banks and financial institutions, conducted through the repo market, is built almost exclusively on Treasury bills as collateral. No competing asset class can match their scale or reliability for this purpose.
The repo market is approximately $3 trillion in size, with Treasury bills serving as the dominant collateral underlying virtually all of that activity. The absence of any credible substitute at comparable scale is precisely what makes Treasuries structurally irreplaceable in day-to-day global finance.
That figure is not just a data point. It tells you that the global financial system has built its infrastructure around Treasuries so completely that any foreign holder contemplating a mass sell-off would be damaging their own plumbing, not just delivering a blow to Washington. China and Japan, the two largest foreign holders, would crystallise mark-to-market losses on their own reserves and disrupt the dollar-funding markets their own financial systems depend on. The “nuclear” sell-off scenario is not just unlikely; it is economically self-defeating for the seller.
Treasury buyer composition has shifted materially over the past decade, with foreign reserve managers plateauing at roughly 33% of outstanding debt while US commercial banks have stepped in as the primary marginal buyer, now holding a record $4.8 trillion driven by Basel capital rules that assign zero risk-weight to Treasuries.
Then there is the reserve-currency argument. The dollar’s share of global foreign exchange reserves has drifted from roughly 71% to approximately 57% as of Q1 2026 over two decades. That sounds like decline. But look at what is behind the numbers: no alternative combines the scale, depth, and legal certainty that global reserve managers, pension funds, and insurers require.
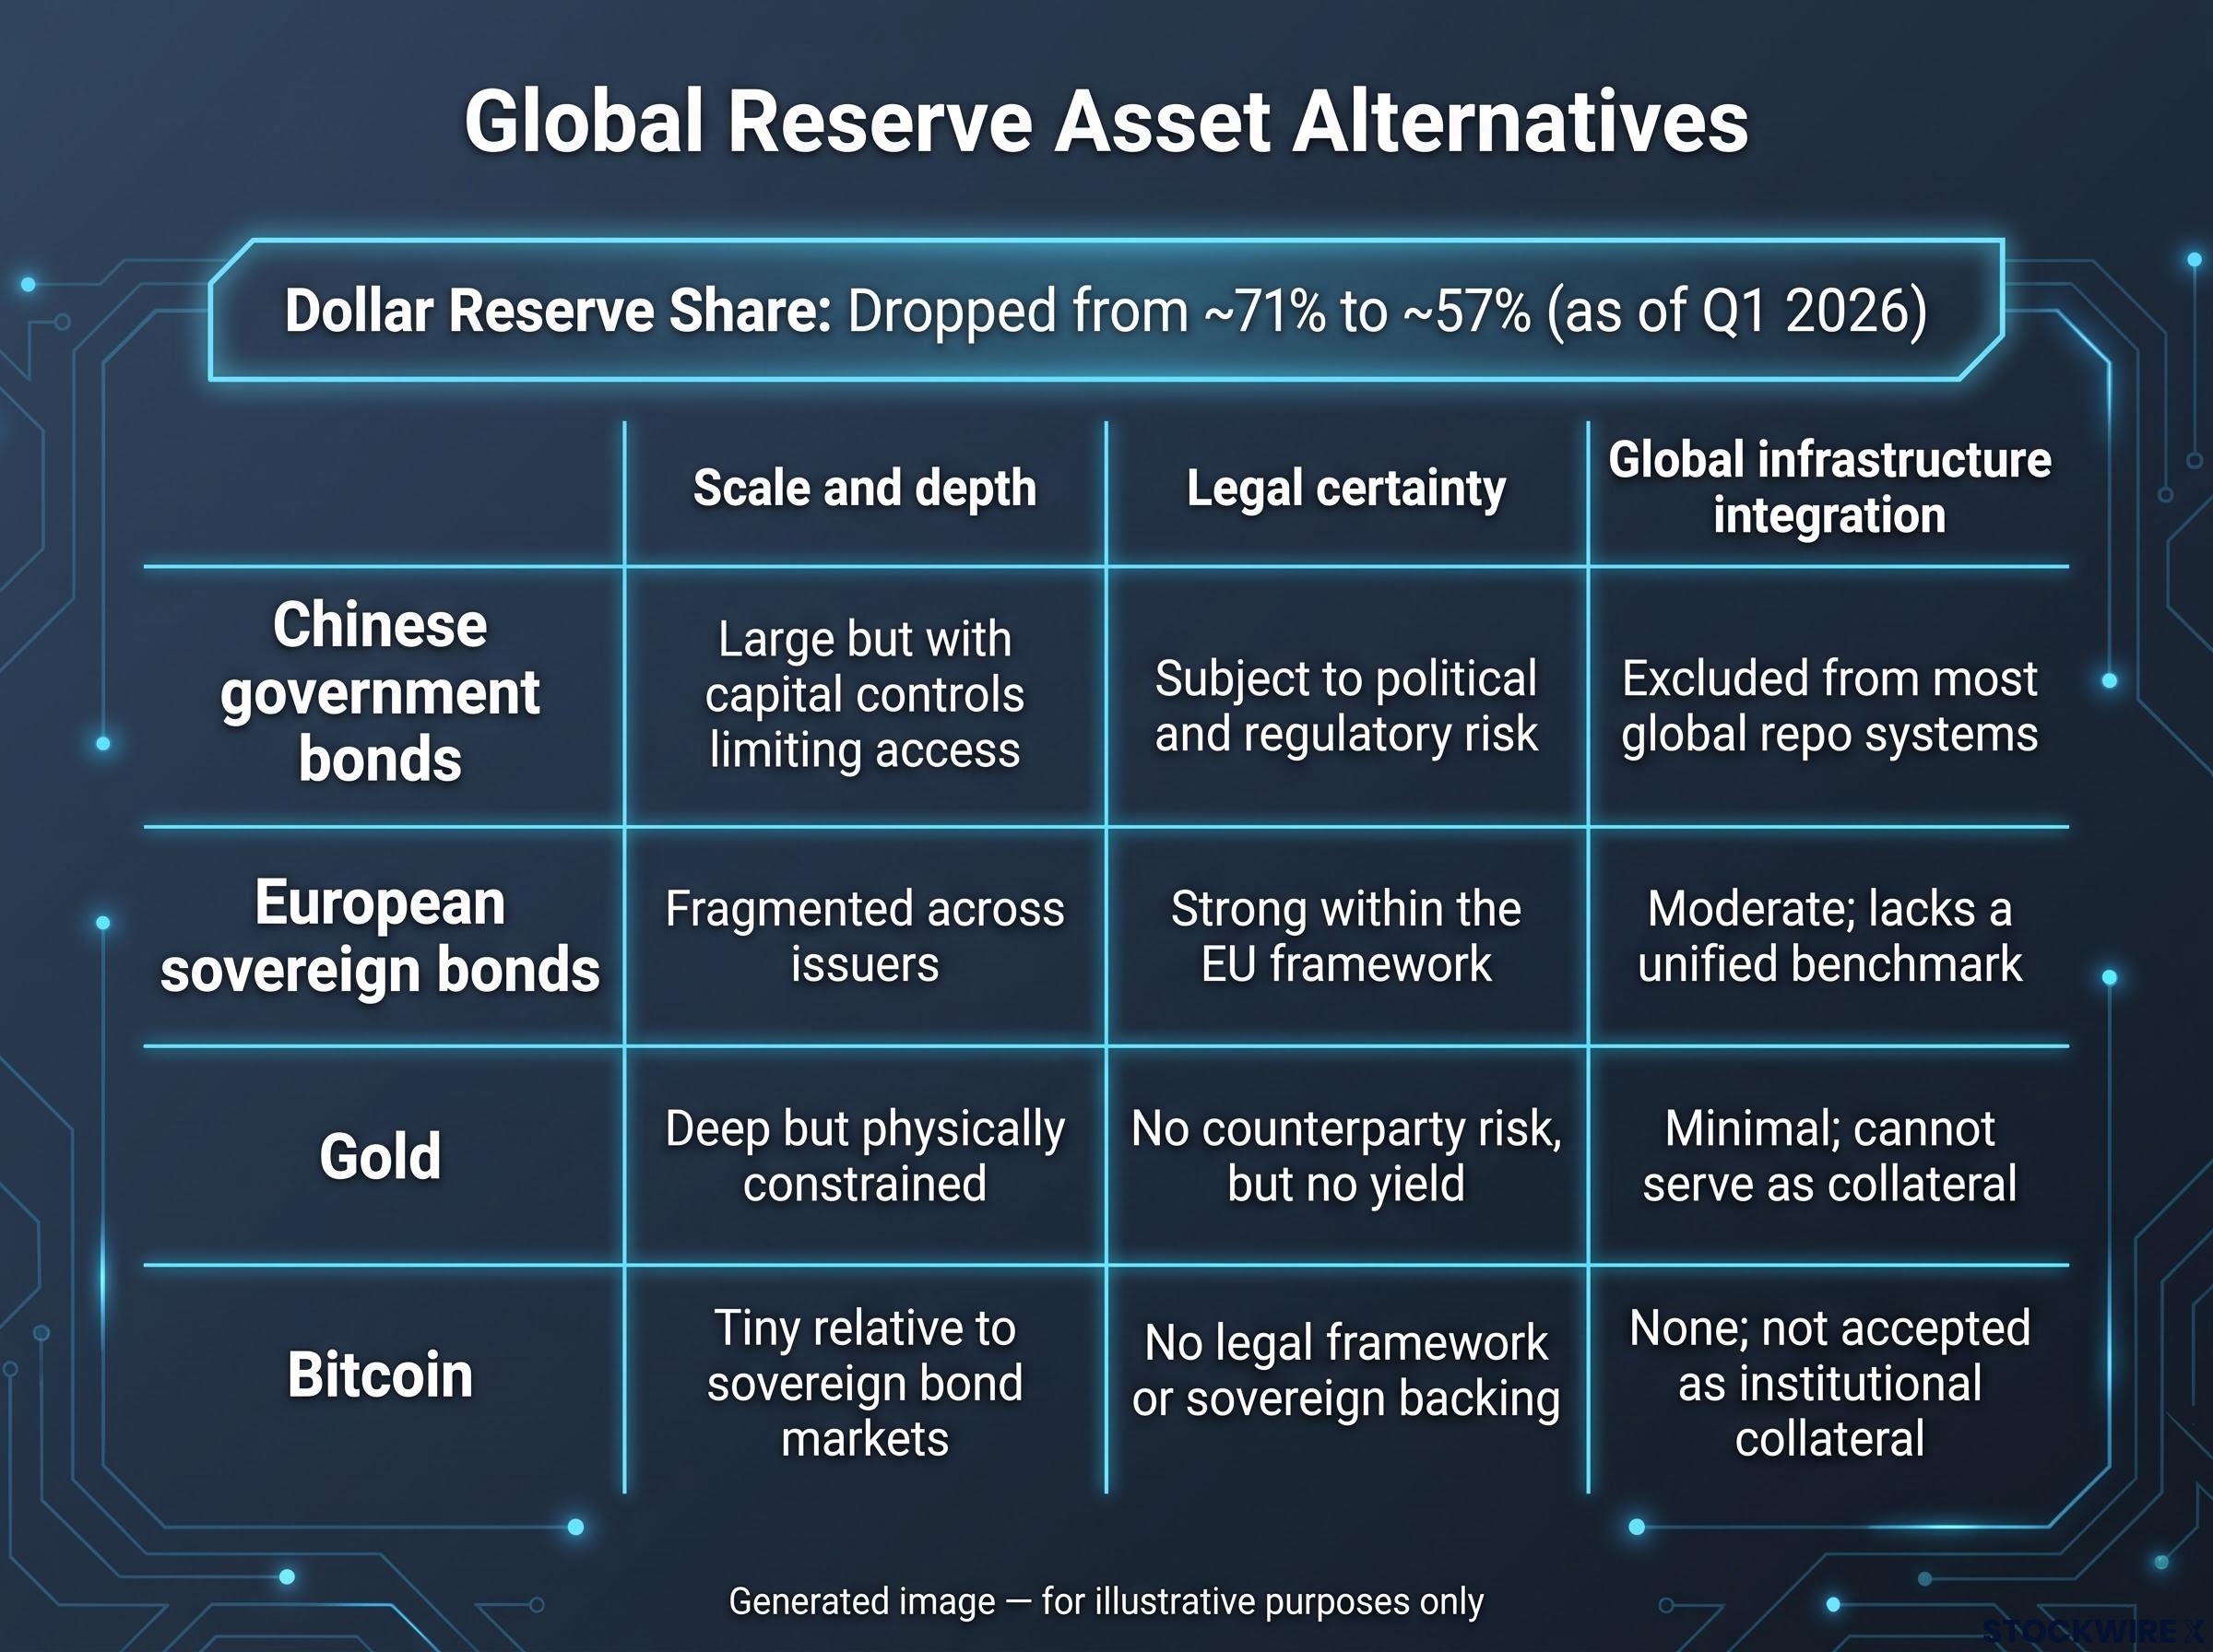
| Alternative asset | Scale and depth | Legal certainty | Global infrastructure integration |
|---|---|---|---|
| Chinese government bonds | Large but with capital controls limiting access | Subject to political and regulatory risk | Limited; excluded from most global repo systems |
| European sovereign bonds | Fragmented across issuers; no single deep market | Strong within the EU framework | Moderate; lacks a unified benchmark instrument |
| Gold | Deep but physically constrained | No counterparty risk, but no yield | Minimal; cannot serve as collateral in repo markets |
| Bitcoin | Tiny relative to sovereign bond markets | No legal framework or sovereign backing | None; not accepted as institutional collateral |
The dollar’s reserve share can drift lower for two decades without triggering a crisis precisely because the infrastructure gap between Treasuries and everything else remains enormous. That drift is worth monitoring. It is not worth catastrophising about.
The Federal Reserve international dollar role research confirms the dollar comprised approximately 58% of disclosed global official foreign reserves in 2024, down from a peak of 72% in 2001, the same gradual drift the article references without indicating any structural rupture in the dollar’s dominance.
When big ASX news breaks, our subscribers know first
Forty years of warnings, forty years of nothing: what the track record actually tells you
The national debt has surpassed $40 trillion, swelled by tax cuts, expanded benefits, and crisis responses to the 2007-09 recession and the COVID-19 pandemic. The Government Accountability Office (GAO) projects debt held by the public reaching 123% of GDP by 2036. The Congressional Budget Office (CBO) projects federal debt as a percentage of GDP could eventually surpass levels recorded during World War II.
Every one of those numbers is real. Credible analysts with established reputations have been examining figures like these for the better part of four decades and consistently concluded that a reckoning was near. Each time, that conclusion proved premature by years, and in investment terms, being wrong by many years is simply being wrong.
The pattern across every major missed-call episode shares the same characteristics:
- A debt level was cited as unsustainable at the time, only for the market to absorb significantly more issuance without disruption.
- A specific mechanism was predicted (auction failure, dollar crash, foreign selling spiral) that never materialised because the structural supports outlined above remained intact.
- The opportunity cost was real: investors who sat in cash or gold waiting for the crisis paid years of forgone returns while markets climbed.
- The warnings themselves became part of the background noise, making it harder to identify when genuine deterioration was actually accelerating.
The distinction that matters
The failure of the collapse narrative is not permission to ignore the debt trajectory. It is an instruction to stop conflating a slow-moving structural problem with an acute crisis. Alarm signals and collapse mechanisms are two different things. The fiscal path is genuinely unsustainable in the long run under current laws. But the mechanism for a sudden crisis, wholesale abandonment of Treasuries and the dollar, has never come close to occurring, for the structural reasons covered above. Conflating those two realities leads to poor portfolio decisions in both directions: panic selling into a crisis that does not arrive, or complacent ignoring of the rate pressure that is already here.
What the fiscal deterioration is actually doing to markets right now
The collapse may not be coming. But something real is already happening to your housing payment and your equity multiples, and it started before most investors noticed.
In FY 2024, net interest outlays on federal debt reached approximately $881 billion, exceeding national defence spending of approximately $874 billion. Interest expense is now one of the largest line items in the federal budget, and projections show this gap widening.
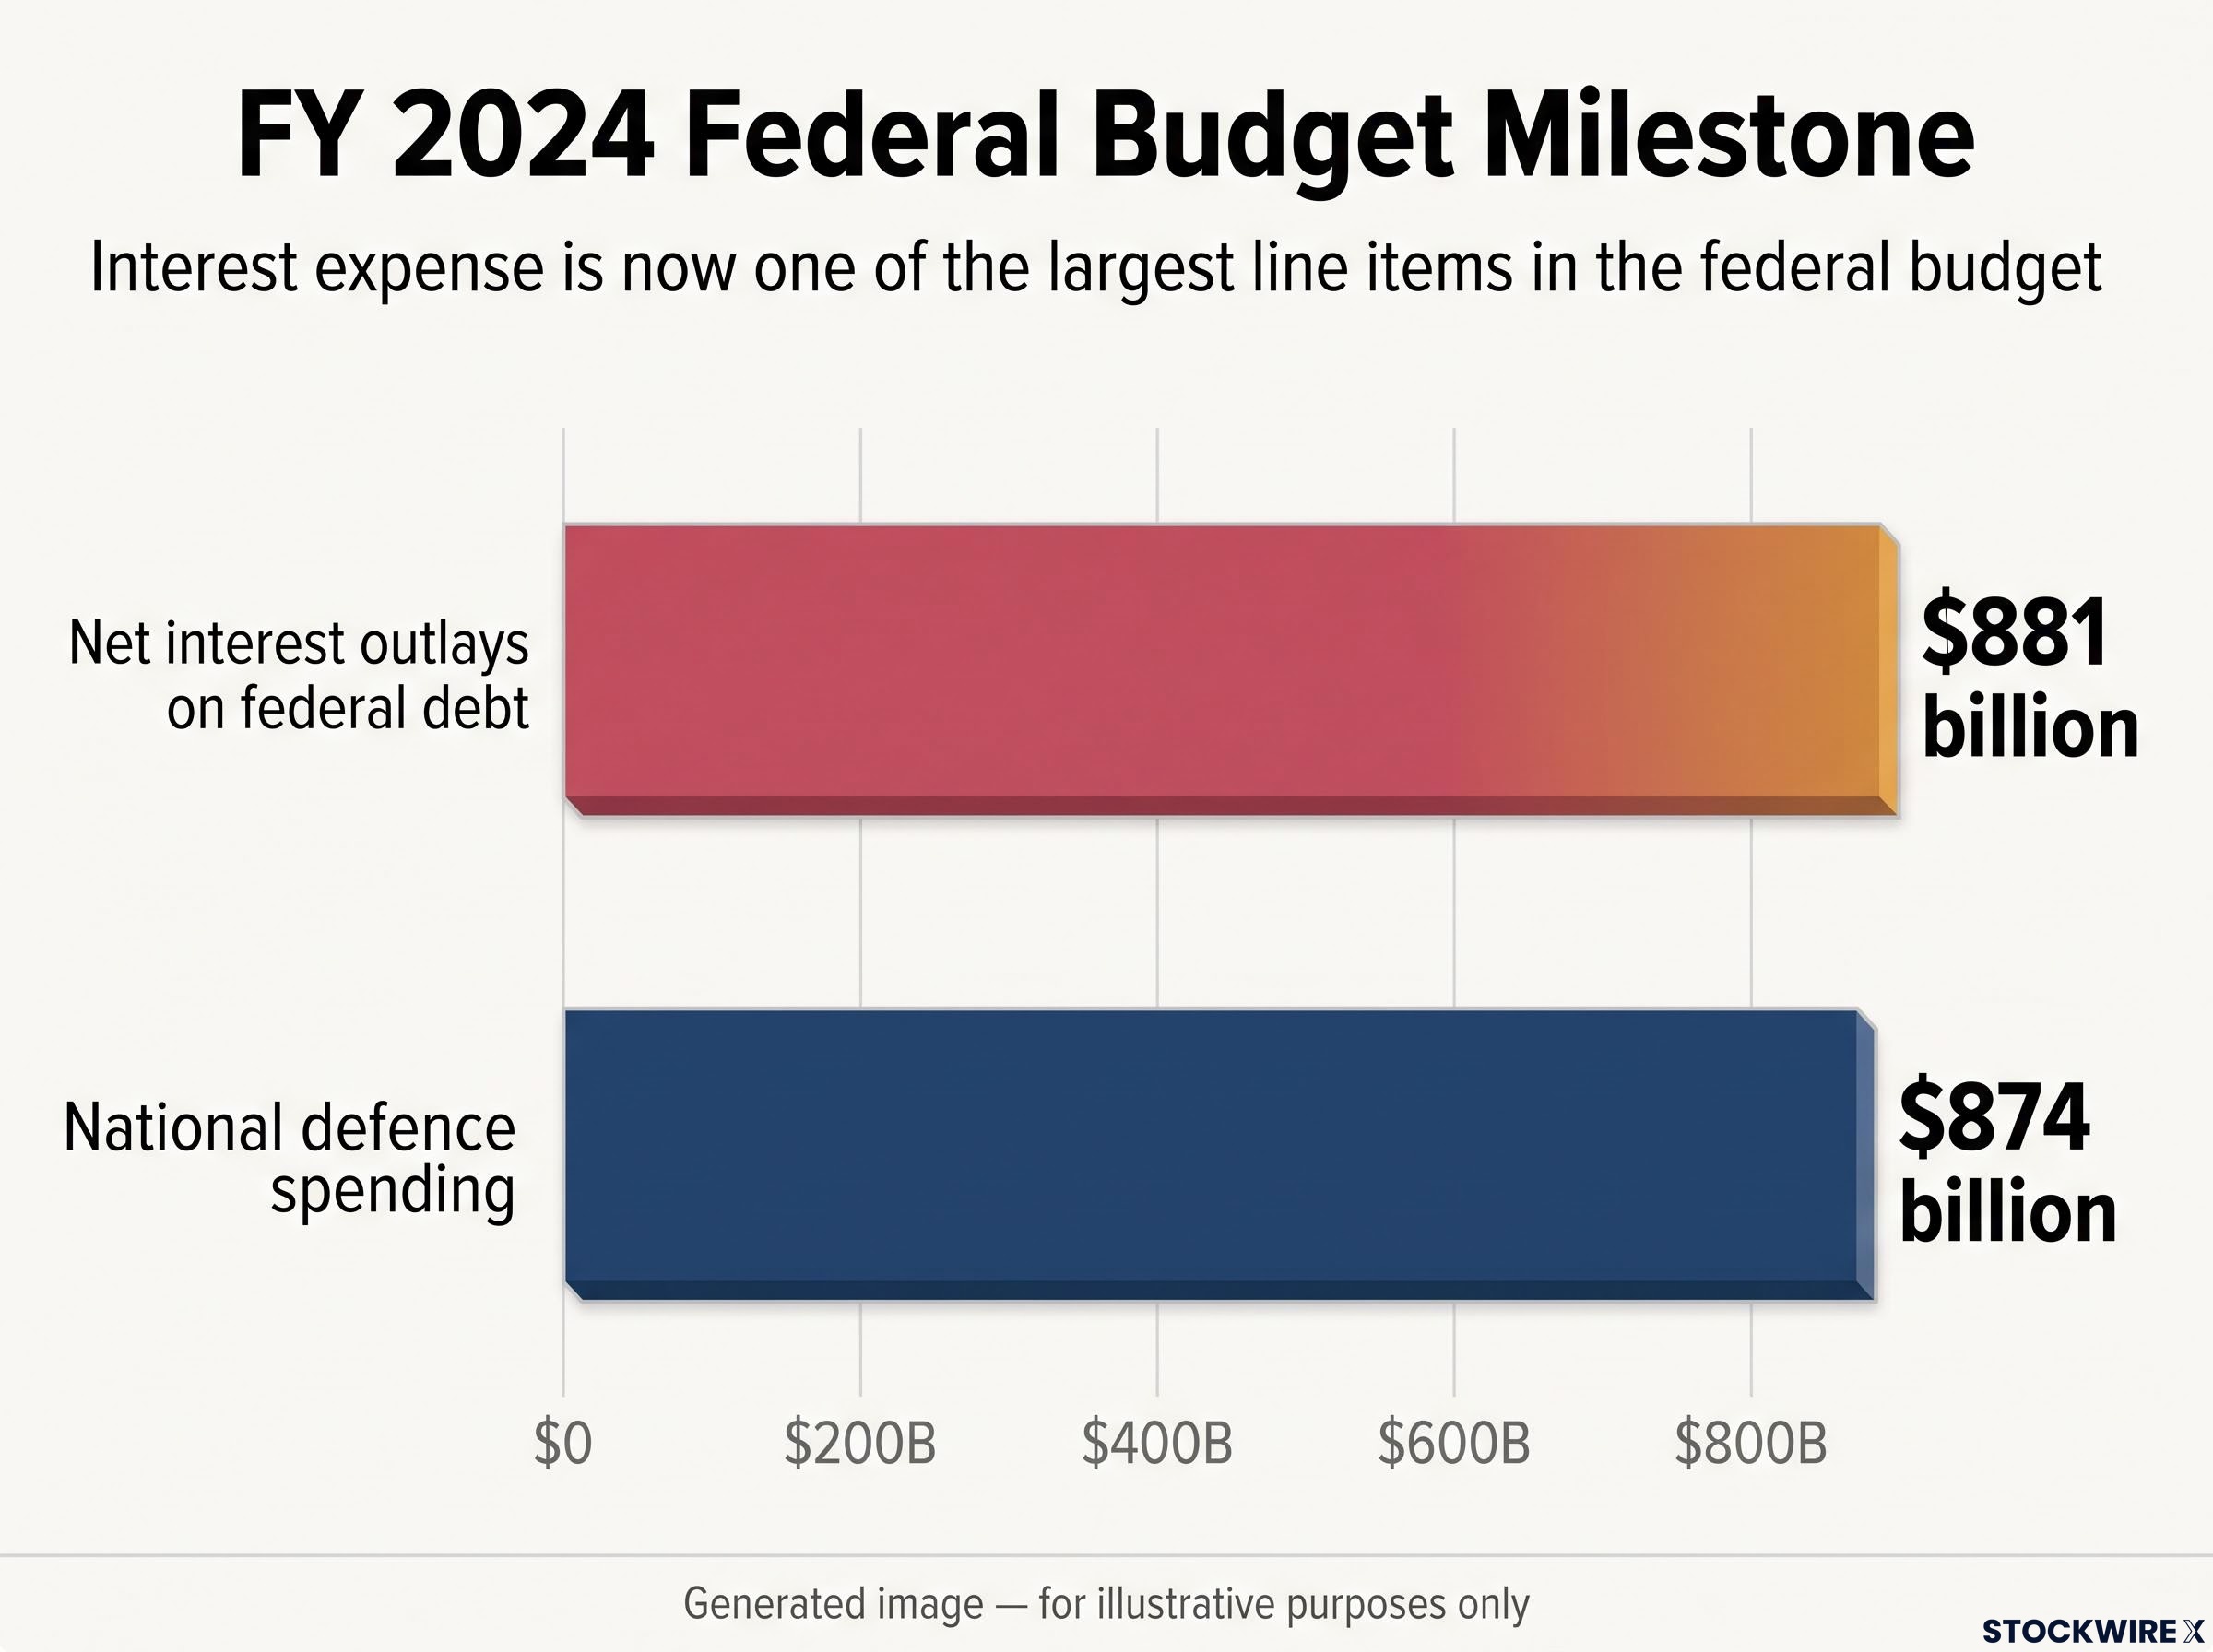
That milestone crossed the fiscal deterioration from abstract projection into present-tense reality. The mechanism through which it reaches your portfolio is straightforward, and it operates through three channels simultaneously.
The House Budget Committee fiscal milestone report documented this crossover point mid-way through FY 2024, confirming that net interest payments had exceeded both national defence and Medicare spending, anchoring the article’s core data point in an official congressional source rather than media reporting.
How higher rates transmit into housing
Elevated policy rates and rising term premiums push up yields on mortgage-backed securities, which lenders pass through to borrowers. When mortgage rates moved from 3% to 7%, the monthly payment on the same property price increased materially, pricing millions of potential buyers out of homes they could previously afford.
Mortgage rate transmission from Treasury yields operates through a mechanical spread: the 30-year fixed rate tracks the 10-year Treasury yield plus approximately 2 percentage points, meaning a single percentage point rise in the 10-year yield adds roughly $97,000 in total interest cost on a $400,000 loan over 30 years.
The spread between 30-year mortgage rates and 10-year Treasuries has been unusually wide in recent years. That spread tells you something beyond the Fed’s rate decisions: it signals that lenders themselves are pricing in additional risk, a structural friction that persists regardless of where the federal funds rate sits.
How higher rates compress equity valuations
- Housing: Higher mortgage rates reduce affordability directly; wider mortgage-to-Treasury spreads signal structural stress in lending conditions that persists beyond the rate cycle.
- Equities: When long-term rates rise, the discount rate applied to future cash flows increases, mechanically compressing price-to-earnings multiples. Growth stocks with cash flows far in the future absorb the sharpest compression. Companies that must refinance at today’s rates rather than the near-zero yields of the early 2010s face margin erosion.
- Rate-sensitive sectors: Real estate investment trusts (REITs), utilities, private equity, and parts of the banking system face particular strain. These sectors are built on leverage and yield, and higher funding costs squeeze returns from both sides: the cost of capital rises while the premium investors demand for holding those assets increases.
The GAO’s projection of debt held by the public reaching 123% of GDP by 2036 tells you this pressure is not cyclical. It is structural. The “higher for longer” rate environment is not just a Federal Reserve posture; it is a fiscal reality that will persist regardless of monetary policy decisions, because the deficit itself is generating upward pressure on long-term yields and term premiums.
What to actually monitor instead of the collapse clock
The question is not “will there be a crisis.” The question is: how much is the fiscal deterioration feeding into rates and risk premiums right now? These five indicators answer that question, and each one updates continuously.
- 10-year Treasury yield and term premium decomposition. The term premium is the extra compensation investors demand for holding long-duration bonds beyond what short-rate expectations alone would imply. A rising term premium is a direct signal that markets are pricing greater uncertainty about long-run debt sustainability. If the term premium on the 10-year Treasury is rising, that has immediate, measurable consequences for your mortgage rate and the multiple the market assigns to your equity holdings. This is the single most important fiscal-risk signal in markets.
- CBO and GAO long-run fiscal projections. These nonpartisan agencies regularly update spending, revenue, and debt-path projections under current law. Watch for changes in mandatory spending programmes (Social Security, Medicare), tax policy assumptions, or interest-rate assumptions, because those shifts materially alter the trajectory and, by extension, the market’s pricing of fiscal risk.
- Treasury auction indicators. Bid-to-cover ratios, the share of indirect bidders (often foreign or institutional buyers), and the level of primary-dealer reliance show the depth and diversity of demand for new issuance. A single weak auction is noise. Persistent softening across several consecutive auctions would be a genuine warning signal of deteriorating demand.
- 30-year mortgage rate spread over 10-year Treasuries. When this spread is unusually wide, it tells you lenders are pricing in risk beyond what the benchmark rate alone implies. That is a direct measure of housing-market stress and a leading indicator of affordability pressure.
- Corporate credit spreads. Moves in investment-grade and high-yield spreads capture how higher rates are feeding through to perceived credit risk and refinancing pressure, particularly in leveraged and cyclical sectors. Widening spreads in high-yield credit, especially alongside rising term premiums, would confirm that fiscal deterioration is translating into real corporate funding stress.
These indicators tell you about the realistic risk: higher rates and term premiums grinding through housing, equities, and leveraged sectors. They do not tell you about the catastrophic risk, a Treasury auction failure or dollar collapse, because the structural evidence covered earlier in this piece tells you that risk remains remote. Knowing the difference is the entire point of the framework.
Replacing the collapse narrative with a framework that actually works
The long-run fiscal path is genuinely unsustainable if current laws hold. The GAO projects debt held by the public reaching 123% of GDP by 2036. Interest expense has already eclipsed defence spending in the federal budget, with approximately $881 billion in net interest outlays exceeding approximately $874 billion in defence spending in FY 2024. These are not projections. They are current reality.
The debt-to-GDP ratio compares a stock of accumulated obligations to an annual flow of economic output rather than to government revenue, which is why analysts increasingly prefer the interest-to-revenue ratio as a more direct measure of whether current debt levels are actually affordable to service.
But the near-term mechanism for a sudden crisis, a wholesale abandonment of Treasuries or a dollar collapse, remains structurally weak. The repo market runs on Treasuries. No alternative asset combines the scale, depth, and legal certainty required. Foreign holders face self-defeating losses if they sell aggressively. And roughly four decades of collapse predictions have produced exactly zero collapses.
Managing for the realistic environment means paying attention to rate-sensitive assets in your portfolio, watching term-premium drift, and understanding refinancing risk in leveraged positions. It does not mean abandoning markets for a catastrophe that structural evidence does not support.
For investors wanting to understand the active policy tools the Treasury is deploying alongside this structural environment, our dedicated guide to Treasury buyback policy examines how doubling long-end buyback capacity to $4 billion per operation functions as a deliberate yield-management mechanism and what it implies for hard asset positioning.
The most dangerous version of this story is not the bull case or the bear case. It is the failure to distinguish between a slow-moving structural problem and an acute crisis. That confusion has already cost investors decades of opportunity cost on one side and left others unprepared for the rate pressure that is already compressing their returns on the other.
The distinction between a slow-moving structural problem and an acute crisis is not semantic. It is the difference between adjusting your portfolio for a persistently higher-rate environment and making a bet on a specific catastrophic event that has failed to materialise for four decades. The five indicators above give you a way to track the real risk as it develops. The structural argument gives you permission to stop waiting for a collapse that the plumbing of global finance is specifically designed to prevent.
This article is for informational purposes only and should not be considered financial advice. Investors should conduct their own research and consult with financial professionals before making investment decisions. Past performance does not guarantee future results. Financial projections referenced in this piece are subject to market conditions and various risk factors.