
A consortium that included Stripe, one of PayPal‘s most formidable competitors, walked away from a reported $50-53 billion bid for the company in late August 2026. The offer valued PayPal at roughly $60.50 per share, a fraction of its 2020-2021 peak. The stock fell by double digits in pre-market trading on the news.
That sequence deserves a second read. A buyer with deep industry knowledge looked at PayPal at a heavily discounted price, with access to information the public market does not have, and decided the business was not worth it. The market’s immediate reaction was not to treat the walk-away as neutral. It treated it as confirmation.
PayPal still holds an estimated 41-45% share of global online payments. It still generates substantial free cash flow. It still has somewhere between 300 and 400 million active accounts. And yet, the stock has been labelled a bargain by value investors for roughly five years, even as it continued drifting lower throughout that period. The question is whether the market has been persistently wrong, or persistently right. Here is a framework for reading that question clearly, using PayPal as the case study but applicable to any business where apparent cheapness and structural deterioration coexist.
The consortium walked away, and the market agreed with the decision
The timeline tells the story efficiently. Through spring and summer 2026, a consortium led by Advent International and including Stripe explored a takeover of PayPal. The reported bid range sat at approximately $50-53 billion, or roughly $60.50 per share. On 27-28 August 2026, the consortium confirmed it had abandoned the deal. PayPal shares dropped by double digits in pre-market trading.
Earlier analysis of competitive auction dynamics around the original bid had placed a clearing price in the $70-$100 per share range, making the consortium’s decision to abandon at $60.50 an even more pointed signal: the business could not clear the bar even at a price the acquirers themselves may have considered below full value.
Three signals sit inside that sequence, and each one matters:
- The price context: the consortium was offering a valuation that already reflected years of decline from PayPal‘s peak, not a premium bid for a thriving business.
- The consortium’s identity: Stripe is not a passive financial buyer. It is PayPal‘s most credible competitor in merchant payments, meaning it had both the industry knowledge and the strategic motivation to extract value if value existed.
- The market’s response: a double-digit pre-market decline on abandonment news means investors interpreted the walk-away not as a failed negotiation but as a negative verdict on the business itself.
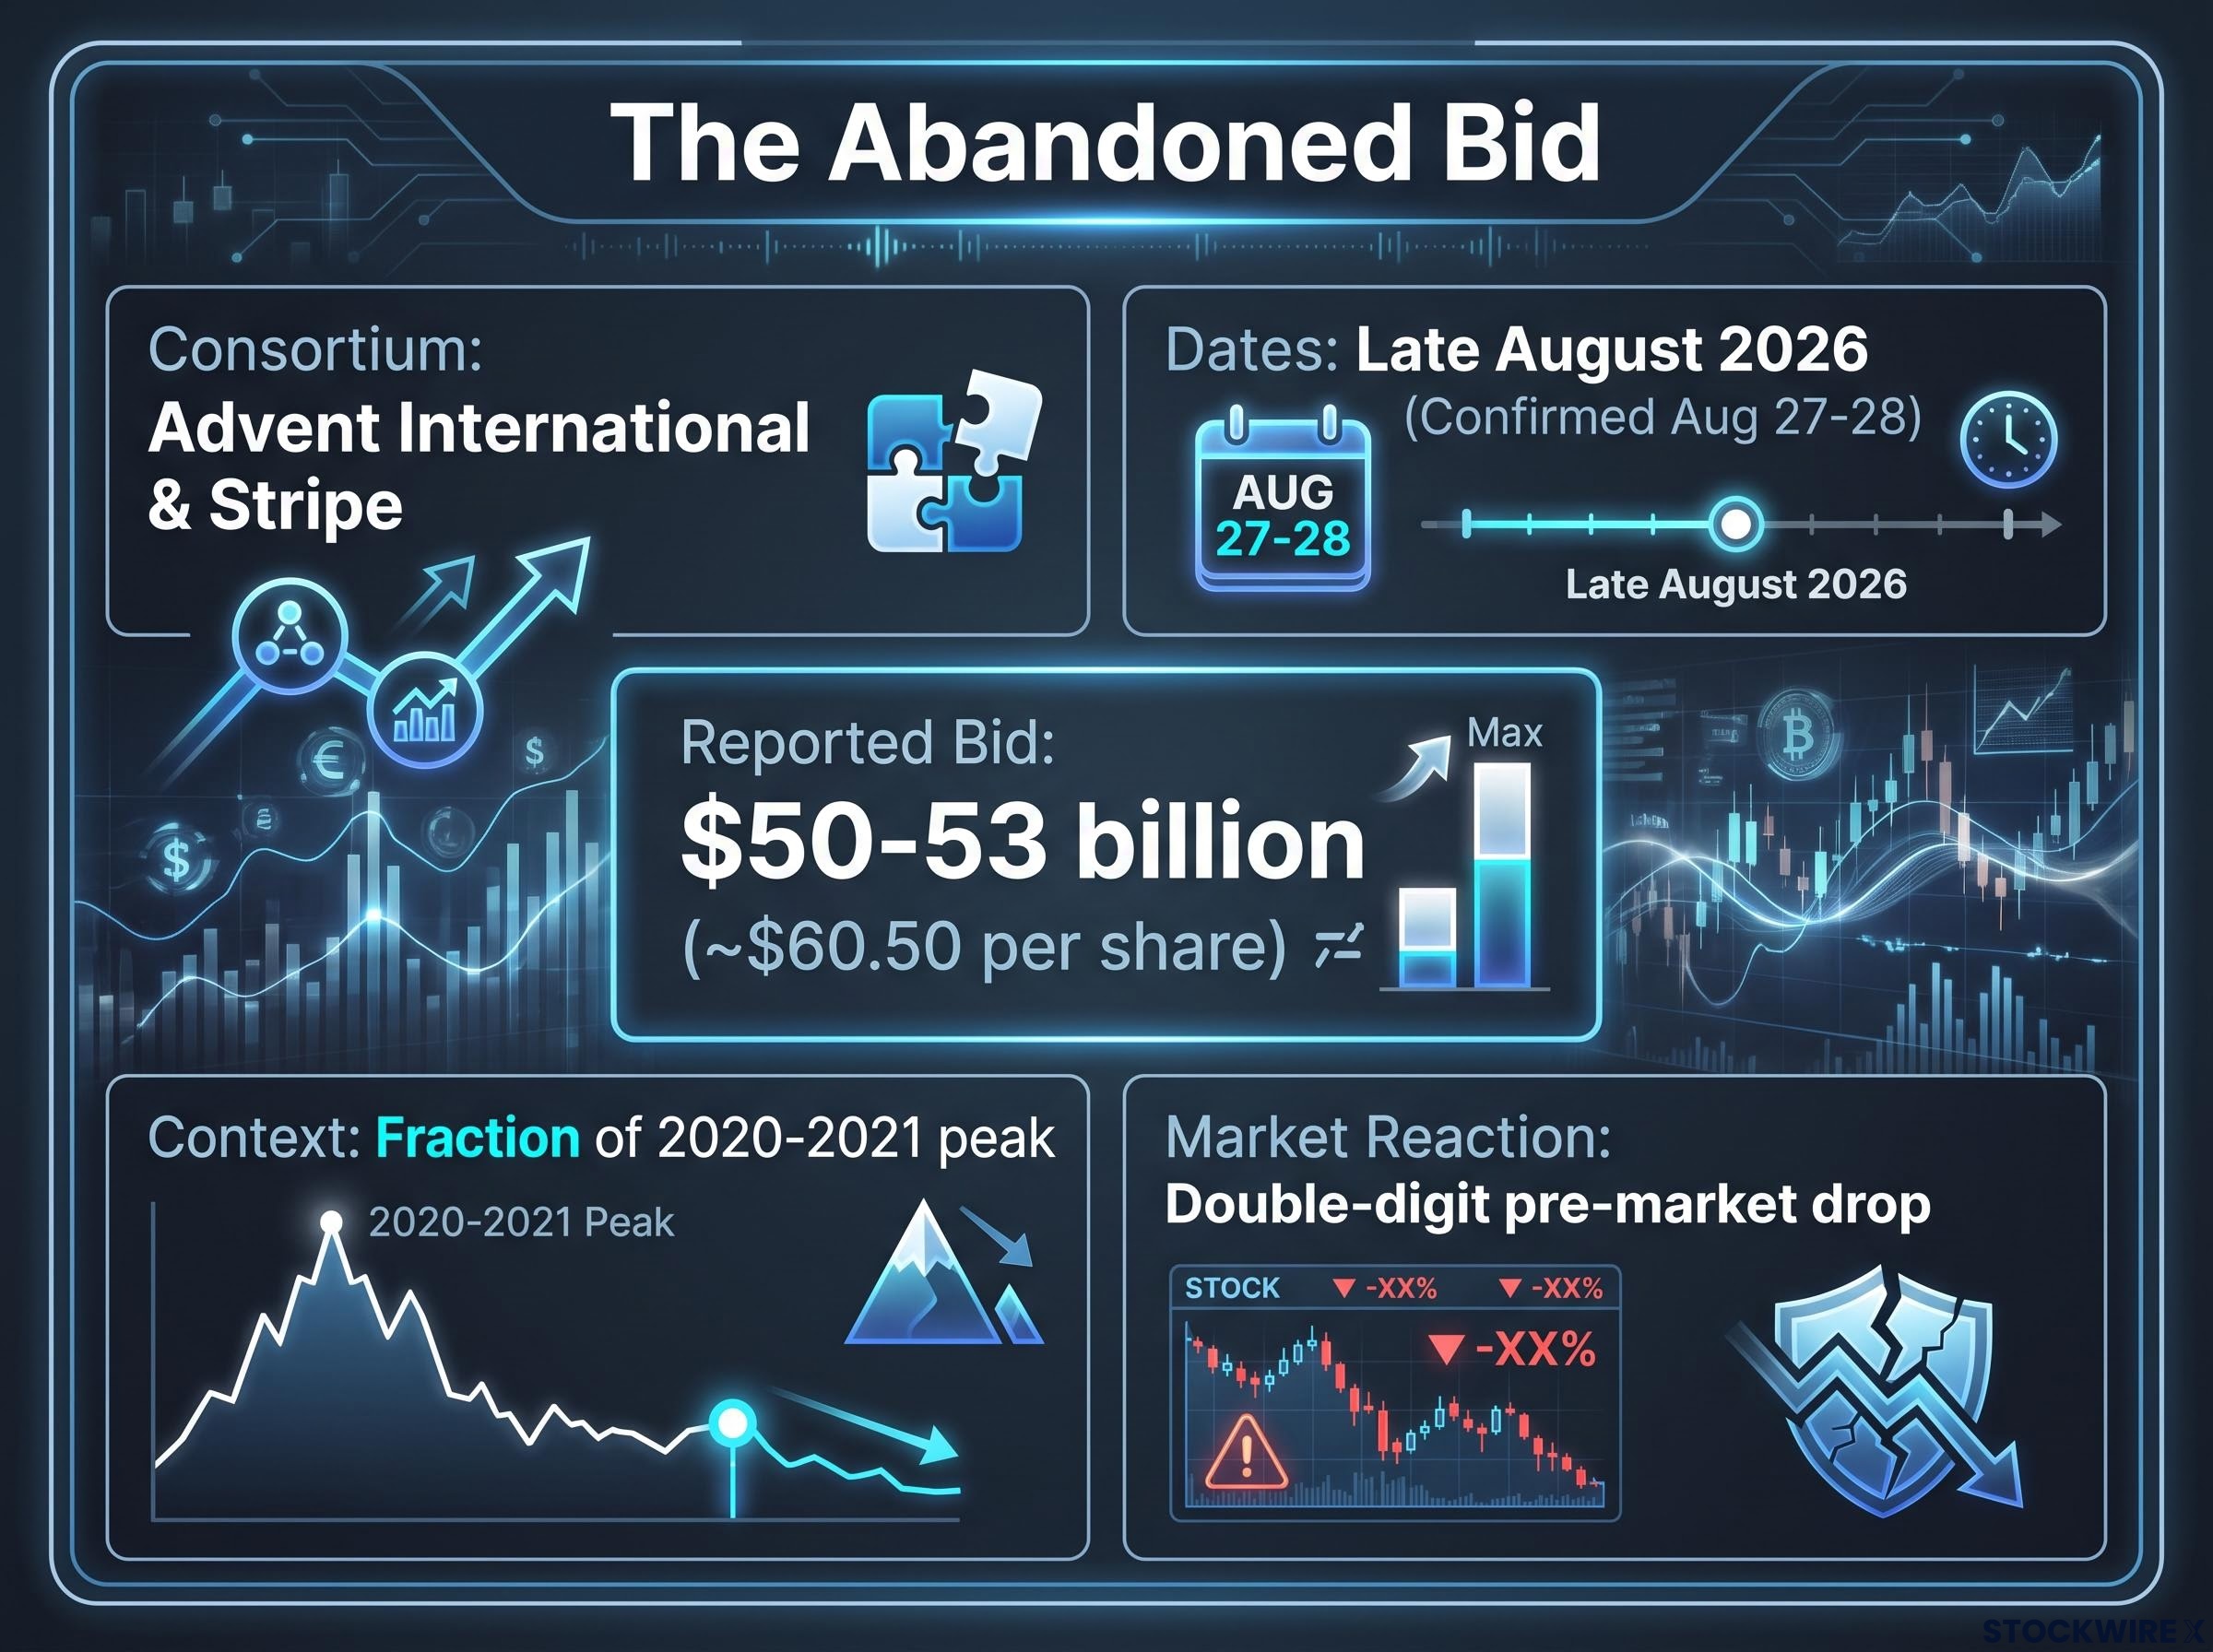
The reported bid range of $50-53 billion at approximately $60.50 per share represented a business already priced at a fraction of its peak. Even at that level, sophisticated strategic buyers with superior information passed.
The abandonment matters not because one deal fell through. Deals collapse for many reasons. It matters because a consortium with industry-specific knowledge, including PayPal‘s most capable rival, concluded that deeply discounted PayPal did not obviously clear the bar. That is a more informative signal than any sell-side price target revision, because it reflects a judgment made with access to due diligence the public market never sees.
When big ASX news breaks, our subscribers know first
Why merchants are defecting, and what that tells you about the moat
Merchant-level data makes the competitive shift tangible. In one documented case, PayPal‘s portion of a merchant’s online payment receipts contracted sharply over a sustained period, falling from around 25% to under 10%, while Apple Pay climbed to account for approximately 40% of the same merchant’s total payment volume over that timeframe.
In one documented merchant case, PayPal‘s share of online payment receipts fell from approximately 25% to below 10%, while Apple Pay rose to roughly 40% of total payments received.
This is a single data point, not a universal figure. But it is directionally consistent with what competitive trackers and analyst commentary describe across the broader market: merchants are exercising leverage they did not have five years ago, and they are moving volume toward platforms that offer more than transaction processing.
The question is why, and the answer is specific.
When tooling gaps become moat gaps
The payments industry has shifted. The relevant competitive question is no longer who can process a transaction. It is who can improve checkout conversion, give merchants granular control over routing decisions, and deliver the analytics that inform pricing and customer retention strategies. Stripe and Adyen have built their businesses around this proposition: developer-centric APIs, deeply integrated enterprise stacks, superior data tooling, and more flexible pricing structures for larger merchants.
PayPal‘s analytics and reporting capabilities are consistently characterised by analysts as weaker than those offered by its primary competitors. The gap is not about processing speed alone. It is about the entire optimisation layer that sits on top of the transaction.
| Attribute | PayPal | Stripe | Adyen |
|---|---|---|---|
| Global market share estimate (2026) | 41-45% | 13-23% | Growing enterprise share |
| Primary competitive strength | Consumer brand recognition, installed base | Developer APIs, customisation | Enterprise integration, unified commerce |
| Merchant analytics capability | Weaker relative to peers | Strong; data-led checkout optimisation | Strong; deep routing and conversion tools |
| Typical merchant profile | Broad SME base, legacy enterprise | Tech-forward, high-growth companies | Large enterprise, omnichannel retail |
This competitive gap compounds over time. Every merchant integration deepens Stripe‘s and Adyen‘s data ecosystems, which improves their tooling, which attracts more merchants. PayPal‘s aggregate 41-45% market share is real, but it obscures the direction of travel. Branded checkout growth has slowed to low single digits in recent periods, and that slowdown maps directly to the tooling advantages competitors now hold.
The consumer shift to platform wallets is not a preference, it is a structural lock-in
On the merchant side, PayPal faces a tooling gap. On the consumer side, it faces something harder to close: a platform gap.
Apple Pay and Google Pay hold advantages that are not product features. They are platform features embedded at the operating system level:
- Default device presence: these wallets are built into the hardware and software stack, removing any requirement for the consumer to download, open, or navigate a separate application
- Authentication embedded in the hardware: payment confirmation is handled through the same biometric systems consumers already use to unlock their devices, compressing the checkout action to a single physical gesture
- Reduced decision friction at checkout: because the payment method is always available and always authenticated, consumers encounter fewer barriers between intent and completion
PayPal cannot replicate these through product iteration alone. It does not control the operating systems. It does not control the biometric authentication layer. It competes as an app-level experience against wallet functionality built into the infrastructure of the world’s two dominant mobile platforms.
Apple Pay’s platform advantages extend well beyond payments: the same hardware and software integration that compresses checkout to a single biometric gesture is also driving record iPhone share gains across a contracting global smartphone market, deepening the installed base from which Apple Pay’s consumer habit formation accelerates.
Big-tech wallets collectively accounted for roughly a third of global mobile and in-store wallet transactions by early 2026, according to directional industry estimates. The precise figure carries some uncertainty, but the scale of the shift is clear.
Worldpay’s 2026 Global Payments Report documents digital wallets capturing 56% of global e-commerce and 33% of in-store spending, a scale of penetration that contextualises exactly why PayPal’s branded checkout growth has decelerated to low single digits.
Analysts covering PayPal explicitly cite competition from digital wallets and alternative payment methods as the primary driver behind branded checkout growth slowing to low single digits. The consumer preference shift is not temporary. It reflects behavioural habits forming around biometric authentication and native checkout flows, habits that deepen rather than reverse as the underlying ecosystems mature.
What this tells you about the competitive trajectory is the opposite of what a durable moat produces. A strong moat stabilises or widens over time. PayPal‘s consumer position narrows as more users build habits around Apple Pay and Google Pay. The network advantage that once defined PayPal weakens with every consumer who defaults to a platform wallet.
Venmo’s unresolved strategic problem
Venmo is often cited as PayPal‘s strongest consumer asset, and its peer-to-peer (P2P) cultural footprint among younger users is genuine. The strategic problem is that P2P engagement has not translated into commerce volume at scale.
The margin profile of P2P transactions is structurally different from checkout commerce. Splitting a dinner bill generates activity, not high-margin revenue. The pathway from “people use Venmo to split costs” to “merchants route meaningful checkout volume through Venmo” has not been demonstrated at scale despite years of strategic effort.
Even Venmo‘s P2P base faces pressure. Zelle, Cash App, and bank-integrated payment solutions have all grown their user bases, meaning the defensive position is not safe either. Venmo remains culturally relevant, but cultural relevance without commercial conversion is a brand asset, not a strategic moat.
What value traps look like from the inside, and how to read the signal correctly
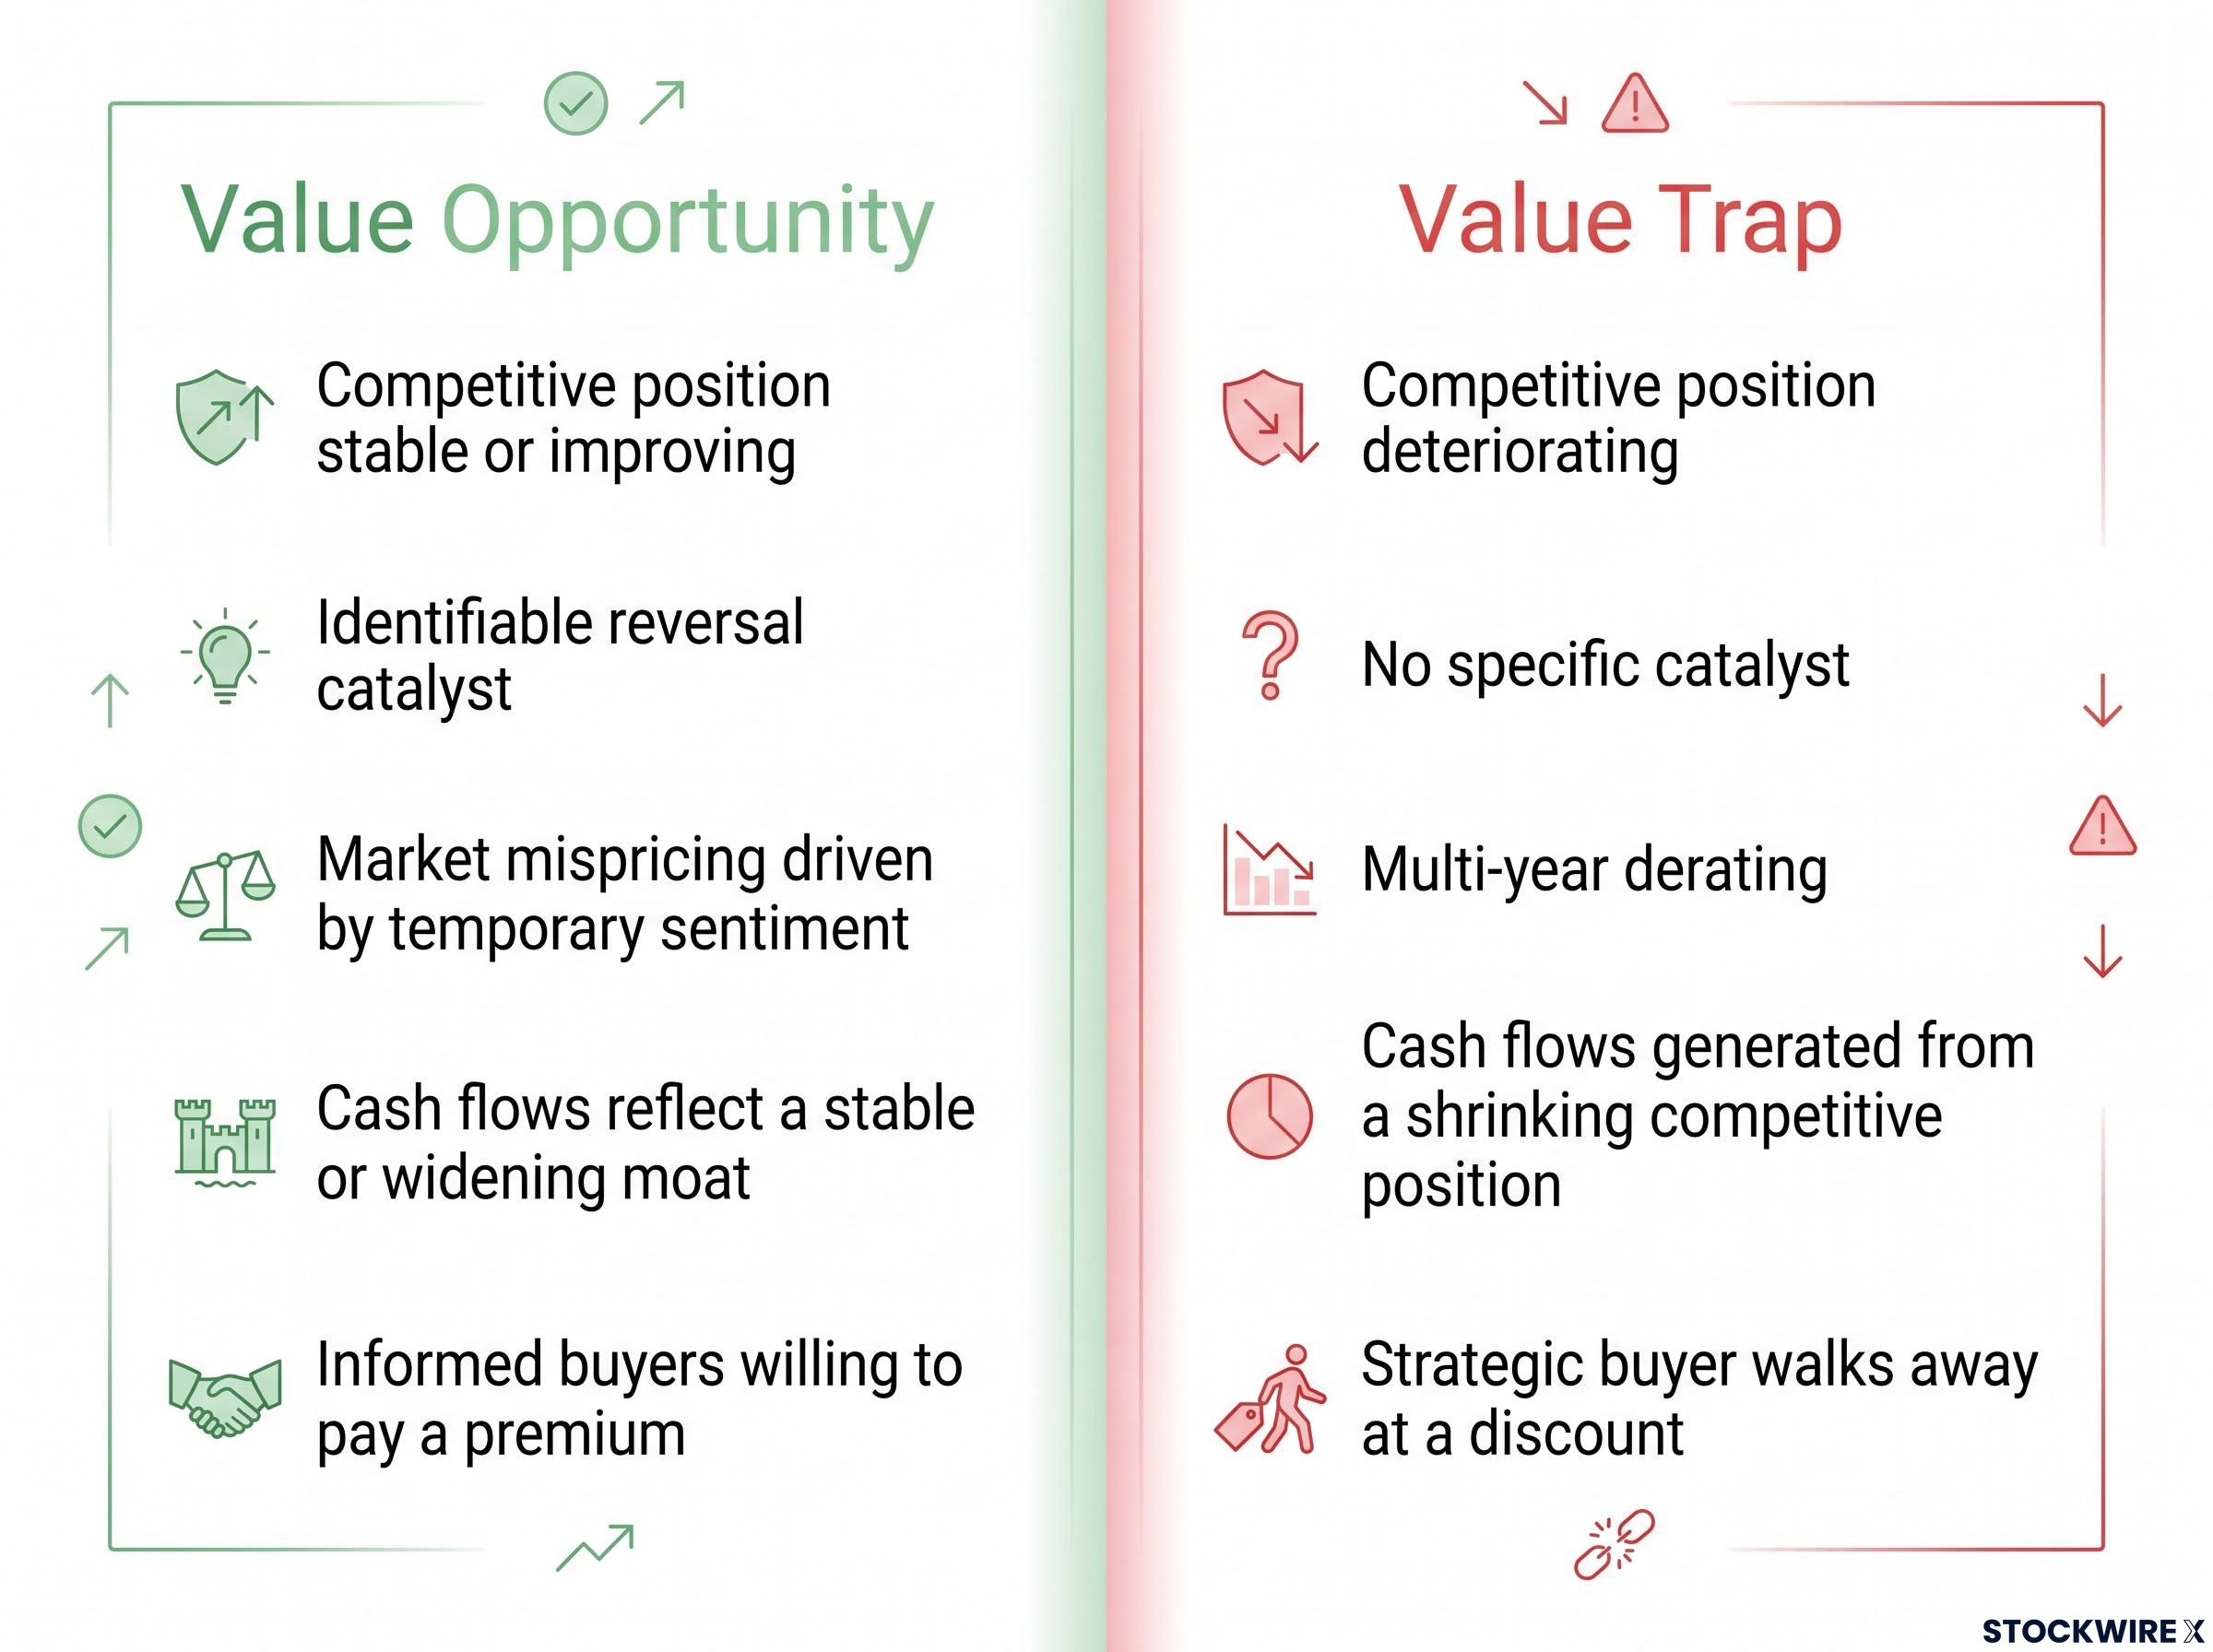
The evidence from the previous sections, merchant tooling disadvantage, consumer platform lock-in, acquisition abandonment, assembles into a pattern that has a name in investment analysis. A value trap is a stock that appears cheap on backward-looking metrics while its forward competitive trajectory is deteriorating.
PayPal fits the pattern precisely. The backward-looking metrics look attractive: substantial free cash flow generation, 300-400 million active accounts, a 41-45% global market share, and a valuation that has compressed dramatically from 2020-2021 highs. The stock has been characterised as undervalued for approximately five years.
The analytical challenge the PayPal situation represents is precisely the one that makes value trap identification the most consequential skill in value investing: the backward-looking metrics look compelling, the free cash flow is real, and the multiple is depressed, yet each of those signals is consistent with both a mispricing and a structural decline.
But the relevant question is not what the business earns today. It is what those cash flows look like in three years as merchant share continues to shift, branded checkout growth stagnates, and margin compression continues under competitive pricing pressure.
| Value opportunity signals | Value trap signals |
|---|---|
| Competitive position stable or improving | Competitive position deteriorating despite strong current metrics |
| Identifiable reversal catalyst with a timeline | No specific catalyst; bull case rests on “the multiple is too low” |
| Market mispricing driven by temporary sentiment | Multi-year derating consistent with structural re-evaluation |
| Cash flows reflect a stable or widening moat | Cash flows generated from a shrinking competitive position |
| Informed buyers willing to pay a premium | Strategic buyer with industry knowledge walks away at a discount |
When a stock is described as undervalued for five consecutive years while continuing to fall, the more parsimonious explanation is that the market is correctly pricing deteriorating competitive dynamics, not that it has been persistently wrong and value investors persistently right.
The distinction between structural versus cyclical competitive pressure is the same question investors faced with financial data incumbents when AI-native tools began competing with terminal-model aggregators: the surface metrics remained strong for an extended period while the underlying competitive position deteriorated, producing a valuation de-rating that accelerated as the structural nature of the shift became undeniable.
There is also the opportunity cost dimension. Capital held in PayPal on the basis of apparent cheapness carries the cost of not being allocated to businesses with improving competitive positions in fintech and mobile payments.
Three diagnostic questions apply to any business caught in this pattern:
- Are the competitive pressures structural or cyclical? If rivals’ advantages compound over time (platform integration, deepening data ecosystems), the pressures are structural.
- Do current cash flows reflect a stable moat or a deteriorating one? Strong present-day free cash flow generated from a shrinking competitive position is not the same as strong free cash flow generated from a durable one.
- What is the opportunity cost of waiting for a recovery that may not come? The “undervalued” thesis requires a specific reversal catalyst with a plausible timeline, not just a depressed multiple.
These questions are not specific to PayPal. They apply to any business where current fundamentals appear strong but competitive dynamics are moving against the incumbent.
What the evidence changes, and what it does not
This analysis has established three structural pillars: a merchant-side tooling disadvantage that is driving share migration to Stripe and Adyen, a consumer-side platform lock-in favouring Apple Pay and Google Pay that compounds rather than stabilises, and a valuation pattern consistent with the market correctly pricing structural decline rather than temporarily mispricing a recovery opportunity. The acquisition abandonment in August 2026 functions as the most recent and most legible signal from informed strategic buyers.
The evidence boundaries deserve honest acknowledgement. The merchant case study is anecdotal, directionally consistent with broader trends but not a universally documented figure. Some competitive claims rest on analyst characterisation rather than hard comparative benchmarks. The interpretation of the consortium’s reasoning is plausible but not directly documented from the buyers themselves.
What the analysis does establish is a standard of evidence for anyone evaluating the bull case. “The multiple is cheap” is not sufficient when the competitive trajectory is moving against the business. The burden of proof now sits with demonstrating a specific, durable competitive re-entry point, not with pointing to depressed multiples or strong current cash flow. Three conditions would need to be observed to reconsider the structural decline thesis:
- Merchant share stabilisation, evidenced by branded checkout growth returning to mid-single digits or higher
- Concrete evidence of Venmo-to-commerce conversion at scale, not P2P growth but high-margin checkout volume
- Platform wallet growth stalling, suggesting the consumer habit shift has a ceiling rather than a compounding trajectory
The unanswered question the reader should carry forward is specific: what catalyst reverses merchant migration and platform-wallet displacement, and on what timeline? Until that question has a credible answer, structural analysis of competitive positioning is the prior question. Valuation is the subsequent one. Getting the order right is what prevents the value-trap mistake, whether the business in question is PayPal or any other incumbent facing structural headwinds.
This article is for informational purposes only and should not be considered financial advice. Investors should conduct their own research and consult with financial professionals before making investment decisions. Past performance does not guarantee future results.
—