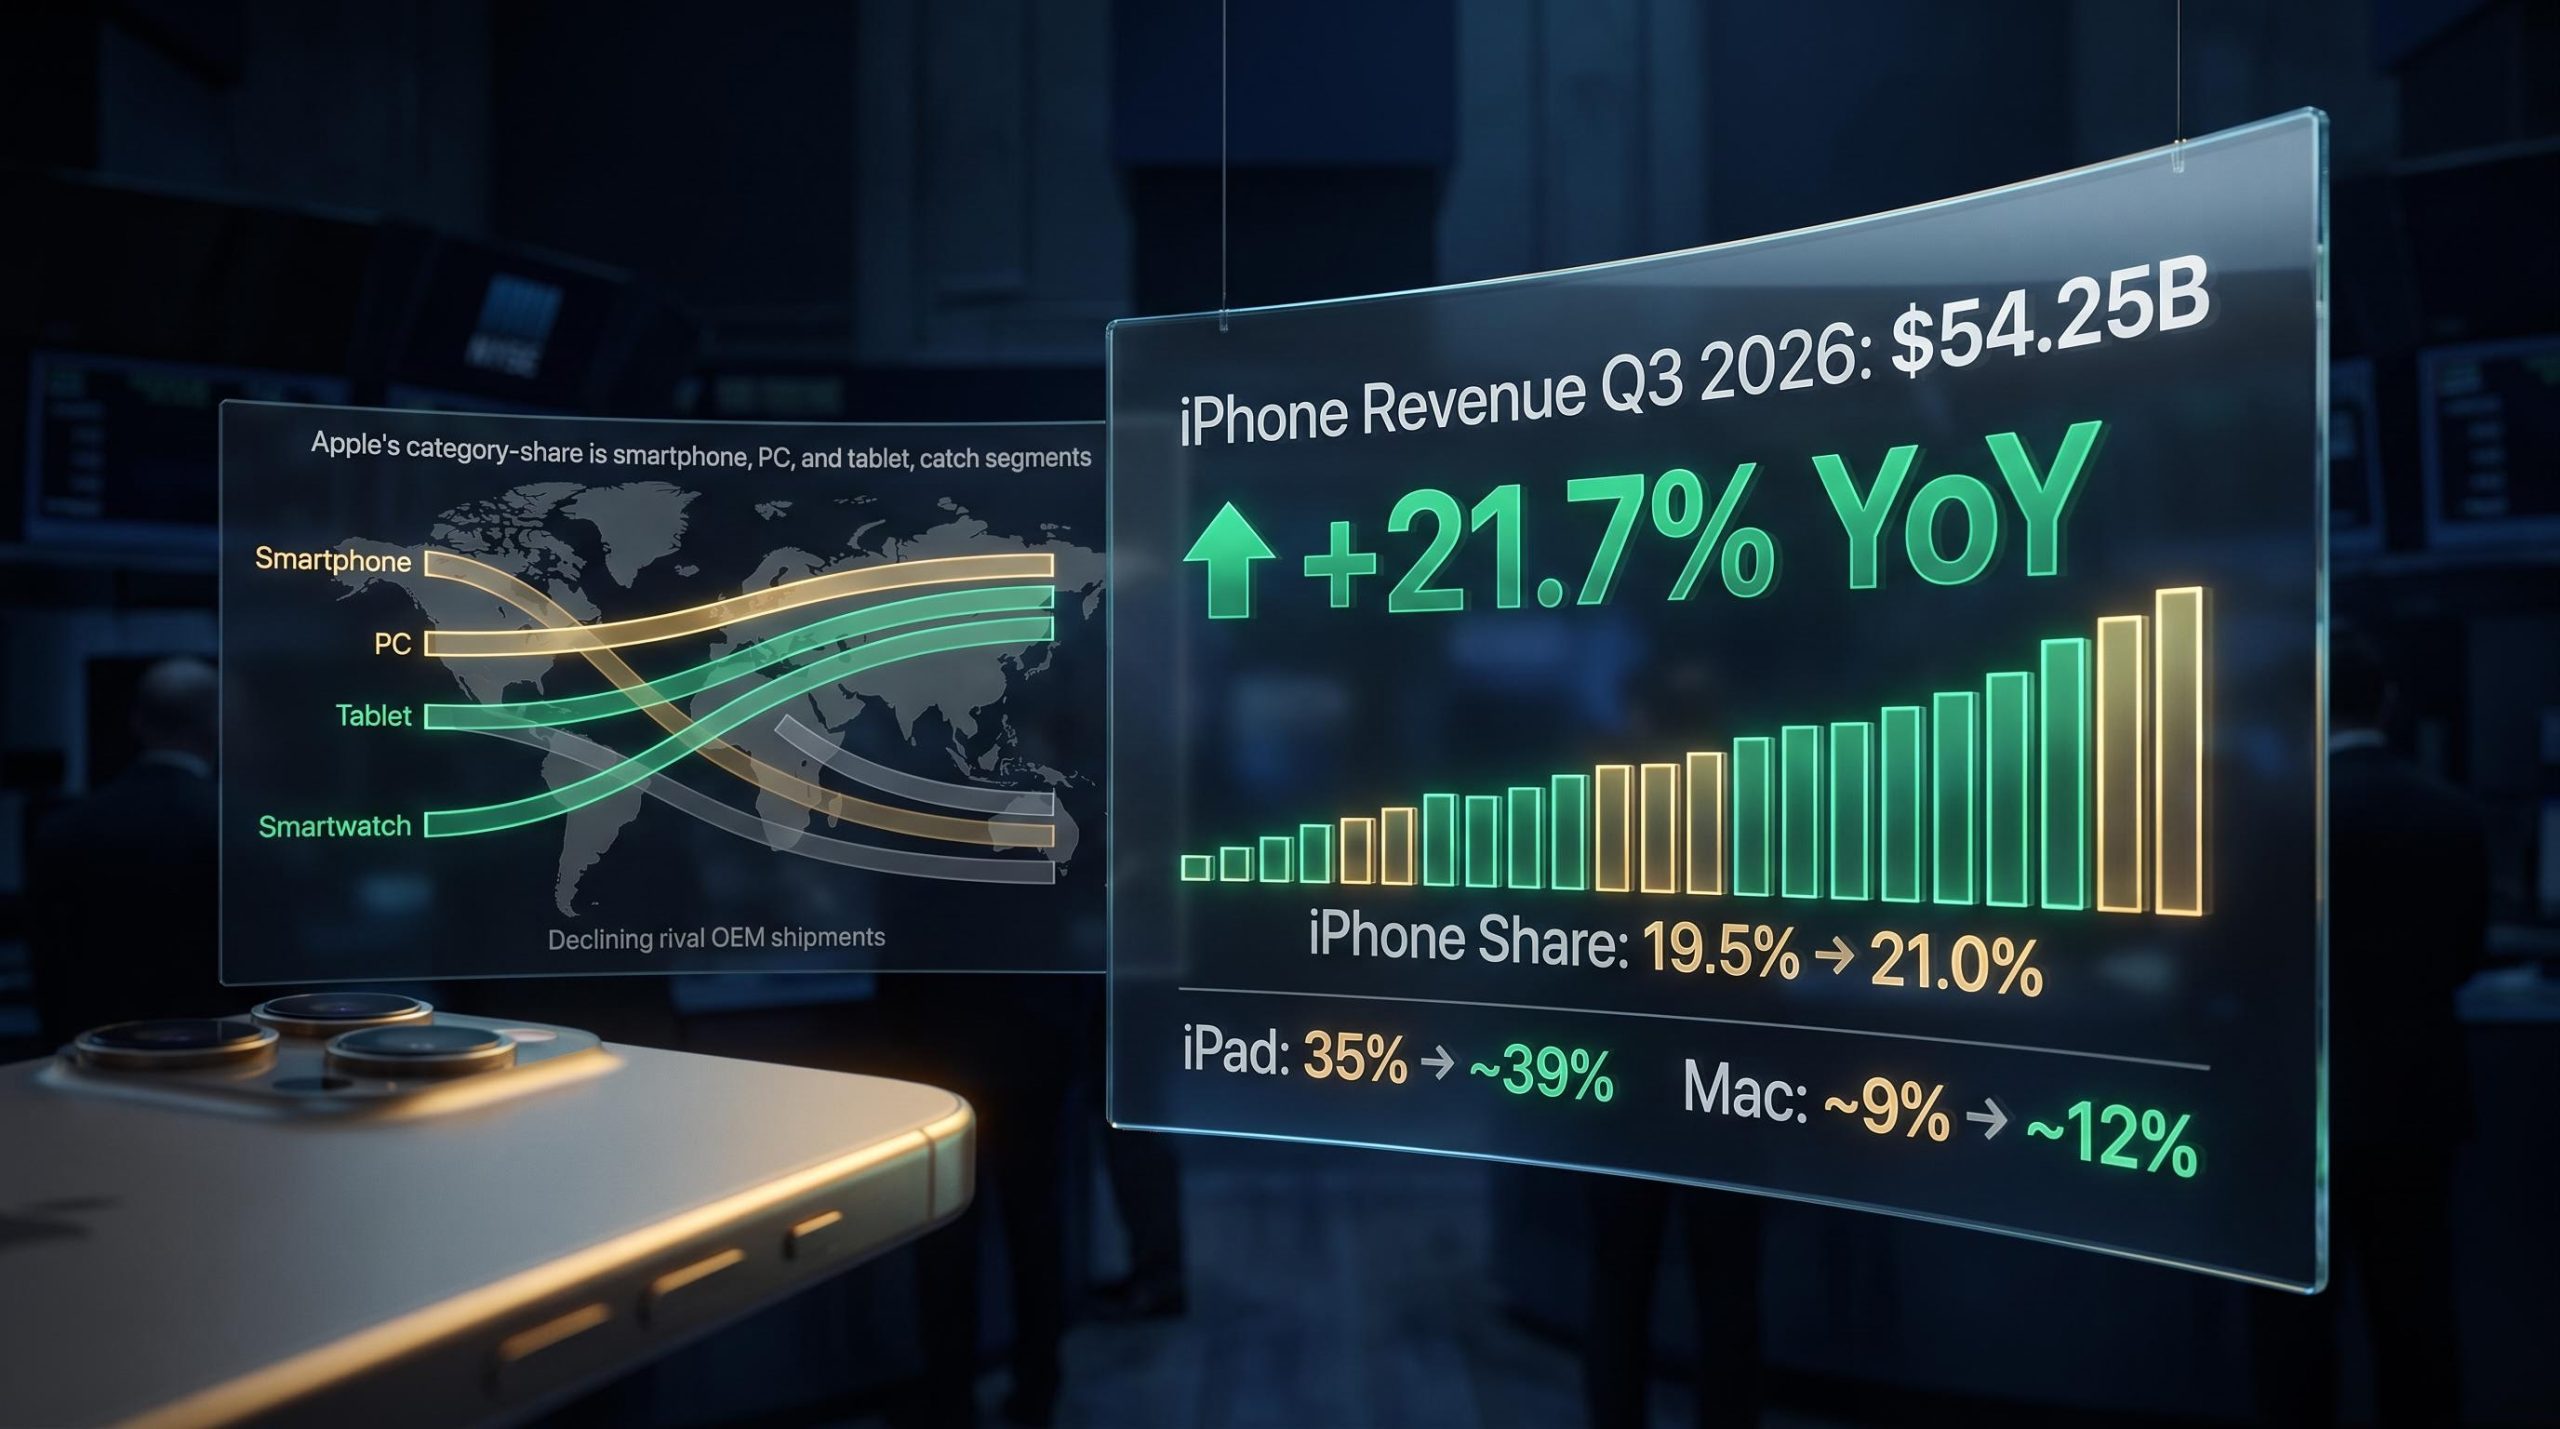
Apple’s iPhone has now delivered more than 20% year-over-year revenue growth in each of the past three fiscal quarters, a run the company has not matched since the pandemic-era upgrade wave. The conditions surrounding it look nothing like 2020.
That is what makes the 2026 hardware story analytically interesting. Apple is posting these results in one of the weakest aggregate hardware environments in years, with most major rivals seeing double-digit shipment declines. Counterpoint Research forecasts that Apple will achieve its highest-ever market share in smartphones, PCs, and tablets during 2026, with gains extending across its smartwatch segment as well, and IDC confirms the directional trend with its own tracking data. Share gains and revenue strength in a contracting market is an unusual combination, and it deserves examination on its own terms.
Here is what the data actually tells you about the structural drivers behind Apple’s multi-category breakout, the category-by-category evidence, and the forward signals that matter most for evaluating Apple’s hardware position heading into the second half of 2026 and beyond.
Why 2026 is a different kind of Apple hardware story
The distinction that shapes everything in this analysis is the difference between a share-resilience breakout and a volume supercycle. In a volume supercycle, the industry grows and all boats rise. In a share-resilience breakout, the industry contracts and the strongest competitor holds volume while rivals fall back. 2026 is the latter.
Counterpoint Research reports that most major OEMs are facing double-digit shipment declines this year, driven by component cost inflation, memory price spikes, and geopolitical headwinds. Apple’s shipments remain broadly flat. The result is record share without record volume, a larger slice of a smaller pie.
The backdrop for Apple’s share gains is a smartphone market contraction of historic depth: Counterpoint Research projects global shipments will fall 13.9% in 2026 to approximately 1.08 billion units, the lowest annual volume since 2013, with Android OEMs absorbing a disproportionate share of that decline.
Fiscal Q3 2026 iPhone revenue: $54.25 billion, up 21.7% year-over-year. Apple has now delivered more than 20% iPhone revenue growth for three consecutive quarters, a streak it has not achieved since the pandemic upgrade era.
iPhone is a partial exception to the resilience-only frame. It combines share gains with genuine, substantial revenue growth driven by premium model mix. Tablets and PCs are more purely share-gain stories, where Apple is consolidating leadership in categories that are not expanding. Knowing which type of share gain is happening in each category tells you whether the story is durable or cyclical, and that distinction matters before any of the category-specific data lands.
When big ASX news breaks, our subscribers know first
The iPhone 17 cycle as the engine of the breakout
The smartphone share forecasts converge on one conclusion, record territory, but diverge on the exact number. Counterpoint Research projects Apple reaching approximately 25% global smartphone share in 2026, up from roughly 23% in 2025. IDC forecasts full-year iOS share reaching 22%, its highest annual figure ever. IDC’s Q1 2026 tracker already shows Apple at 21.0% versus 19.5% a year earlier, the first time Apple has led a Q1 by that margin.
A separate institutional source cites Counterpoint forecasting Apple could reach approximately 28% by 2026, though that figure has not been independently confirmed.
| Source | Metric Tracked | 2025 Baseline | 2026 Forecast |
|---|---|---|---|
| Counterpoint Research | Global smartphone share | ~23% | ~25% |
| IDC (full-year) | iOS annual share | Prior year baseline | 22% (record) |
| IDC (Q1 tracker) | Q1 smartphone share | 19.5% | 21.0% |
The gap between IDC’s 22% and Counterpoint’s mid-20s range is not a data conflict to dismiss. It reflects methodology differences in how each firm counts units, regions, and operating system versus brand. That spread tells you “record share” is a band with real uncertainty at the edges, and evaluating Apple’s position means tracking which set of assumptions proves correct.
What the revenue data confirms that share forecasts cannot
Share forecasts project direction. Revenue confirms magnitude. Apple’s $54.25 billion in iPhone revenue for fiscal Q3 2026, up 21.7% year-over-year, is the empirical anchor that the share projections cannot provide on their own.
Three consecutive quarters of over 20% growth in a contracting market implies that premium mix is intact. Strong demand for the iPhone 17 Pro-tier models is driving average selling prices higher, not just unit counts. Revenue strength at this rate means Apple is not merely surviving a downturn; it is extracting more value per device sold while competitors lose volume.
Mac, iPad, and Watch: record share on harder terms
The pattern visible in smartphones repeats across Apple’s other hardware categories, with the same structural dynamic: Apple holds while the market contracts.
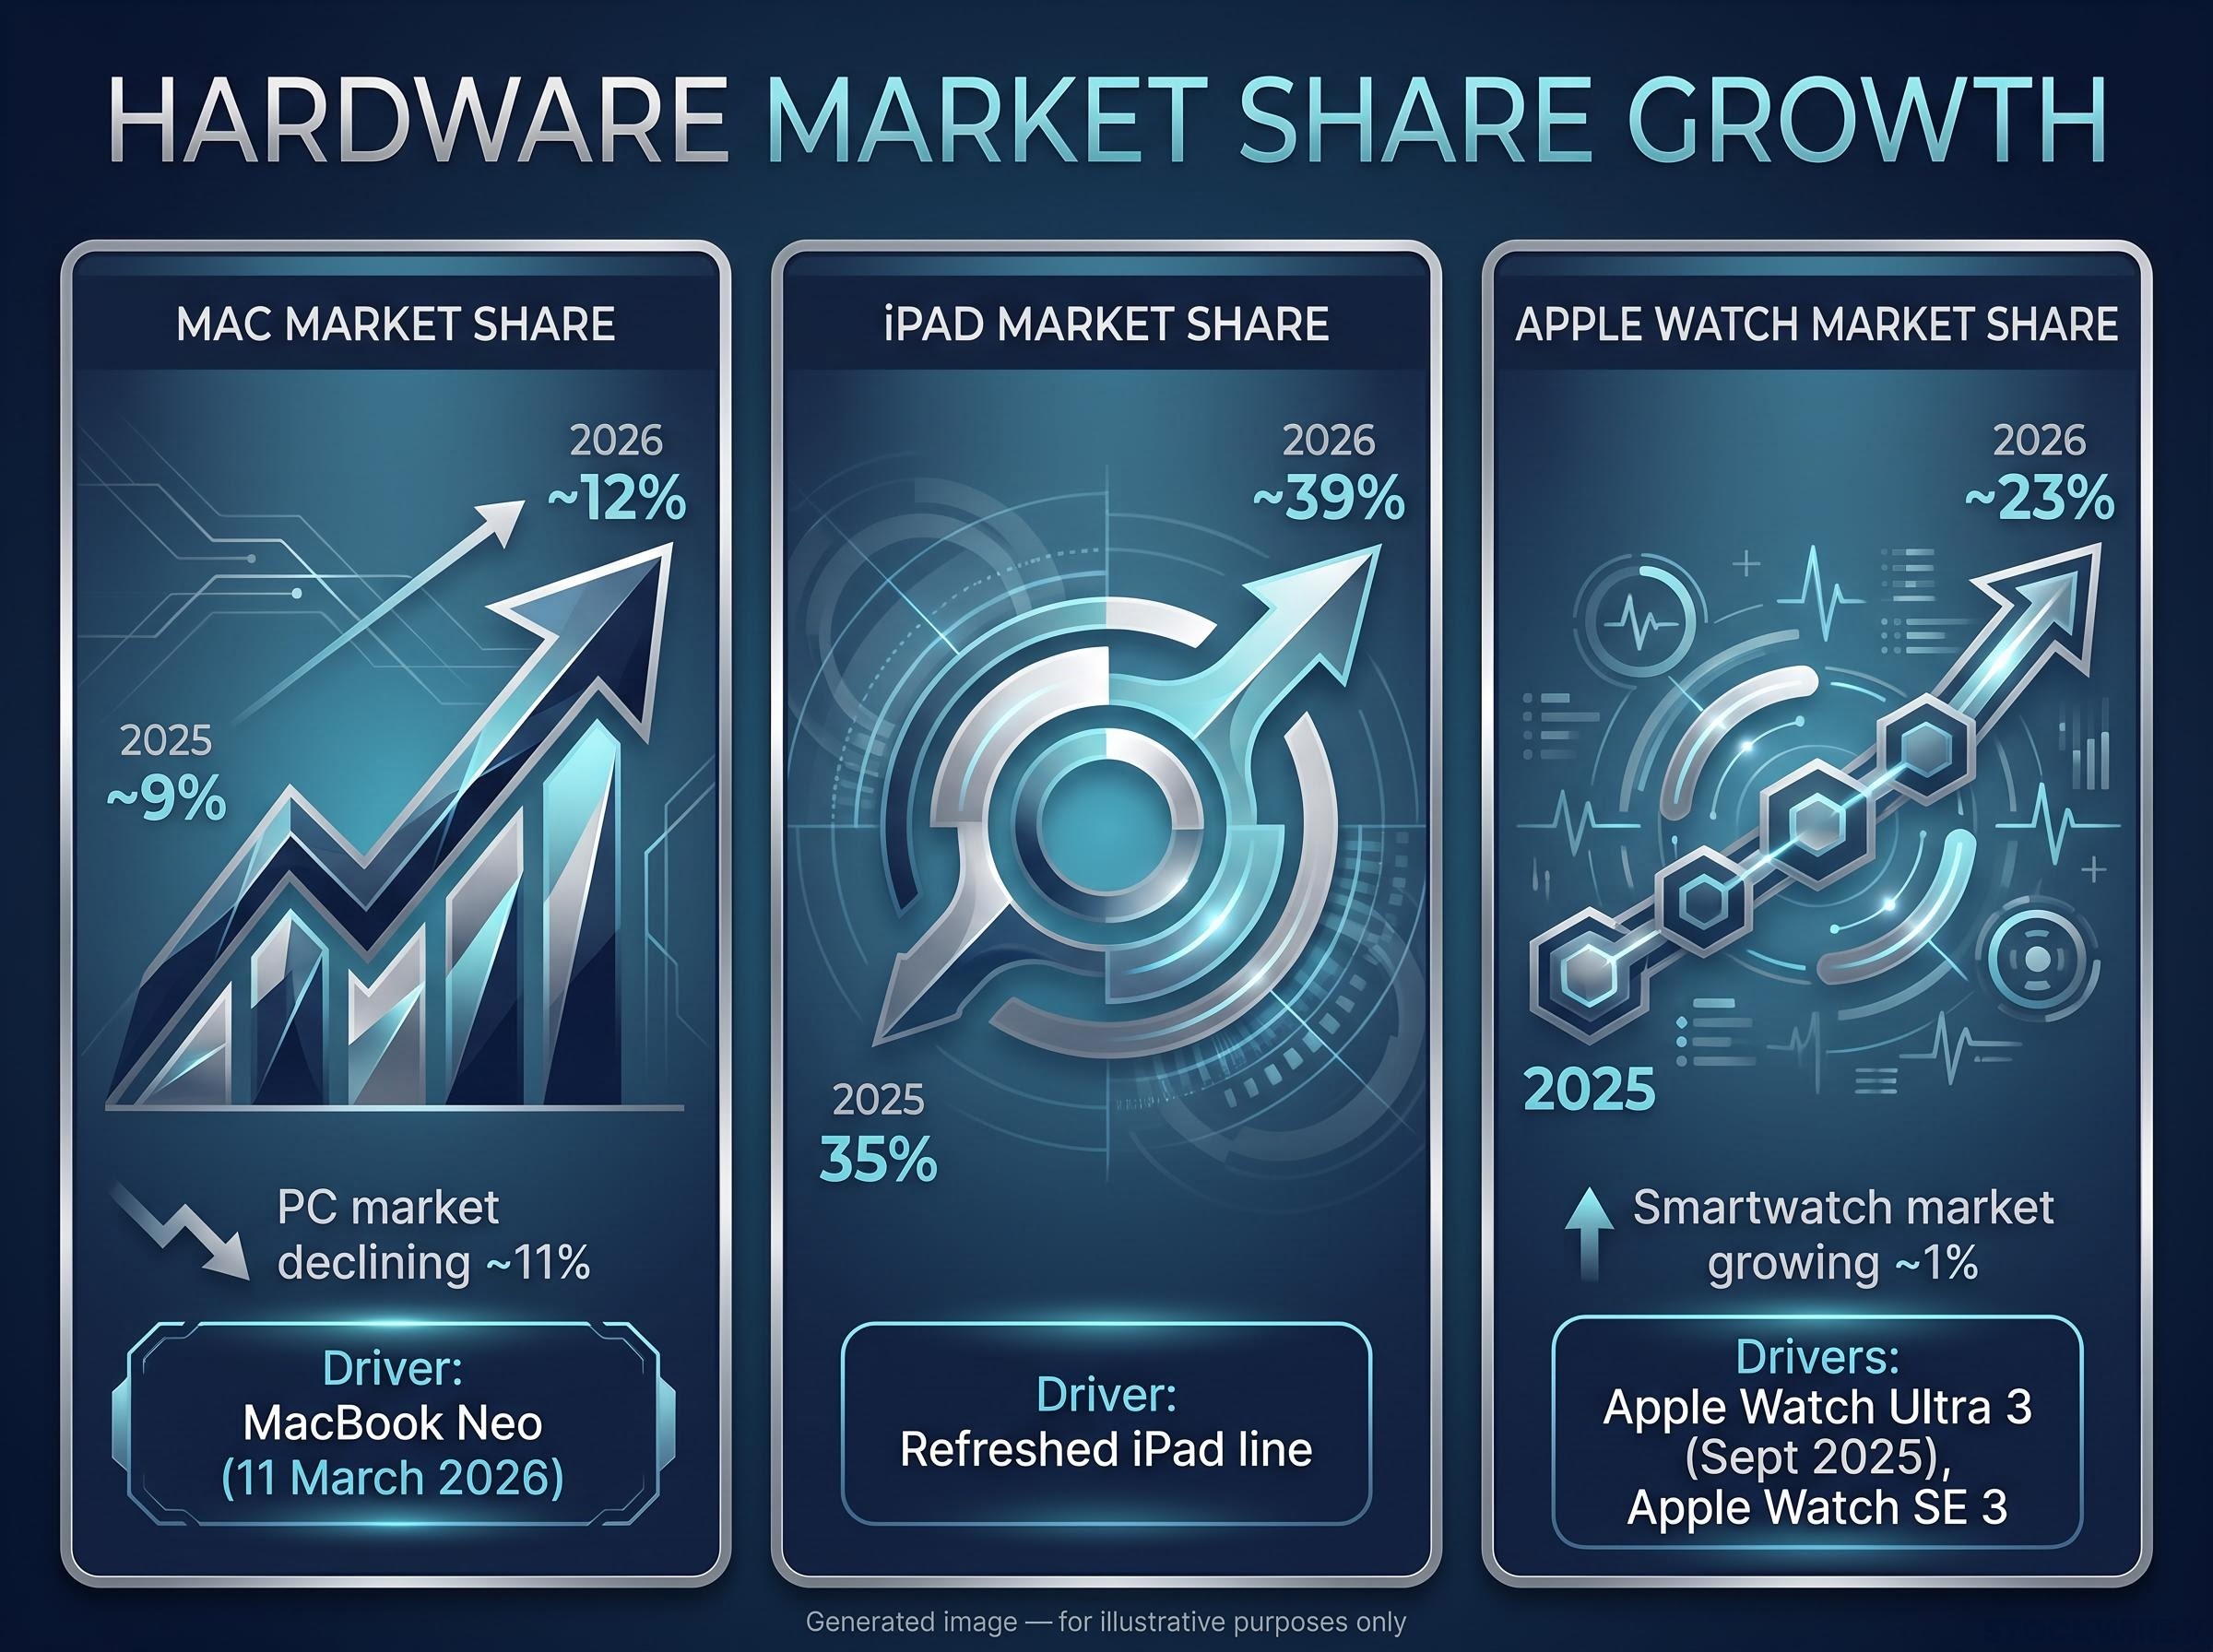
Mac is projected to reach approximately 23% share in laptops in 2026, a record, even as the overall PC market declines approximately 11%. Under a broader computer definition, Mac share rises from approximately 9% in 2025 to approximately 12% in 2026. The MacBook Neo, which began shipping from 11 March 2026, is contributing to that trajectory.
iPad share is forecast to rise from 35% in 2025 to approximately 39% in 2026. This is Apple consolidating leadership in a mature, pressured category rather than riding category expansion. The tablet market is contracting, and Apple is absorbing the share that weaker rivals are shedding.
Apple Watch is projected to grow from approximately 20% in 2025 to approximately 23% in 2026, extending an already commanding category lead. The overall smartwatch market is growing only approximately 1%, so Apple is outpacing a near-flat market rather than setting a new all-time record from a lower base.
| Category | 2025 Share Estimate | 2026 Forecast |
|---|---|---|
| Mac (broader PC definition) | ~9% | ~12% (record) |
| iPad | 35% | ~39% (record) |
| Apple Watch | ~20% | ~23% |
| Market context | PC market declining ~11%; smartwatch market growing ~1% | |
Products driving each category gain:
- Mac: MacBook Neo (shipping from March 2026), next-generation Apple silicon
- Apple Watch: Apple Watch Ultra 3 (launched September 2025), Apple Watch SE 3
- iPad: Refreshed iPad line across price tiers
When four product categories move to record or near-record share simultaneously in a down market, the explanation is structural, not coincidental. Ecosystem effects, premium positioning, and product-cycle alignment are reinforcing one another across the entire hardware portfolio.
The structural engine behind simultaneous gains across four categories
The evidence establishes what is happening. The more useful question is why it is happening at the same time across four categories.
- Ecosystem lock-in. Features like iMessage, AirDrop, Handoff, Continuity Camera, and cross-device services make Apple devices more valuable in combination than alone. Once a household owns multiple Apple products, switching costs rise with each additional device. This is measurable in behaviour: multi-device Apple households tend to renew across categories simultaneously, which is exactly the pattern the 2026 data reveals.
Ecosystem switching costs are the structural variable that makes Apple’s multi-category share gains durable rather than coincidental: the same analytical framework that explains why iMessage, Handoff, and Continuity Camera raise household churn costs also explains why hardware companies with deep platform ownership can compound value across cycles the way software businesses historically have.
- Premium-tier concentration. IDC’s projection that iOS volumes decline only approximately 5% in 2026 versus steeper drops for the broader market implies Apple is over-indexed to a more resilient, higher-income customer segment. These buyers defer upgrades less aggressively than the mass market when the economy tightens. For a US investor, that translates directly into lower churn and a structural floor on revenue per customer.
- Product-cycle alignment. The iPhone 17 cycle, MacBook Neo, and refreshed iPad line all landed in the same 12-month window. Whether deliberate or fortunate, that synchronisation concentrates demand across categories and amplifies the ecosystem effect, because a customer upgrading one device is prompted to consider refreshing others.
Counterpoint characterises Apple as better positioned than peers in the current memory-price environment to manage component costs, which adds a margin dimension to the structural advantage. Apple is not just holding share; it is holding share while protecting profitability.
What hardware share gains mean for Apple’s services trajectory
Each additional device share point in 2026 does not just show up in hardware revenue. It expands the addressable base for Apple’s services layer, and that expansion has multi-year earnings consequences.
More iPhones, Macs, iPads, and Watches in active use directly grow the market for:
- iCloud storage subscriptions
- Apple Music and Apple TV+ streaming
- Apple Arcade gaming
- AppleCare extended service plans
- App Store spending
Services and App Store growth are cited alongside the iPhone 17 cycle and AI-related features as key pillars of AAPL’s valuation in 2026-2027. The hardware share records in 2026 are effectively a leading indicator of services revenue scale in 2027 and 2028, not a one-off product-cycle outcome.
The condition that makes this flywheel compelling rather than theoretical: services attach rates, meaning subscriptions per active device, need to continue rising alongside the installed base. Strong hardware share gains with flat or declining attach rates would be less compelling. The compounding only works if both move up together.
Services revenue trajectory, not hardware replacement cycle timing, is the variable that institutional models are anchoring to for the 2027-2028 period: Citi research confirms the average iPhone replacement cycle holds at approximately four years with no AI-driven compression, which means the compounding flywheel discussed here depends on attach-rate growth rather than an accelerated upgrade wave.
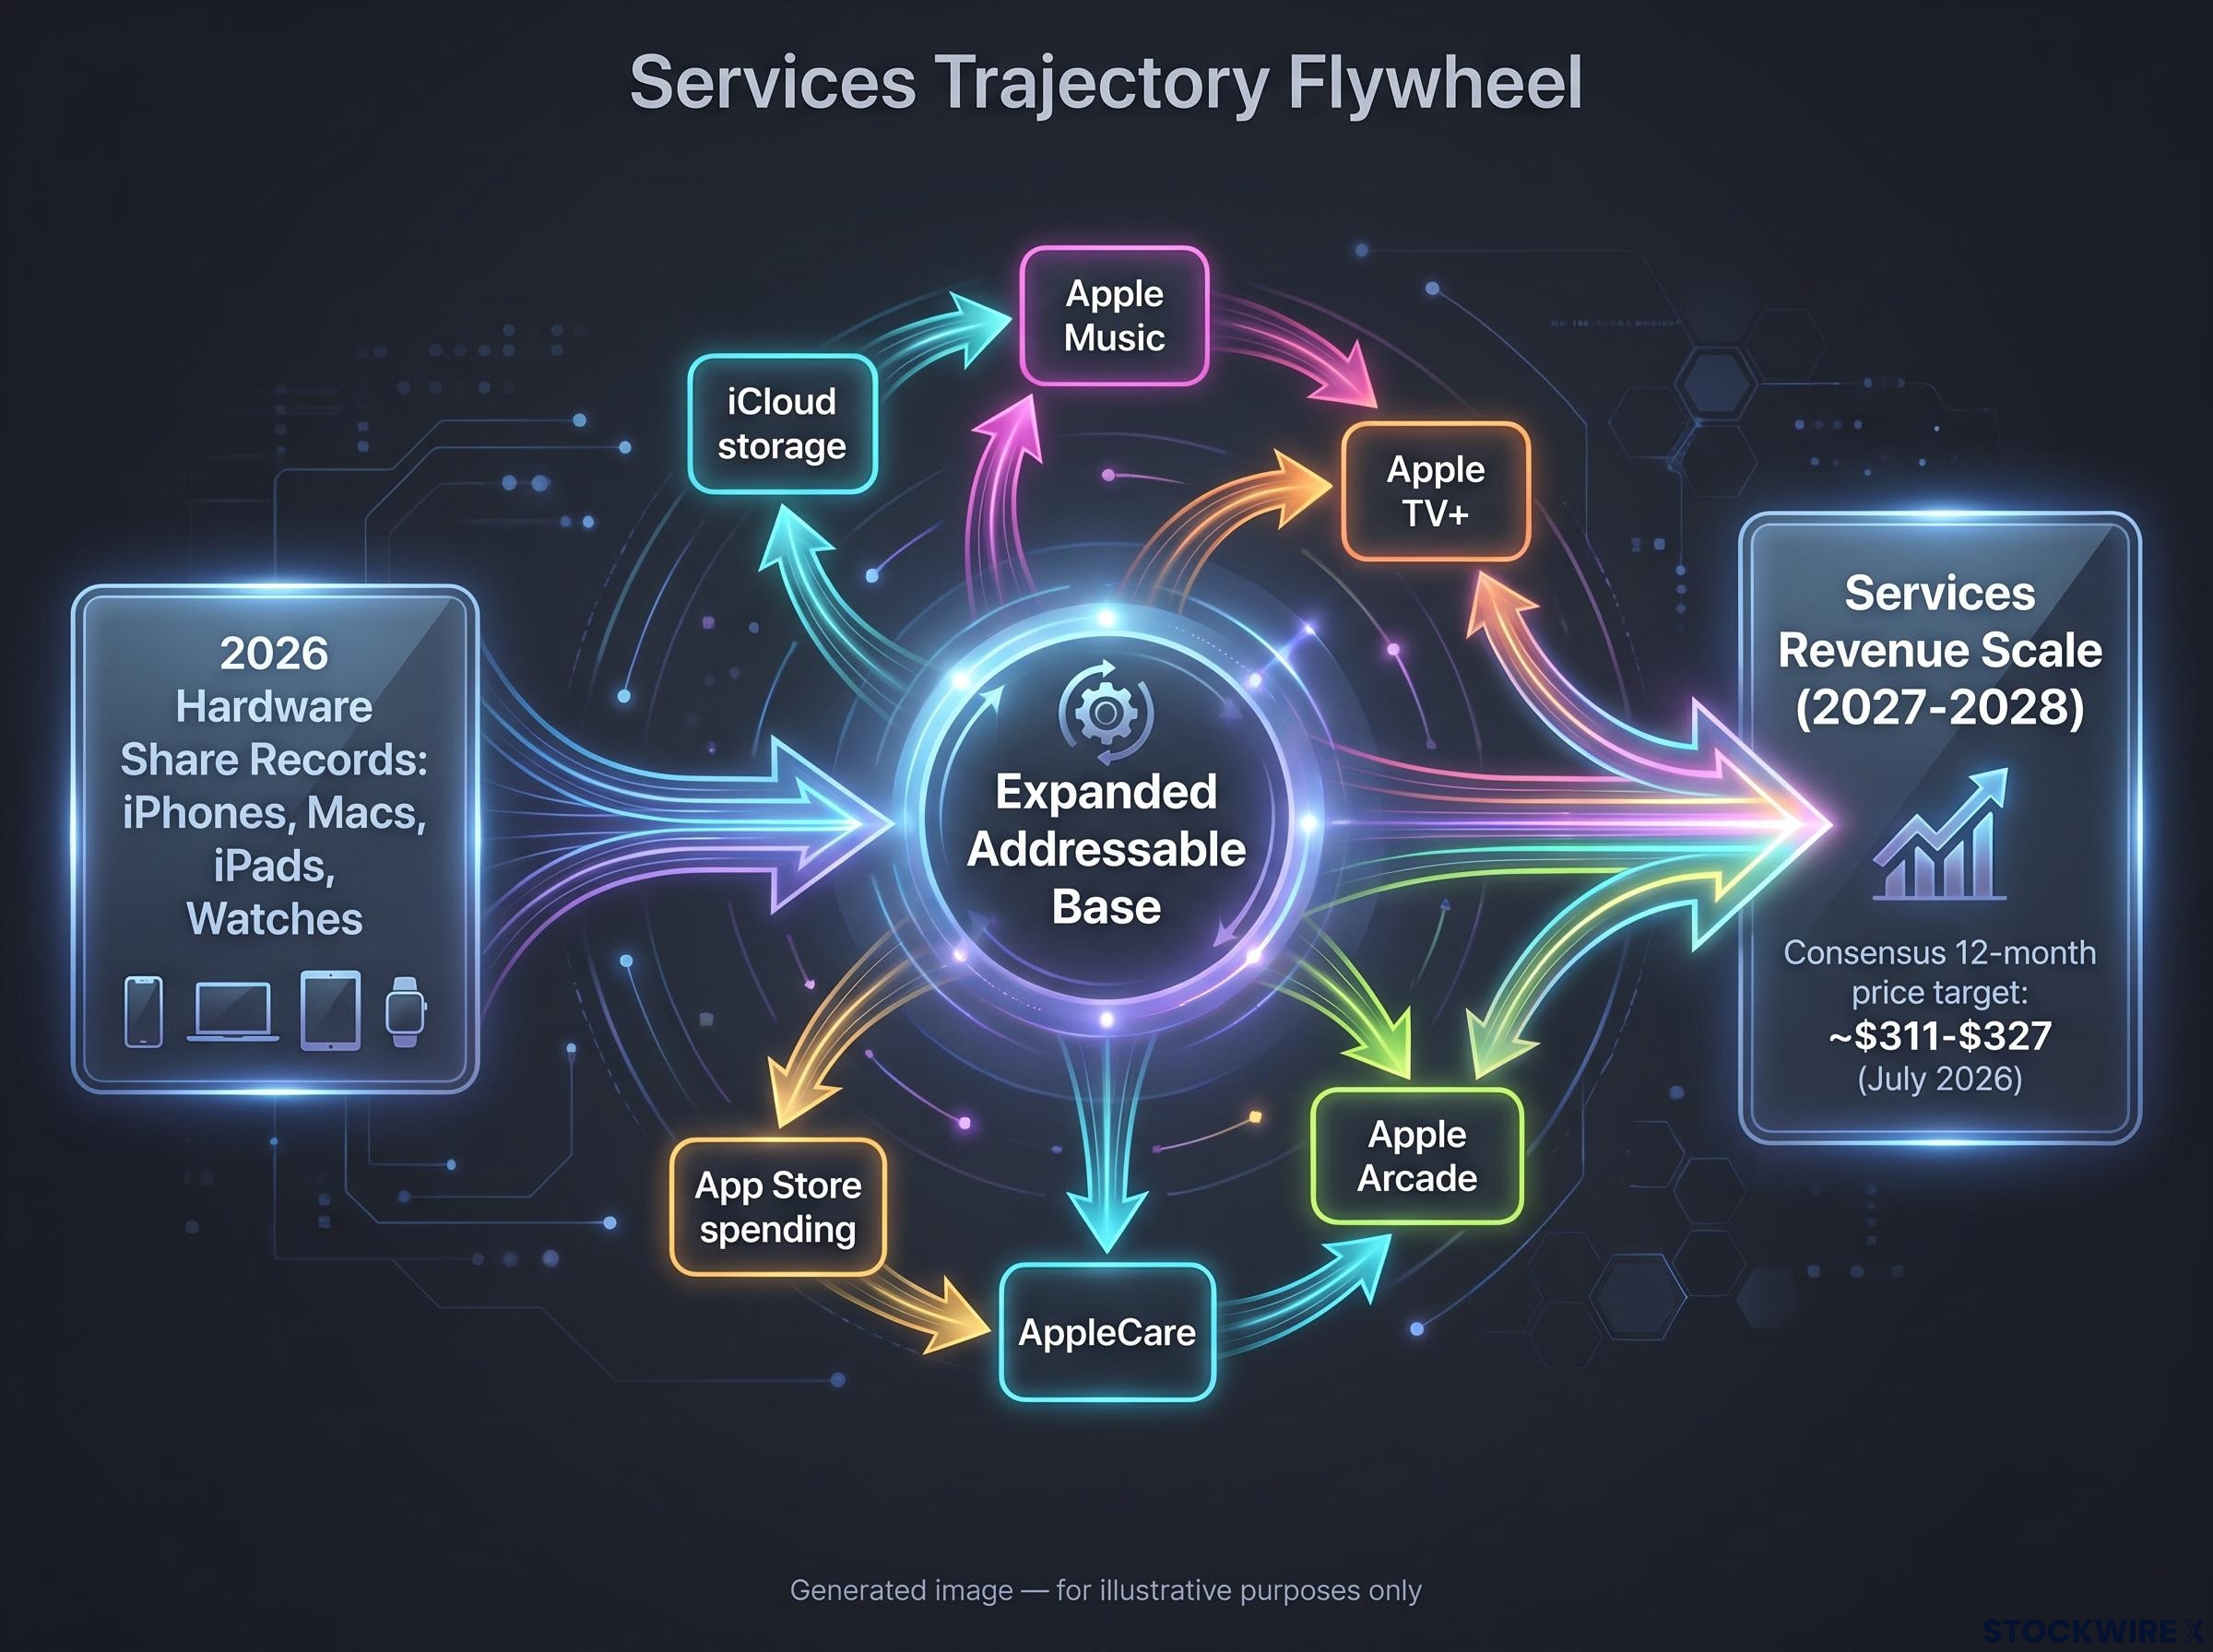
Analyst consensus 12-month price target: approximately $311-$327, with highs around $400 and lows around $200-$250 (as of July 2026). Institutional coverage from firms including Morgan Stanley, Citi, Goldman Sachs, and Wedbush cites the iPhone 17 cycle, services growth, and AI features as key drivers. These specific figures should be treated as approximate; not all have been independently confirmed.
For a US investor, the hardware share story and the services growth story are not separate investment theses. They are the same thesis operating on different time horizons, and the 2026 hardware gains set the ceiling on the 2027-2028 services opportunity.
The signals that will confirm or challenge the 2026 thesis
The structural case is strong, but it remains a forecast until the data confirms it. Three signals matter most through H2 2026 and into fiscal Q1 2027:
- iPhone share trajectory and Pro-mix concentration. Does the three-consecutive-quarter streak of over 20% revenue growth extend to four in fiscal Q4 2026? Do Pro-tier configurations remain a dominant share of the mix, supporting average selling prices?
- iPad and Mac actual share versus forecast. Do iPad and Mac actually hit the projected record share levels (approximately 39% and 12-23% respectively) as overall industry shipments arrive? The MacBook Neo’s demand trajectory relative to Windows PCs is a specific indicator to watch.
- Services attach rate movement. How rapidly do services revenues grow relative to hardware, and do attach rates per active device continue rising? This is where the compounding thesis either proves out or plateaus.
The holiday quarter is the real test. If smartphone share reaches record territory through that period and Apple maintains premium hardware mix, fiscal Q1 2027 earnings would likely confirm the 2026 story as structural rather than cyclical.
The risks that could interrupt the thesis:
- A macro slowdown hitting premium discretionary spending disproportionately
- A sustained component or memory cost spike pressuring margins
- Competitive responses from Samsung, Chinese OEMs, or Google Pixel limiting the upper bound on share gains
- The forecast methodology spread itself: IDC at 22% versus Counterpoint in the mid-to-high-20s range means “record share” carries real definitional uncertainty
Memory cost pressures represent the most material near-term threat to the profitability side of Apple’s share-gain story: Tim Cook confirmed to the Wall Street Journal that costs are ‘no longer sustainable,’ with Mac and iPad lines carrying the highest per-unit exposure given their memory and storage configurations.
What the 2026 breakout actually signals about Apple’s competitive position
Apple is gaining record or near-record share across four product categories simultaneously in a contracting market, while also delivering exceptional revenue growth in its largest segment. That combination is the clearest signal of structural competitive health rather than cyclical luck.
More users per category in 2026 means a larger services monetisation base in 2027 and 2028. Apple’s pricing power and ecosystem lock-in suggest that installed base translates to revenue more reliably than for most hardware peers. The data from both Counterpoint Research and IDC confirms the multi-category breakout pattern; the question is magnitude, not direction.
The honest ceiling on this story is that much of Apple’s quality and resilience is already embedded in the valuation at current price levels. The real question is not whether Apple is gaining ground but whether the timeline and magnitude of the forecasts are close enough to consensus expectations to drive outperformance from here.
Apple has posted more than 20% iPhone revenue growth for three consecutive quarters, a run not seen since the pandemic upgrade era. That is the single clearest data point to carry out of this analysis.
The investment upside depends on execution through H2 2026 and whether services growth confirms the installed-base expansion. The structural position is strong. The price for that strength is already partially paid.
This article is for informational purposes only and should not be considered financial advice. Investors should conduct their own research and consult with financial professionals before making investment decisions. Past performance does not guarantee future results. Financial projections are subject to market conditions and various risk factors.