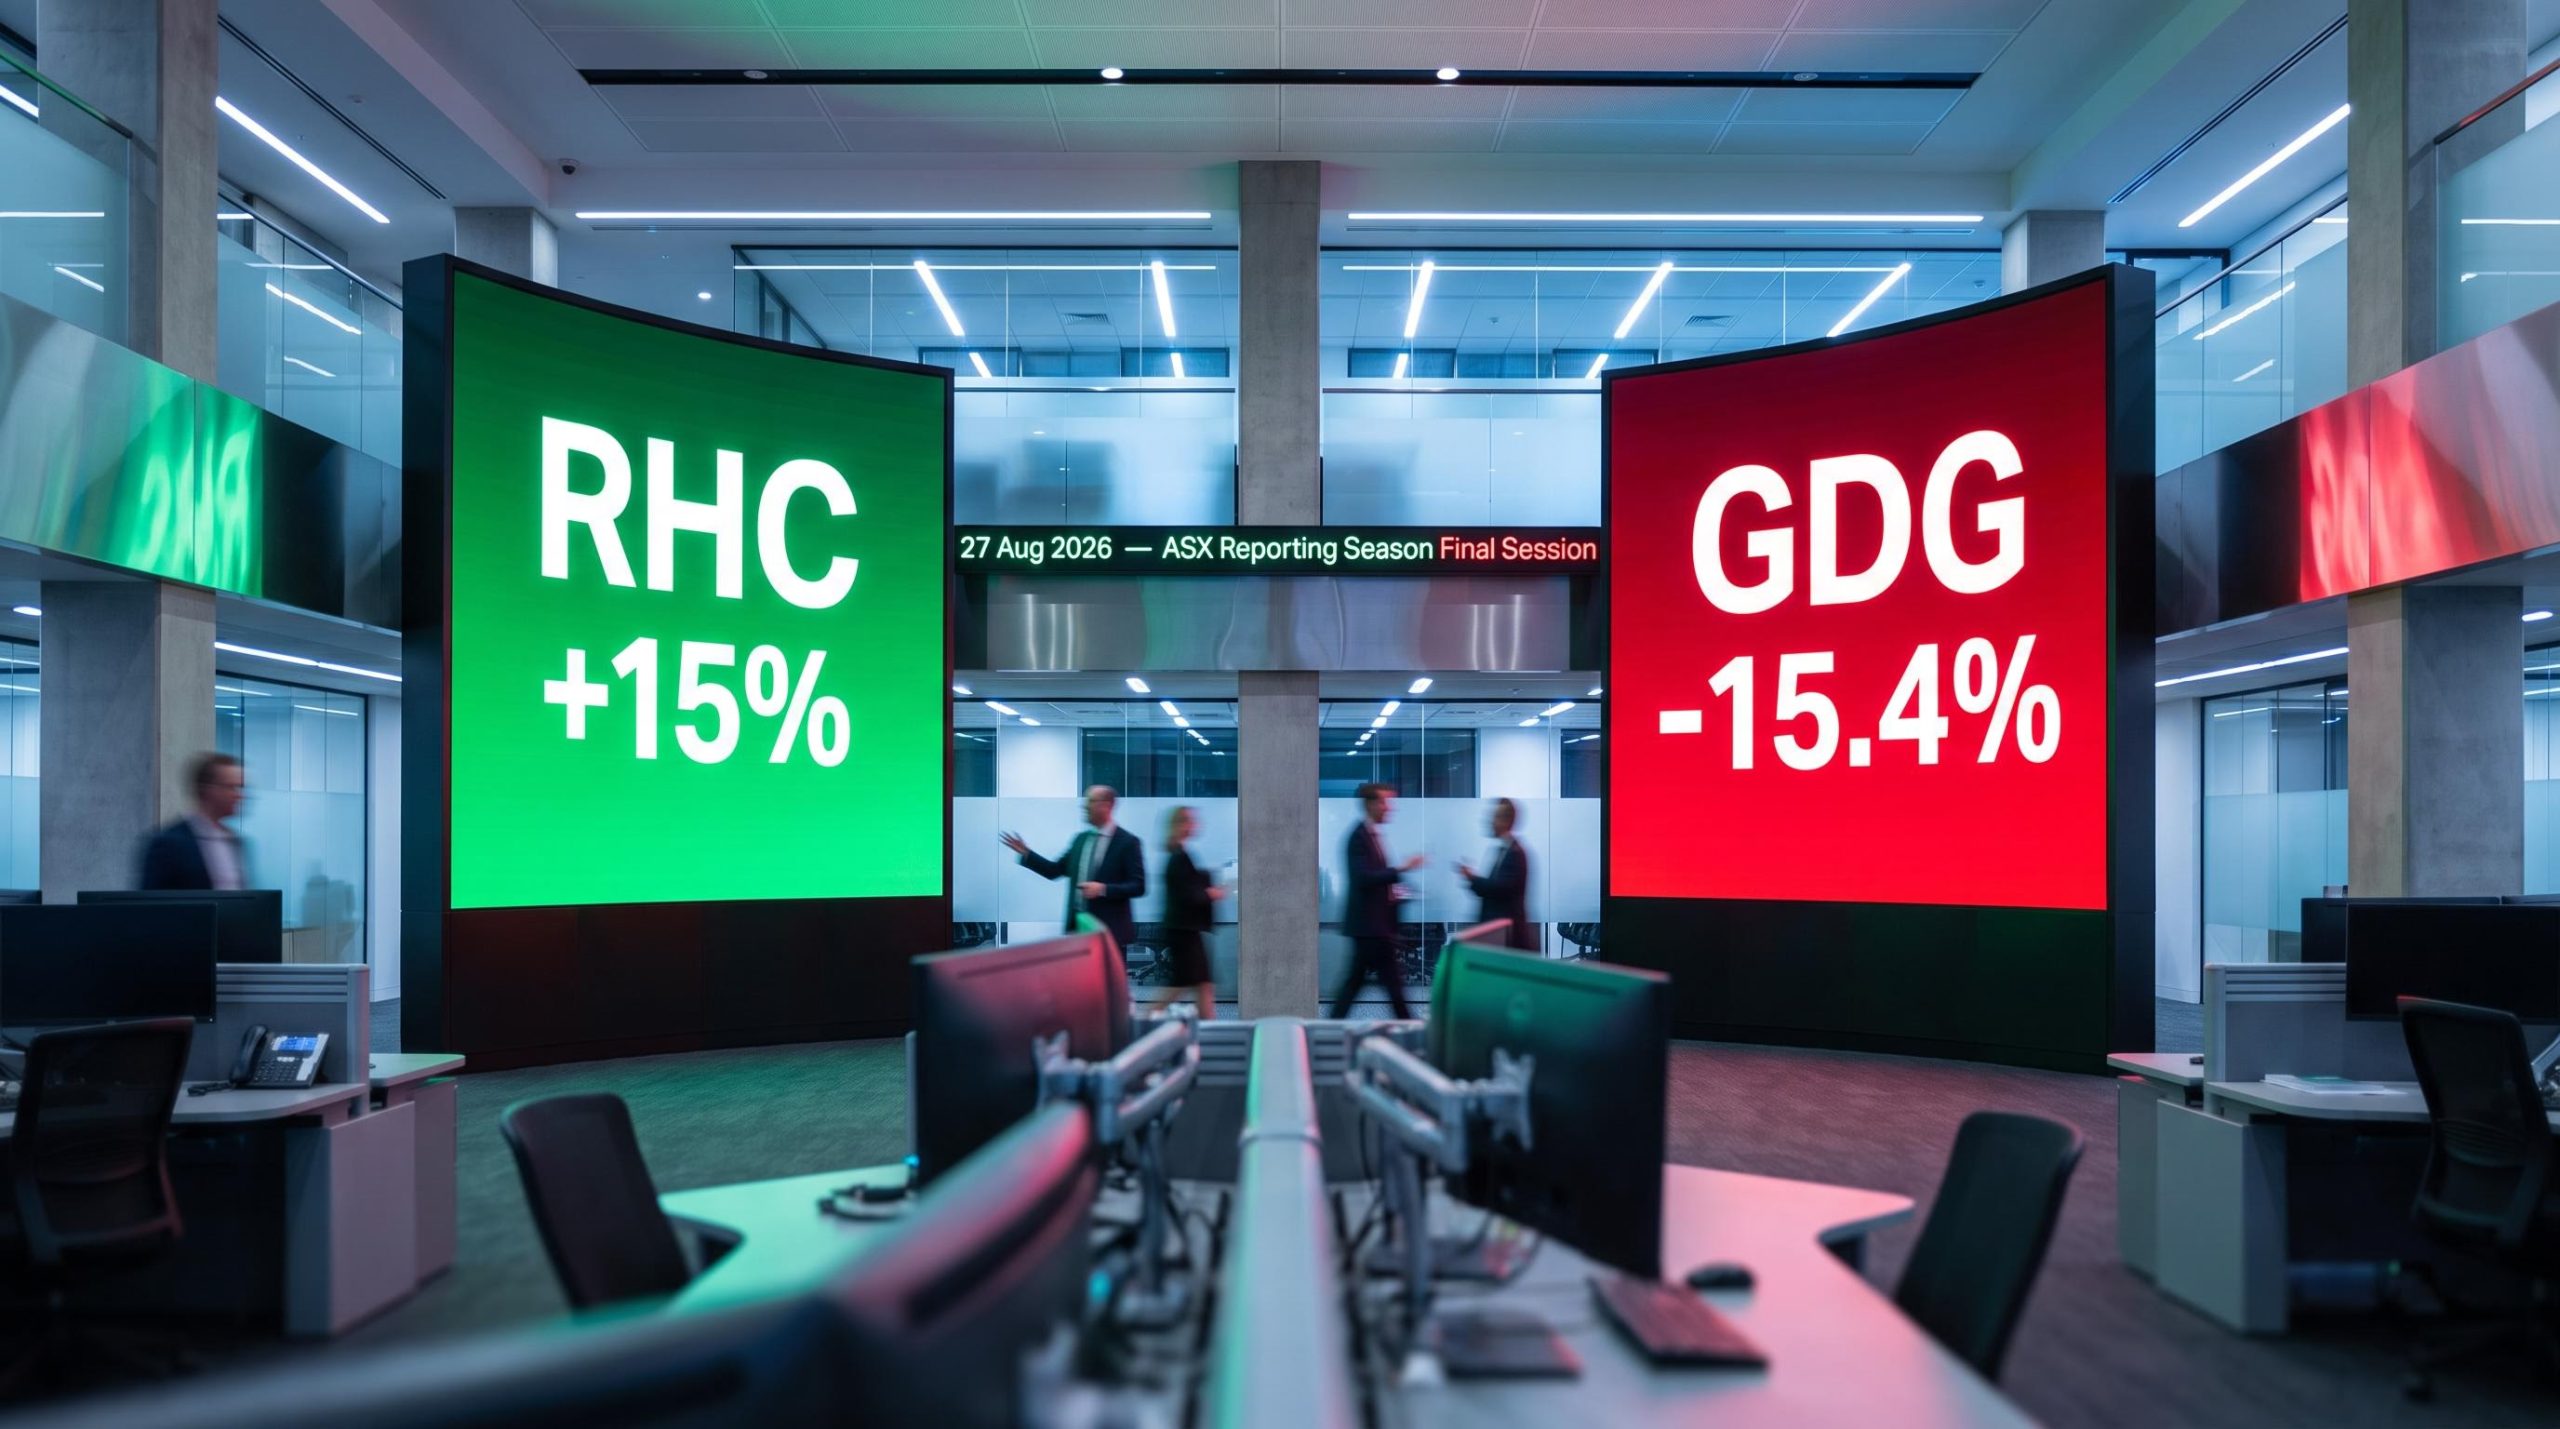
“A company grew its profit 23% and watched its share price collapse 15% in a single session. The headline number looked like a win. The market treated it like a loss.\n\nThat paradox played out on 27 August 2026, the final day of the August ASX reporting season, when the heaviest cluster of large-cap results landed simultaneously. Ramsay Health Care, Qantas, Wesfarmers, and a string of financial and consumer names all reported in the same session, concentrating cross-stock sentiment and event risk into a few hours of trading.\n\nHere is what the day’s most extreme moves actually tell you about how to read the next reporting season: why some stocks rose on declining profits and others fell despite beating consensus, and why understanding that logic is what separates reactive investors from prepared ones.\n\n## Ramsay’s 52-week high and Qantas’s unlikely gain: what the winners had in common\n\nThe day’s strongest performers shared a thread worth naming before the numbers explain it. Each gave the market something it had not expected, and that surprise, not the absolute profit figure, is what moved the price.\n\n- Ramsay Health Care (RHC): Underlying NPAT of A$364.1 million, up 22.9%, against a consensus estimate of A$314.5 million. Share price surged approximately 15% to around A$51, near a 52-week high. Dividend lifted approximately 13-14% to 91 cents per share.\n- Qantas (QAN): Underlying NPAT of A$1.402 billion, down 24% year-on-year. Share price rose 4.8% to A$9.66. FY27 EBIT guidance of 5-7% growth. Citi retained Buy at A$11.40; UBS retained Buy at A$11.15.\n- Tasmea (TEA): Underlying NPAT of A$73.7 million, up 42%, above company guidance of A$72.5 million. Share price gained 6.6% to A$9.81.\n\n> A$364.1 million underlying NPAT against a A$314.5 million consensus estimate, a gap wide enough to reprice the stock by approximately 15% in a single session.\n\nRamsay’s result was the day’s clearest example of an earnings surprise resetting a company’s valuation in real time. The beat was not marginal. It was approximately 16% above what analysts had modelled, and it demonstrated that the hospital operator’s lengthy rehabilitation from post-COVID staffing disruption had conclusively gained traction. Revenue, margins, and leverage all moved in the right direction simultaneously. The market re-rated the stock in a single session because the result shifted what investors believed about the next 12 months, not just because FY26 was strong.\n\nQantas is the more instructive case. A 24% profit decline looks like a sell signal if you read only the headline. But institutional investors are pricing the next 12-24 months, not the year just reported. The 5-7% FY27 EBIT growth guidance told the market the earnings trajectory had turned. The profit decline was already known and priced. The guidance was new information, and new information is what moves stocks.\n\nTasmea confirmed the same pattern in the small-cap universe: beat your own guidance, beat what the market expected, and the share price follows.\n\nThe connecting thread is straightforward. A result only moves a share price to the extent it shifts what investors believe about the future. The market is pricing tomorrow, not yesterday.\n\n## Why beating consensus still sent some stocks down double digits\n\nIf beating consensus guaranteed a positive share price reaction, the day’s losers would make no sense. They do make sense, once you understand what was already priced in before the result arrived.\n\nThe earnings expectations gap operates identically across markets: with 84% of S&P 500 companies beating EPS estimates in Q1 2026, well above the 10-year average of 76%, the market had already learned to anticipate beats, which reduced their power to generate incremental gains and produced the same paradox visible in ASX names on 27 August.\n\n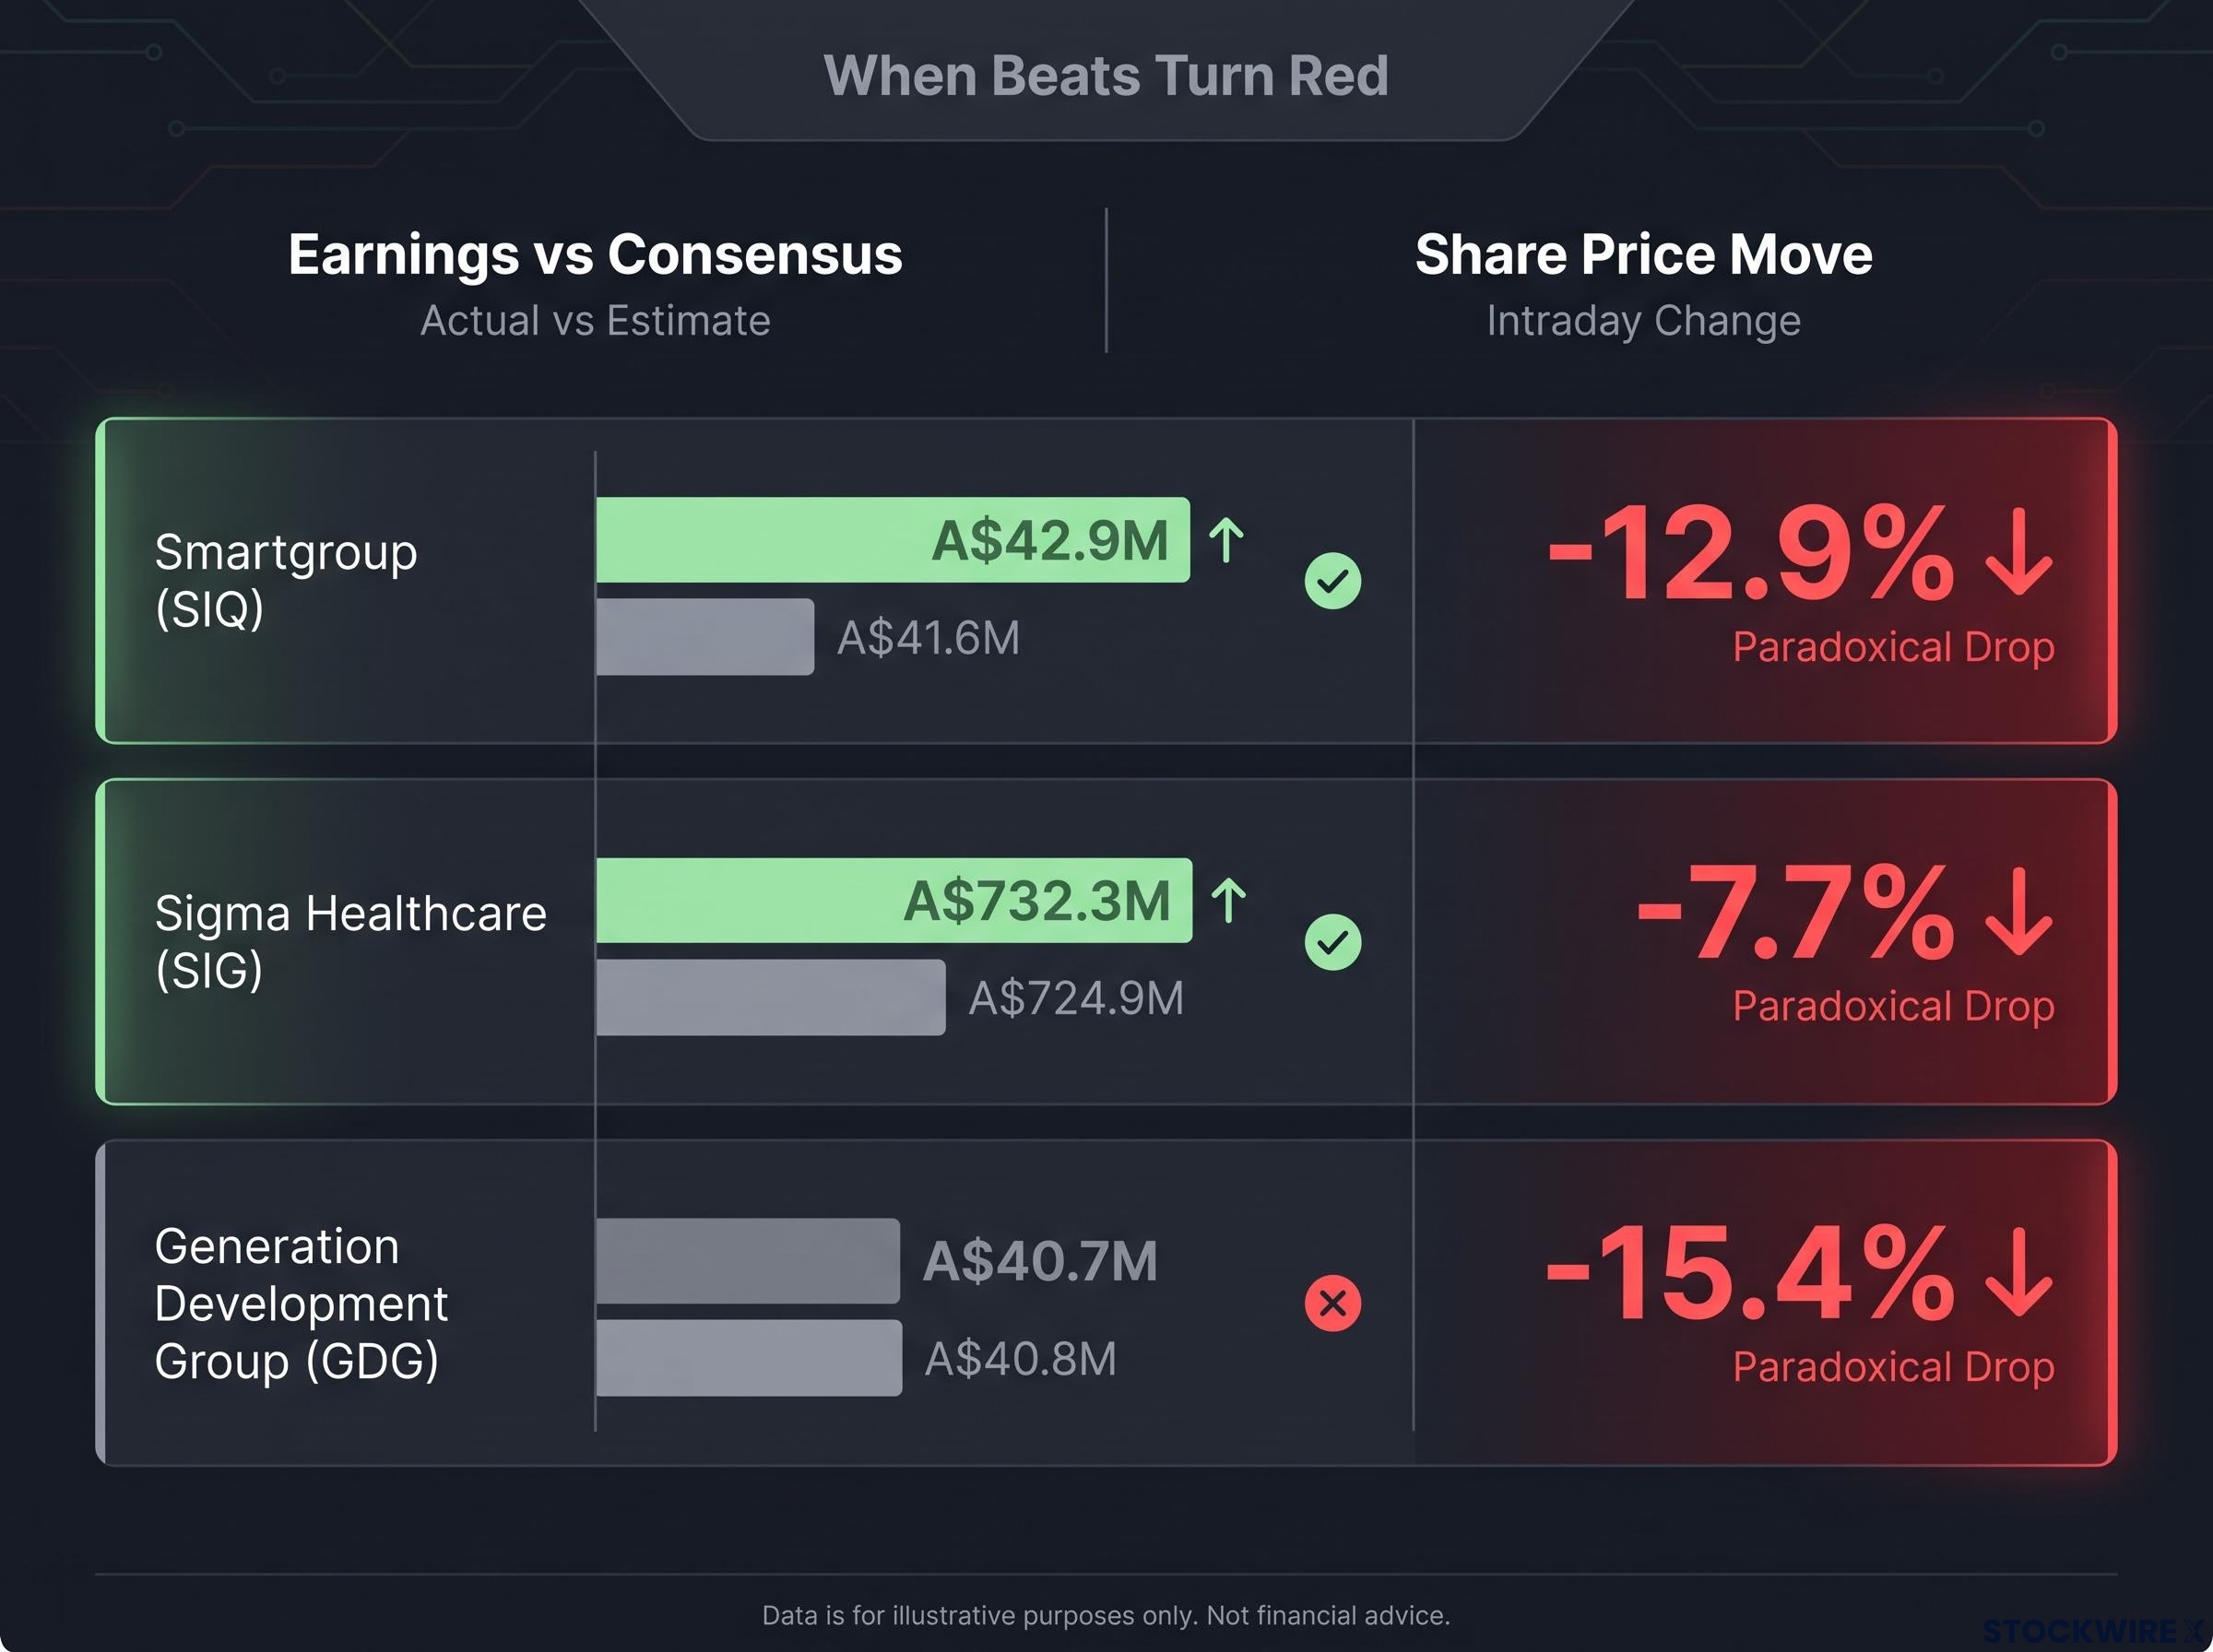 \n\n
\n\n
| Stock | Result vs consensus | Share price move | Key reason for fall |
|---|---|---|---|
| Smartgroup (SIQ) | A$42.9M vs A$41.6M (beat) | -12.9% to A$11.30 | Market had priced in a larger beat; valuation stretched entering result |
| Sigma Healthcare (SIG) | A$732.3M vs A$724.9M (beat) | -7.7% to A$2.62 | Expectations already embedded in pre-result price; beat insufficient to extend |
| Generation Development Group (GDG) | A$40.7M vs A$40.8M (fractional miss) | -15.4% to A$3.25 (52-week low) | Rising costs, flat EPS from dilution, statutory NPAT fell ~10% |
| Lovisa (LOV) | Beat (per broker commentary) | -2.6% after +5.2% prior day | Pre-result price surge raised the threshold; two broker downgrades |
\n
\n\nSmartgroup beat consensus cleanly, reporting underlying NPAT of A$42.9 million (up 11%) against a A$41.6 million estimate. The stock fell 12.9%. The beat was real. It simply was not large enough to justify where the stock was trading before the result.\n\nSigma Healthcare told the same story at a larger scale. Underlying NPAT of A$732.3 million, up 22.3%, beat the A$724.9 million consensus. The stock fell 7.7% to A$2.62. When the market has already priced in a strong result, delivering that result is table stakes, not a catalyst.\n\nGDG is the starkest case. Underlying NPAT grew 21% to A$40.7 million, missing the A$40.8 million consensus by roughly A$100,000. The stock fell 15.4% to a 52-week low. But the decimal-point miss was only the surface. Statutory NPAT fell approximately 10% to A$31.9 million. Rising costs compressed margins. Share issuance left underlying earnings per share flat despite the profit growth. Investors saw multiple reasons to sell simultaneously, and they did.\n\n### When the share price rises before the result does\n\nLovisa came into 27 August carrying a 5.2% gain from the previous session, built on anticipation ahead of its FY results. That pre-result price appreciation raised the bar the actual numbers needed to clear. When the results landed, they were unable to sustain the momentum. The stock fell 2.6%. Macquarie downgraded to Neutral from Outperform at A$29.25; Morgans downgraded to Accumulate from Buy at A$31.00.\n\nThis is the \”buy the rumour, sell the fact\” dynamic in real time. When a stock runs hard into a result, the result must beat not just consensus but the elevated expectation embedded in the pre-result price action.\n\nTaken together, these four stocks tell you that a consensus beat is a necessary but insufficient condition for a positive share price reaction. Valuation positioning and pre-result price action are often the deciding variables.\n\n## What broker actions reveal about the gap between analyst models and market reality\n\nBroker ratings are among the most widely cited inputs in retail investment decisions. The day’s data suggests you should use them more carefully.\n\nStart with Ramsay. Despite an approximately 15% single-session gain and a price near a 52-week high around A$51, Citi retained a Neutral rating with a price target of A$42.00, placing the broker’s target approximately 20% below where the stock was already trading. The market re-rated the stock faster than the analyst model could be revised.\n\nWiseTech Global illustrated the inverse problem. Bell Potter retained Buy at A$65.00. Citi retained Buy at A$58.75. Macquarie retained Outperform at A$48.20. Ord Minnett retained Buy at A$60.00. Four major brokers, unanimous conviction. On the day the stock shed 3.3%, extending a post-results retreat that had reached more than 13% across two sessions. Unanimous bullish coverage did not protect against ongoing market-driven price weakness.\n\n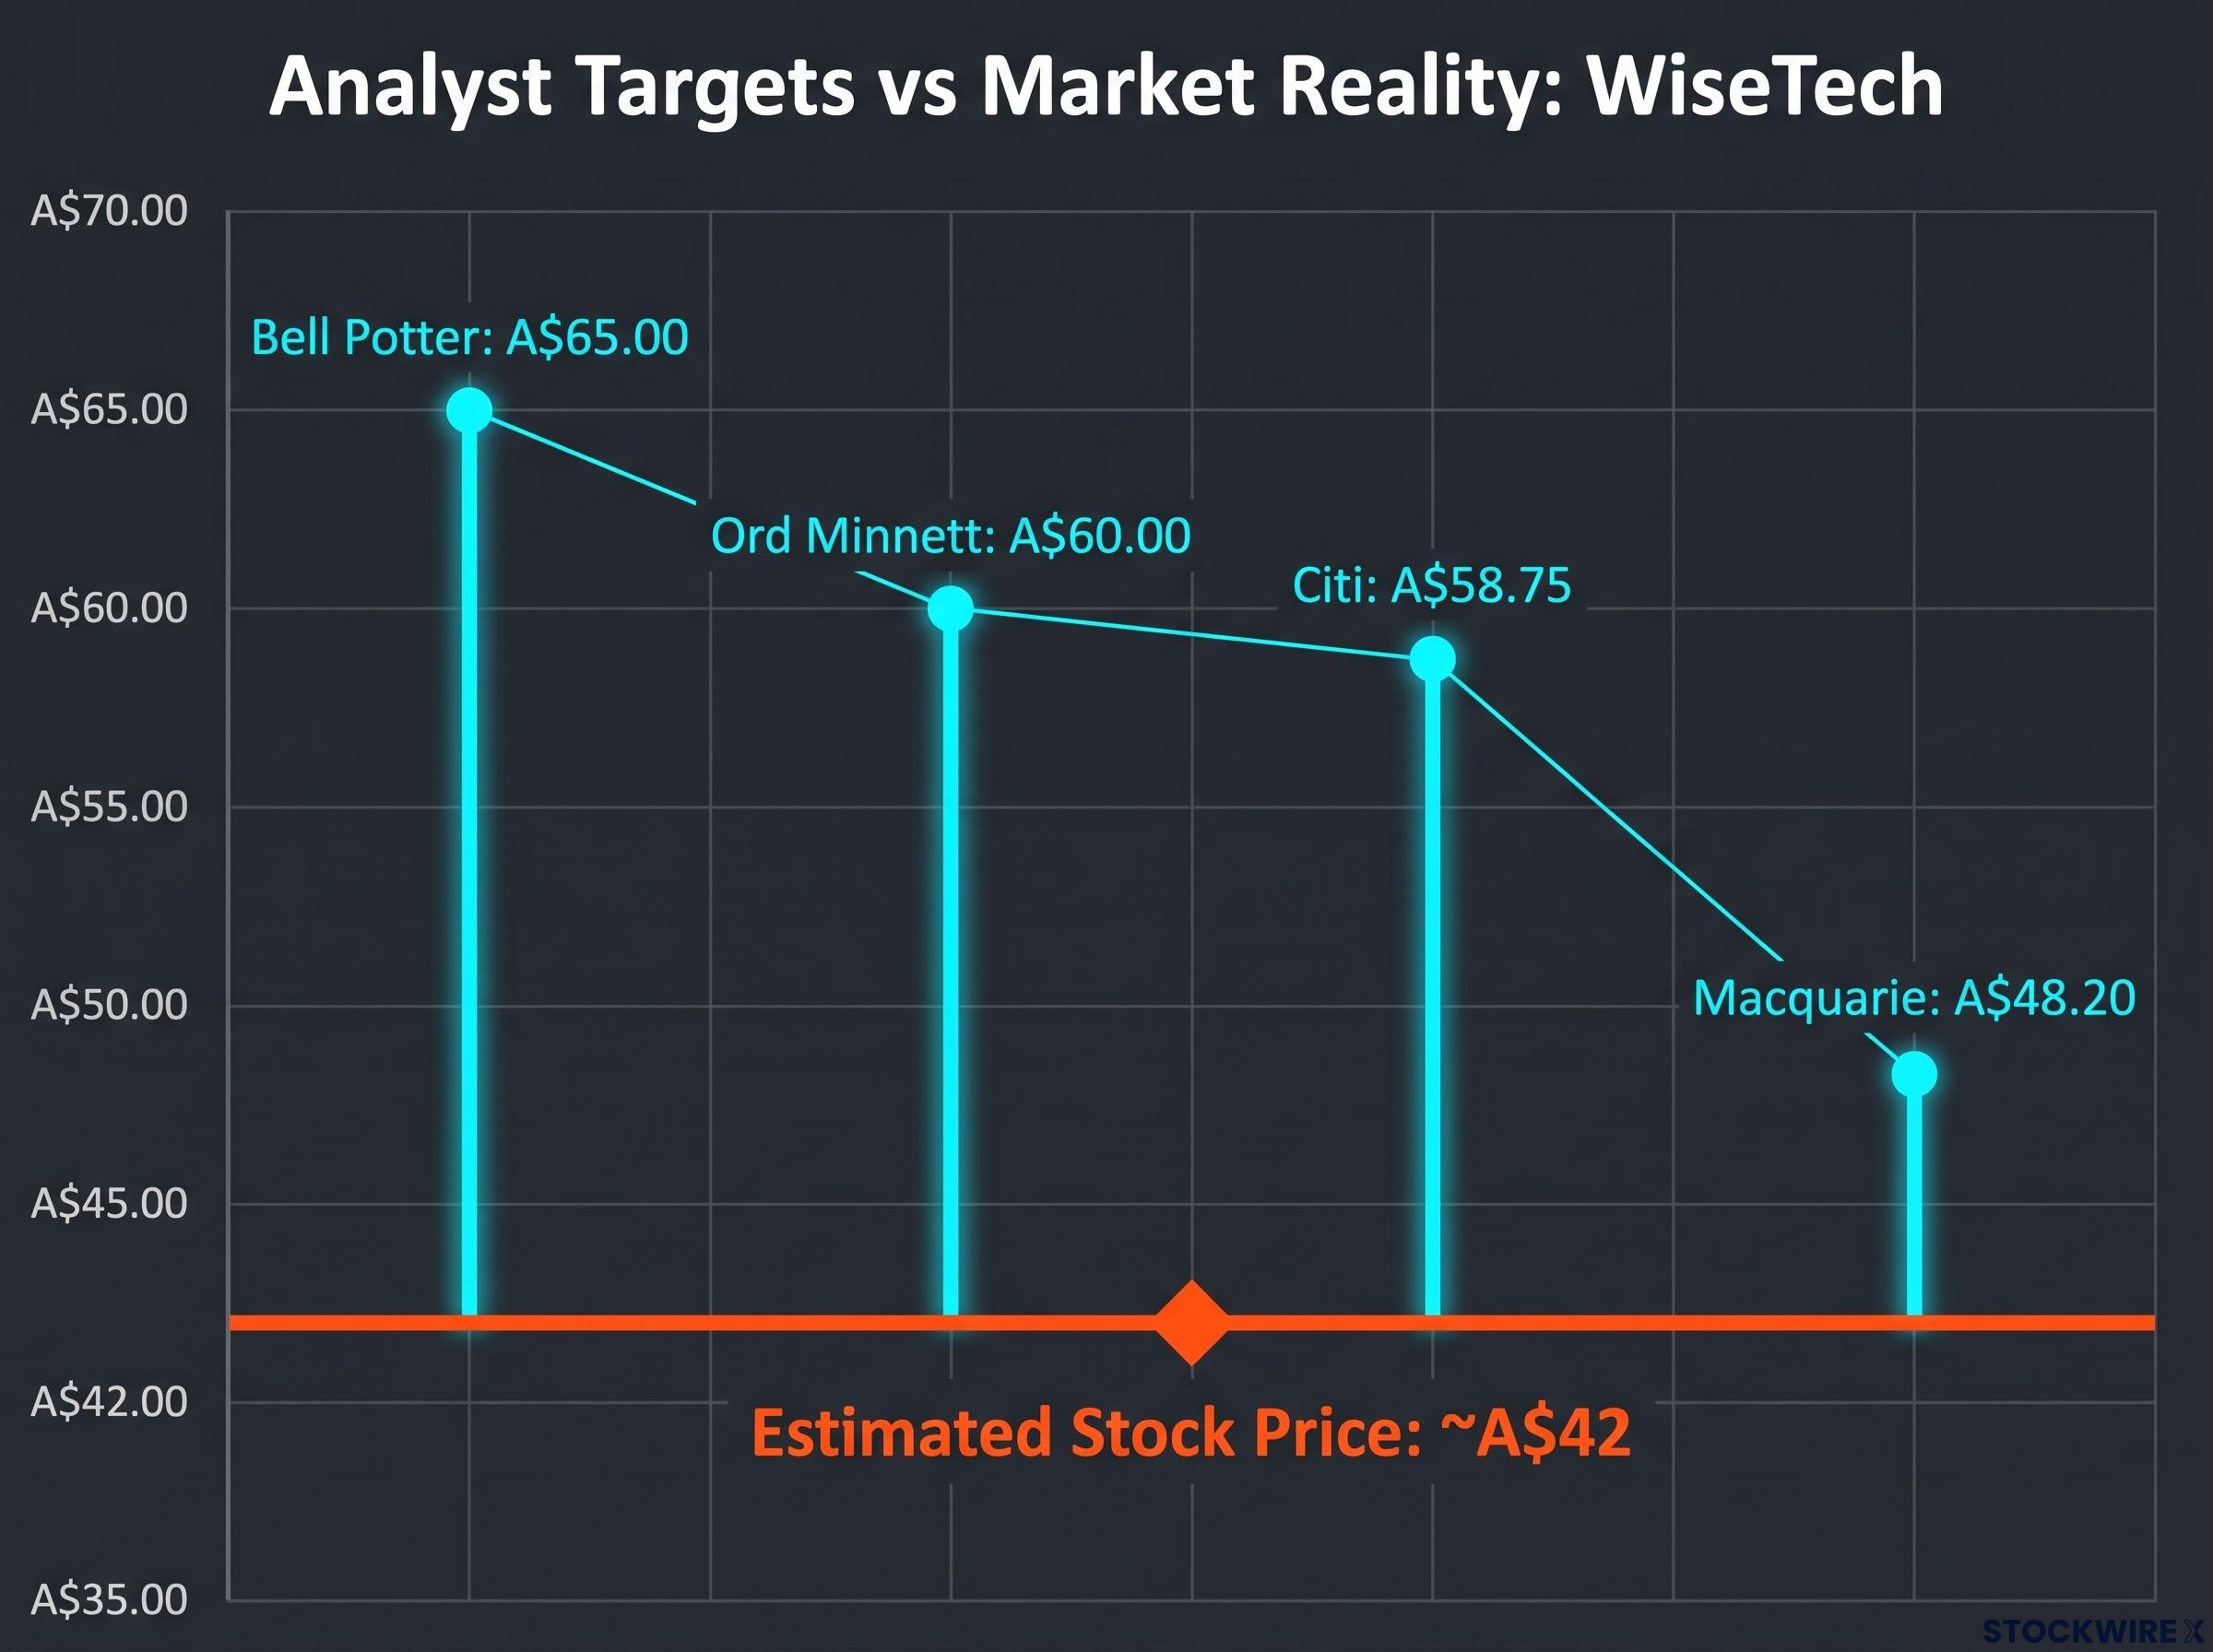 \n\n
\n\n
| Stock | Broker | Rating | Target | Stock price on day |
|---|---|---|---|---|
| Ramsay | Citi | Neutral | A$42.00 | around A$51 |
| WiseTech | Bell Potter | Buy | A$65.00 | ~A$42 (est.) |
| WiseTech | Citi | Buy | A$58.75 | ~A$42 (est.) |
| WiseTech | Macquarie | Outperform | A$48.20 | ~A$42 (est.) |
| WiseTech | Ord Minnett | Buy | A$60.00 | ~A$42 (est.) |
| Domino’s | Citi | Buy (upgraded) | A$21.60 | A$20.30 |
| Domino’s | Macquarie | — | A$18.20 | A$20.30 |
| Domino’s | Bell Potter | Hold | A$20.15 | A$20.30 |
| Sandfire | Canaccord Genuity | Buy | A$24.00 | — |
| Sandfire | UBS | Sell (downgraded) | A$21.35 | — |
\n
\n\nDomino’s showed how an upgrade can amplify a move already underway. Citi’s upgrade to Buy from Neutral, with a raised target of A$21.60, coincided with the stock’s 8.0% gain to A$20.30. The result had already done most of the work; the upgrade reinforced it rather than initiating it.\n\nSandfire Resources drew simultaneous Buy and Sell ratings from different brokers on the same day: Canaccord Genuity at Buy with a A$24.00 target, UBS downgrading to Sell at A$21.35. Broker dispersion on the same stock is not unusual; it is informative. It tells you the data supports more than one legitimate reading.\n\nThe Ramsay and WiseTech cases together tell you to treat broker targets as a starting point for analysis rather than a price ceiling or floor. The market prices information continuously. Broker models update on a cycle. The lag between those two processes is where misaligned expectations live.\n\nBroker price targets on ASX technology stocks have a documented history of lagging market reality by wide margins: Morgan Stanley’s April 2025 cuts on WiseTech Global and Xero proved directionally correct but substantially understated the eventual drawdown, with both stocks falling well past even the revised targets.\n\n## The mechanics behind earnings season volatility: why the same result hits different stocks differently\n\nThe day’s specific moves are already fading into market history. The logic behind them repeats every reporting season. Here is the framework.\n\nShare price reactions to earnings are driven by the gap between the result and what was already priced in, not the absolute size of the profit number. GDG grew profit 21% and fell 15%. Qantas saw profit decline 24% and rose 4.8%. The difference was expectations, not performance.\n\nForward guidance often dominates the current-year print. Institutional investors value the next 12-24 months of earnings. A result that beats FY26 consensus but guides weakly for FY27 will often still fall. Qantas’s 5-7% FY27 EBIT growth guidance did more work than the FY26 headline number. The profit decline was already known. The guidance was new.\n\nThe distinction between underlying and statutory earnings matters more than most investors realise. Underlying earnings strip out one-off costs to show the recurring profit run-rate. Statutory earnings include everything: integration costs, transaction expenses, amortisation of acquired intangibles. GDG’s underlying NPAT grew 21%, but statutory NPAT fell approximately 10%. Flat underlying EPS, due to share issuance, meant the per-share earnings story was weaker than the headline. Reading only the underlying number gave an incomplete picture, and the market priced the full picture.\n\nInstitutional earnings analysis places operating cash flow against net income as an early-warning check, because large divergences between the two can signal aggressive revenue recognition or working capital issues before the income statement reflects them, which is precisely the kind of layered reading that distinguishes statutory from underlying figures.\n\n> A 21% profit increase, a 15% share price fall. The result was not the story; the gap between reality and expectations was.\n\n### When sector mood overrides the numbers\n\nOn heavy reporting days, sector-level sentiment can override stock-specific fundamentals entirely. Across the lithium segment on 27 August, sellers moved as a group regardless of commodity price signals: Elevra Lithium dropped 4.9%, Liontown Resources fell 4.6%, and Pilbara Minerals retreated 2.6%, even as lithium carbonate futures were barely changed on the day. The selling was thematic, not commodity-driven.\n\nConsumer discretionary names moved as a bloc. Wesfarmers fell 4.6%, JB Hi-Fi fell 4.5%, Temple and Webster fell 4.1%. Individual results mattered less than the sector mood on a concentrated reporting day.\n\nThe four variables to assess before acting on any earnings result:\n\n1. Consensus versus actual: How large was the beat or miss relative to what analysts modelled?\n2. Forward guidance: Did the company’s outlook for the next 12 months shift expectations upward or downward?\n3. Underlying versus statutory: Do the two profit figures tell the same story, or does the statutory number reveal costs and dilution the underlying figure hides?\n4. Sector sentiment: Is the stock trading on its own fundamentals, or is it caught in a sector-wide move that may have nothing to do with its result?\n\nNo single variable is sufficient on its own. The day proved that repeatedly.\n\n## Reading the next reporting season with clearer eyes\n\nThe final session of August 2026 was not an anomaly. It was a compressed illustration of dynamics that repeat every reporting season. Earnings season is a market for expectations, not a scorecard for profit growth, and the stocks that moved most sharply were those where the gap between expectation and reality was widest: Ramsay’s approximately 15% surge on one end, GDG’s 15.4% fall to a 52-week low on the other.\n\nThree lessons from the day are durable enough to carry forward:\n\n- Expectations and forward guidance dominate the current-year print. The market prices the future. A profit decline with strong guidance can outperform a profit increase with structural concerns.\n- Pre-result price action sets the threshold the result must clear. A stock that runs into a result raises the bar. A beat may not be enough if the beat was already bought.\n- Broker targets are a lagging signal, not a live one. The market reprices continuously. Broker models update on a cycle. Treat targets as one input among many, not as a price anchor.\n\nThe August 2026 season closes, and the next catalyst cycle begins. The discipline of tracking consensus estimates, monitoring pre-result price momentum, and reading both underlying and statutory numbers before acting is not a lesson from one day. It is the repeatable process for every reporting season.\n\nFor investors preparing for the next concentrated reporting session, our dedicated guide to the August 2026 ASX reporting calendar covers broker consensus NPAT, EPS, and DPS estimates for 78 named companies, giving you the baseline expectation figures that determine whether any result is a beat or a miss before the number lands.\n\n> This article is for informational purposes only and should not be considered financial advice. Investors should conduct their own research and consult with financial professionals before making investment decisions. Past performance does not guarantee future results.“