
“Nvidia beat earnings expectations in May. The stock went lower. That single fact should reframe how you think about every AI and semiconductor earnings event from here.\n\nThe paradox is not a glitch. When a stock’s valuation already embeds years of extraordinary growth, delivering extraordinary growth is not a surprise. It is confirmation of what the price already assumed. This dynamic is sharpest in AI and semiconductor names precisely because their multiples front-load performance that has not happened yet, compressing the room for any result to genuinely surprise.\n\nHere is the framework that makes this readable before the next report drops: a working model for identifying when the risk-reward around a high-multiple AI earnings event has shifted against you, built from Nvidia’s own recent results, the sector dynamics that amplify the effect, and four specific signals you can monitor in real time.\n\n## Nvidia’s numbers are extraordinary. The problem is the market already knew that.\n\nStart with the results themselves. Nvidia’s Q1 fiscal 2027 revenue hit $81.6 billion, up 85% year over year from $44.0 billion. Data centre revenue reached $75.2 billion, a 92% increase. Non-GAAP earnings per share came in at $1.87 against consensus estimates of approximately $1.75-$1.77. Management guided Q2 fiscal 2027 revenue to $91 billion, well above prior Street estimates near $87 billion.\n\nBy any historical standard, these are exceptional numbers. A beat on revenue. A beat on earnings. A raise on guidance. The textbook setup for a stock to move higher.\n\nThe stock did not cooperate. Following the 20 May 2026 report, Nvidia traded lower, a reaction that baffled investors watching the headline numbers in isolation.\n\nAcross a 17-report dataset stretching back to February 2022, Nvidia’s post-earnings win rate sits at approximately 41%, with a median one-week move of -3.5% even in quarters where the company beat analyst estimates, confirming that the muted reaction to the May 2026 report was not an anomaly.\n\nThe explanation sits in one data point that matters more than any line on the income statement.\n\n> By the late-August reporting period, Nvidia’s EPS beats had narrowed to roughly 1% above analyst consensus, a thin sliver compared with the double-digit outperformance the company routinely posted in earlier quarters.\n\nThat compression tells you something specific. Nvidia’s analysts have become so precise at modelling the company that the element of surprise has been almost entirely arbitraged away. Holding into an earnings event is now a bet on a very narrow slice of upside, with far more downside exposure if that slice disappears.\n\n
| Metric | Consensus estimate | Q1 FY27 actual | Stock reaction |
|---|---|---|---|
| Revenue | ~$78.9-$79.0B | $81.6B | Muted / lower |
| Non-GAAP EPS | ~$1.75-$1.77 | $1.87 | Muted / lower |
| Q2 FY27 guidance | ~$87B | $91B | Muted / lower |
\n
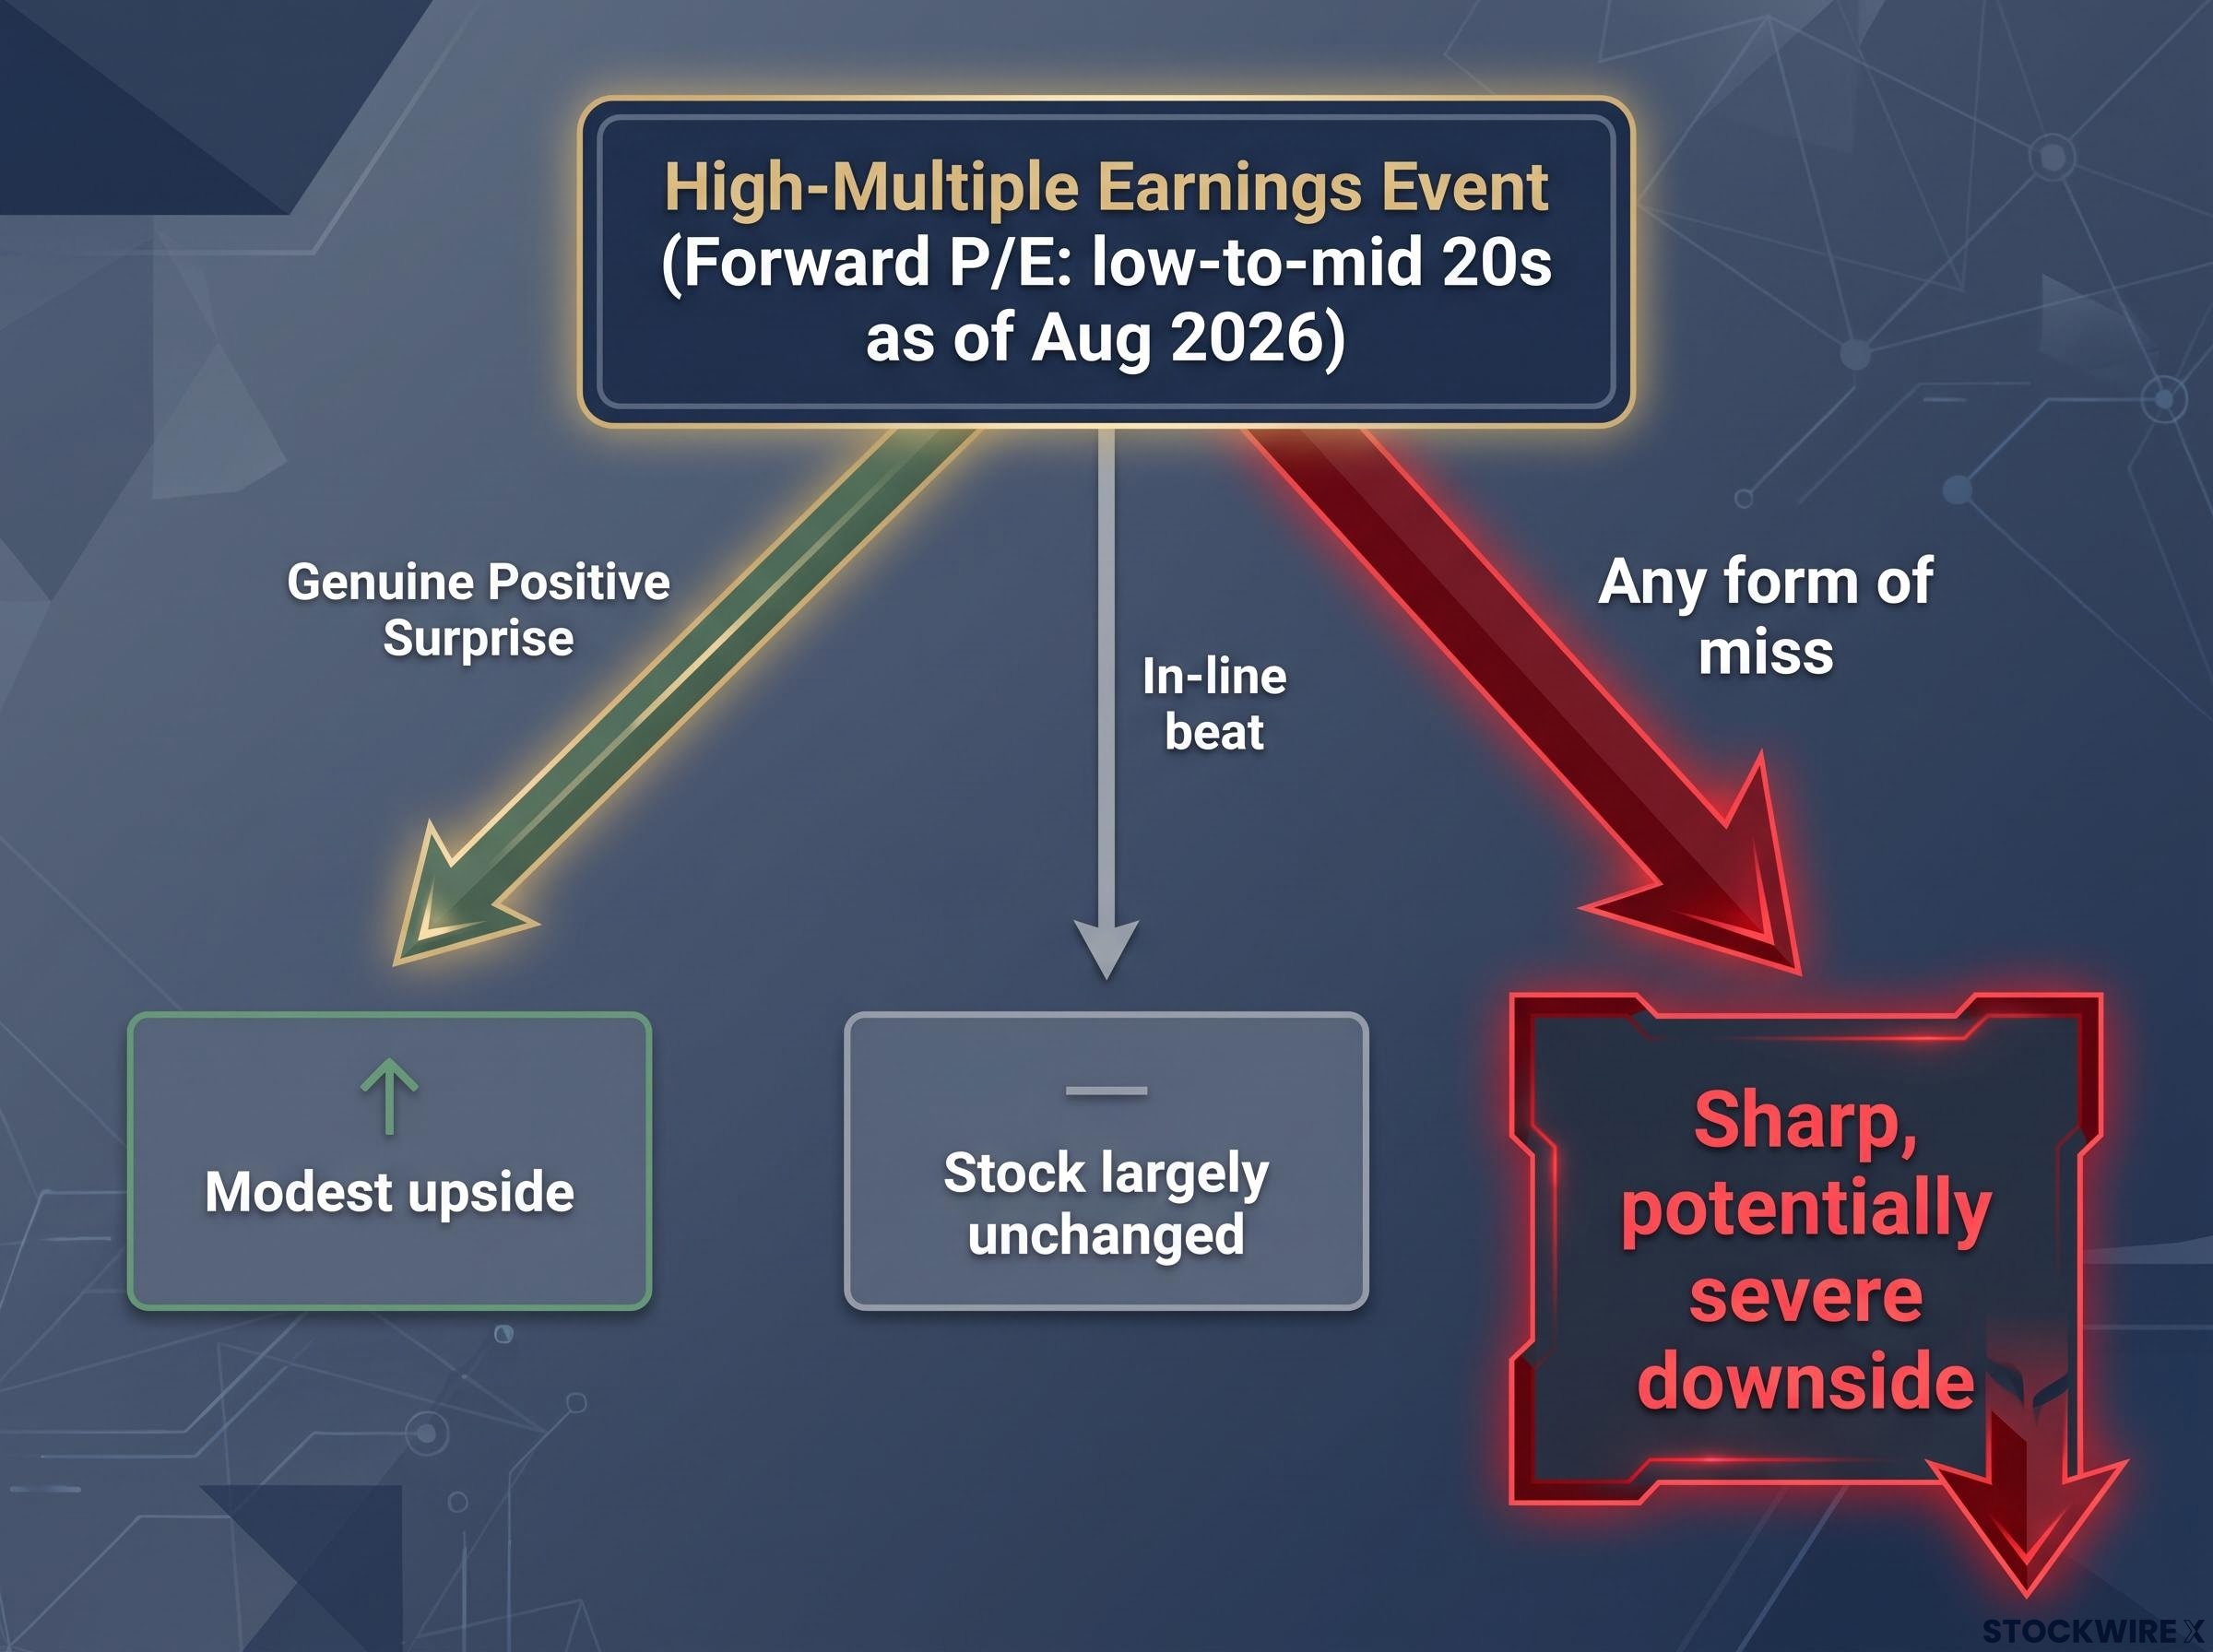
\n\nEvery column says \”beat.\” The stock said \”already priced.\” That gap between the numbers and the reaction is the expectations trap in its clearest form.\n\n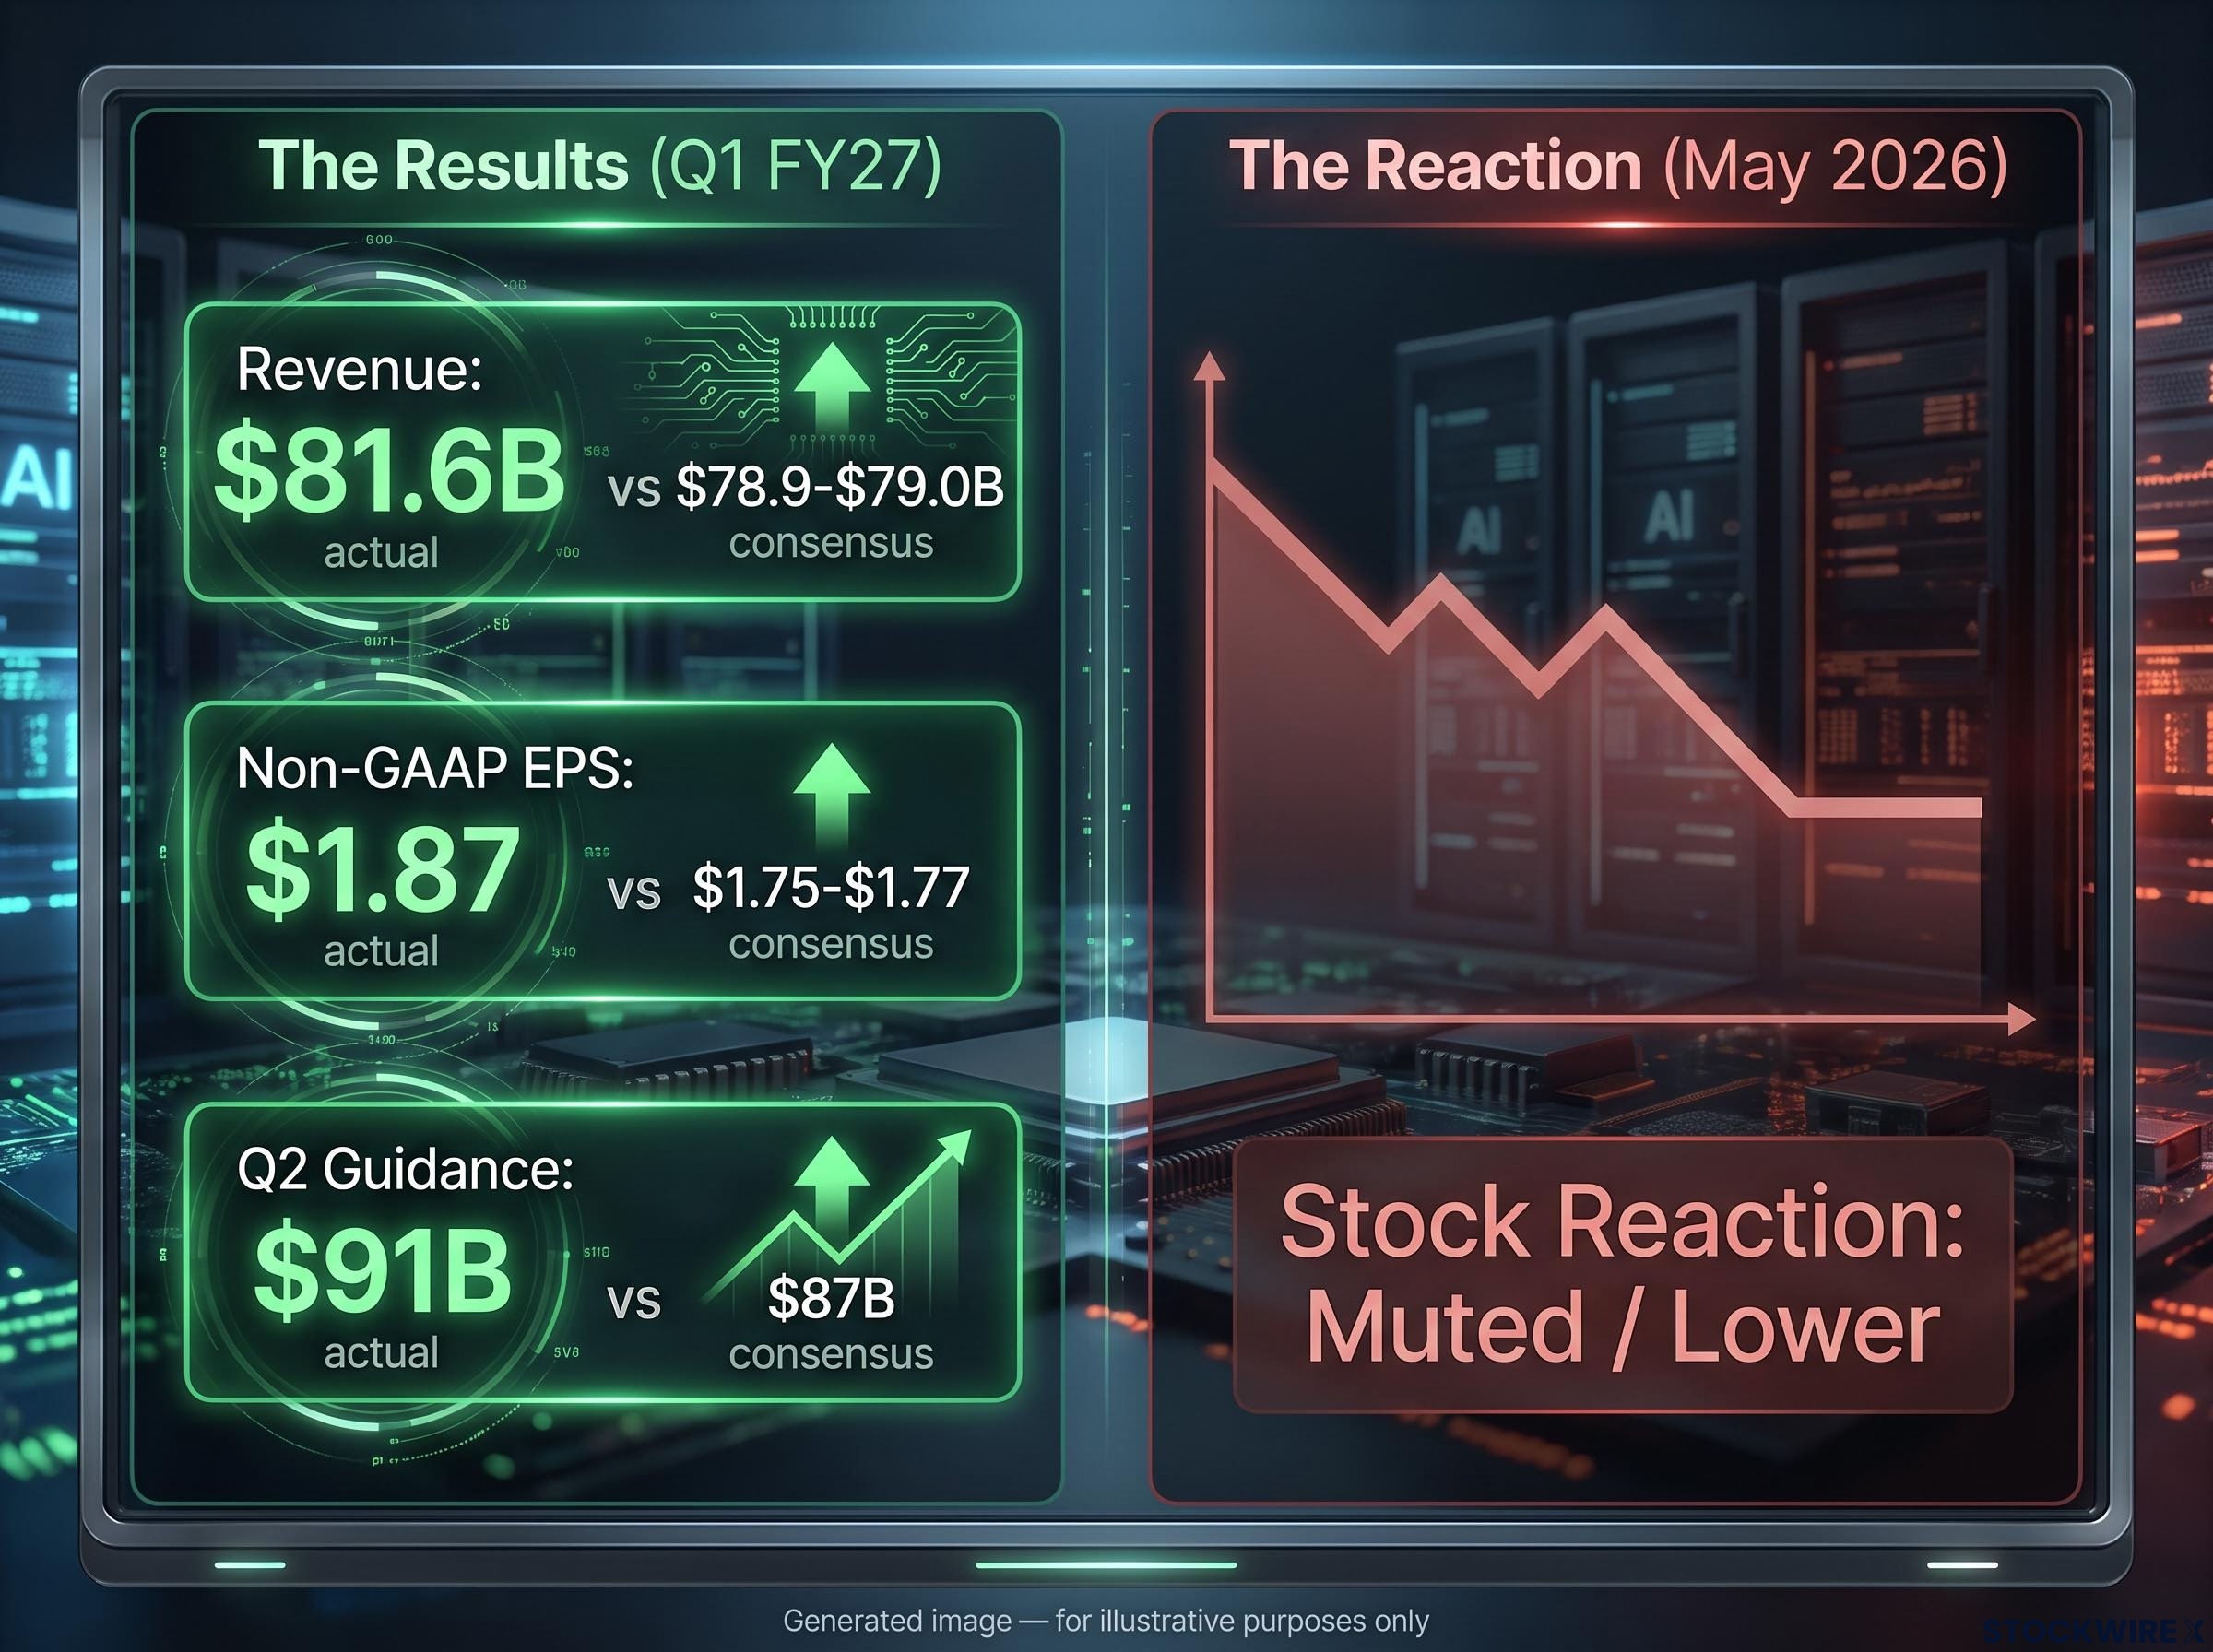 \n\n## What the expectations trap actually is, and why high-multiple stocks fall into it\n\nThe mechanism works like this. When consensus models already embed extraordinary growth, delivering extraordinary growth is not a positive surprise. It is a confirmation of what the price already assumed. No new information enters the market. No incremental valuation uplift follows.\n\nThe forward price-to-earnings ratio, the price investors pay today relative to the earnings analysts expect over the next twelve months, sits in the low-to-mid 20s for Nvidia as of late August 2026. The trailing P/E is in the low-to-mid 30s. Those multiples look moderate on the surface, until you examine what has to happen for them to be justified.\n\nSelect analyst projections place Nvidia’s fiscal 2027 revenue in the mid-to-high $300 billion range. That figure is the denominator that makes the forward P/E look reasonable. Any macro event, any demand signal, any hyperscaler spending hesitation that makes that revenue target look uncertain does not trim the stock at the margin. It calls the entire valuation structure into question.\n\nGoldman Sachs estimates that AI infrastructure capital expenditure now absorbs 93-94% of hyperscaler operating cash flow, and the firm has shifted its primary valuation concern from P/E multiples to AI capex productivity, earnings revisions, and whether outlays generate proportional returns at the scale being deployed.\n\nThe baseline has already risen steeply. Full-year fiscal 2026 revenue reached $215.9 billion, up 65% year over year. Surprising from a base that large requires not just growth, but growth that exceeds what a market full of sophisticated models has already pencilled in.\n\n### The asymmetric payoff structure in practice\n\nThis creates a risk-reward profile that is structurally lopsided around earnings:\n\n- In-line beat (results match or modestly exceed expectations): Stock is largely unchanged. The beat was priced. No new information.\n- Genuine positive surprise (results and guidance materially above expectations): Modest upside. The market re-rates incrementally but remains cautious about sustainability.\n- Any form of miss (results, guidance, macro commentary, or qualitative signals disappoint): Sharp, potentially severe downside. Multiple compression at elevated P/E levels produces large dollar-value drawdowns because the starting point is high.\n\n
 \n\n
\n\n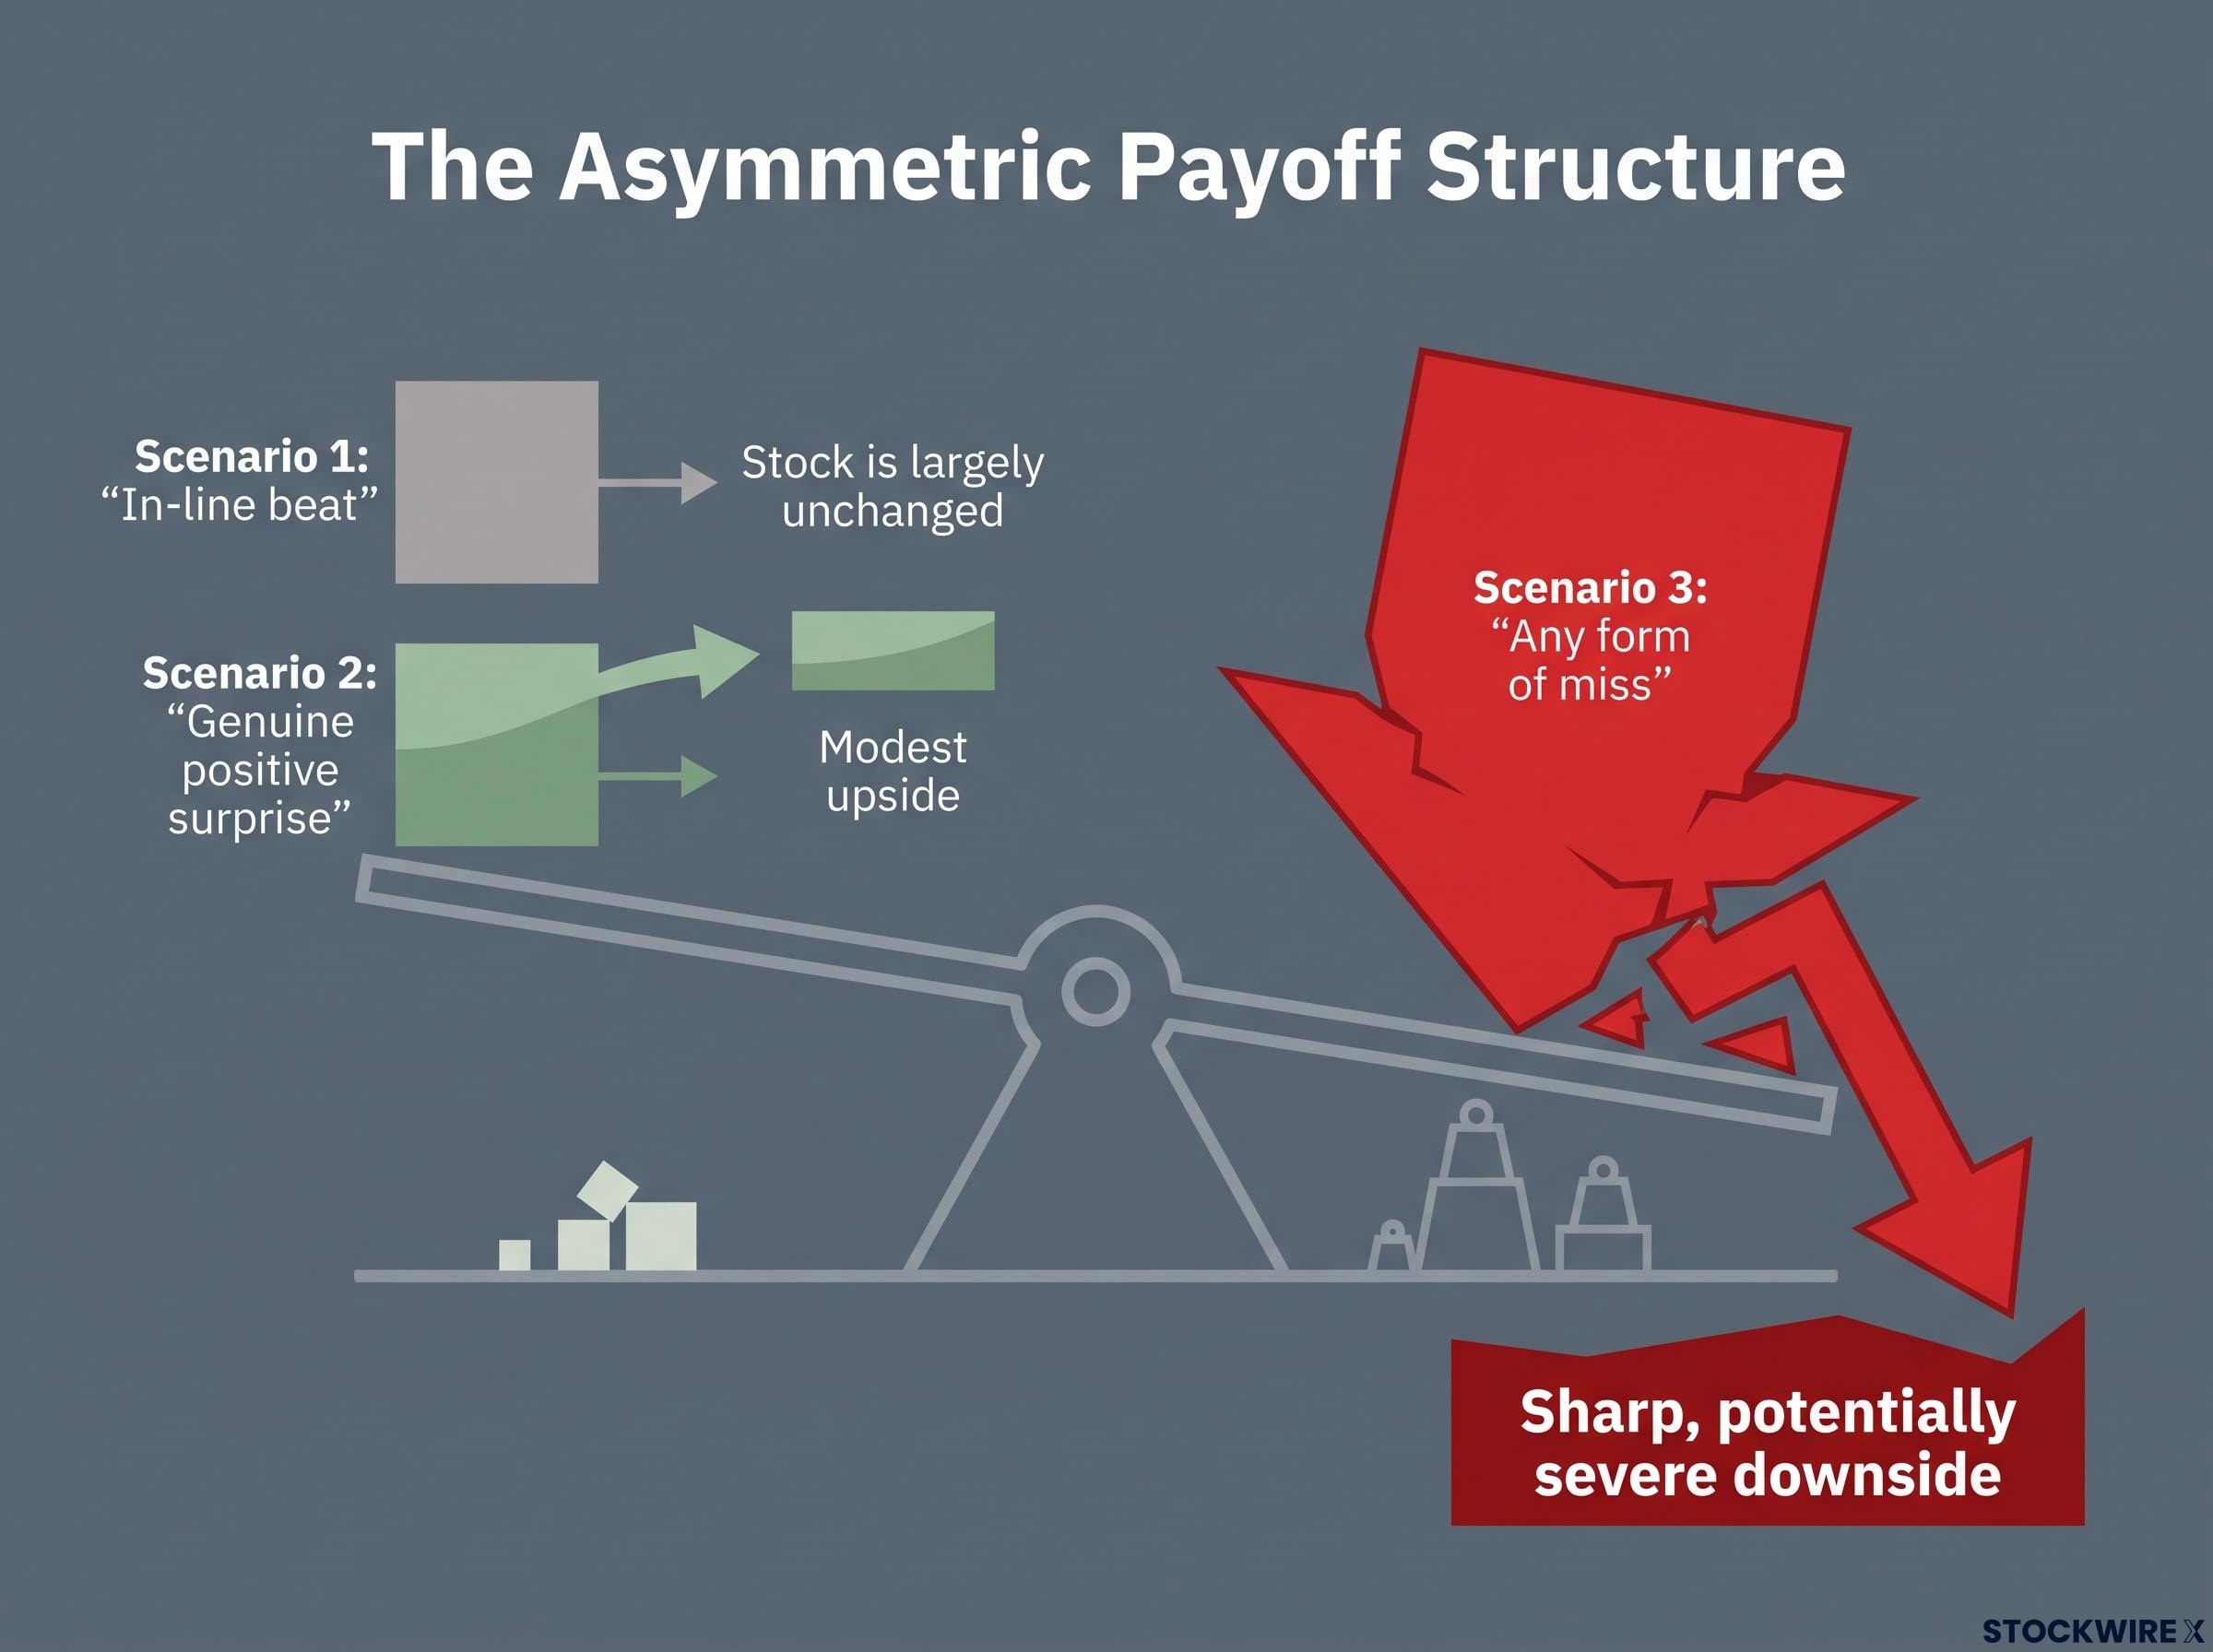 \n\nThat asymmetry is not a temporary condition. It is a direct consequence of any stock priced for extraordinary outcomes. The mental model applies well beyond Nvidia: any high-multiple AI or semiconductor holding should be stress-tested through the same lens. What exactly has to happen for the multiple to be justified? And what is the stock worth if that scenario slips by even one year?\n\n## Why semiconductors amplify this dynamic across the whole portfolio\n\nThe risk does not stay inside Nvidia. AI and semiconductor names function as high-duration assets, meaning their valuations are particularly sensitive to changes in the discount rate, macro sentiment, or forward earnings credibility, independent of near-term results. A single disappointing guidance comment from the sector’s most important company sends tremors through correlated positions that most investors do not realise are correlated.\n\nThe broader market context sharpens this concern. As of late August 2026, the S&P 500 has given back ground to the former resistance level that acted as the top of its trading range throughout May and July. The NASDAQ continues to lag, still trading beneath the peaks it reached in May and June with no clear recovery toward record territory in sight. Implied volatility within the semiconductor sector has been running elevated relative to the broader market, a signal that options markets have already recognised event risk that equity holders may be underpricing.\n\n> Bill Spac, head of global macro at Tasty Live, has warned that a break below current support levels on either index could signal a more significant market top rather than a routine pullback.\n\nAn Nvidia miss would not stay on one line of a portfolio statement. The transmission runs through three channels:\n\n- Multiple compression in correlated names: Semiconductor and AI infrastructure stocks move in clusters. A guidance disappointment from Nvidia reprices peers simultaneously, even those that have not yet reported.\n- Systematic factor de-risking: Quantitative strategies that hold semiconductor and momentum factor exposure would reduce positions mechanically, amplifying selling pressure beyond what fundamentals alone would produce.\n- Index-level technical deterioration: If NASDAQ support breaks on the back of a semiconductor sell-off, the damage extends to any portfolio with broad tech or growth exposure.\n\nSector-wide repricing of this kind materialised in July 2026, when the semiconductor index fell 6.3% in a single session as Micron, Applied Materials, Lam Research, and Intel each lost more than 9%, a synchronised decline triggered by modest shifts in AI spending tone rather than any hard demand collapse.\n\nIf you hold Nvidia, a semiconductor ETF, and two or three other AI infrastructure names, a single guidance miss does not affect one position. It can reprice the entire cluster simultaneously. Position sizing for earnings events in this sector requires thinking about total AI and semiconductor exposure, not individual position weight.\n\n## What investors should actually watch before Nvidia reports\n\nThe expectations trap framework is only useful if it produces observable signals. Four are worth monitoring before any Nvidia earnings event, in order of priority.\n\n1. Beat margin trajectory over the prior three quarters. Monitor whether EPS beats are shrinking toward 1% or below. As the gap between reported results and consensus closes, it signals that analyst models have caught up with the company’s actual pace of growth, leaving very little room for a genuine upside surprise. A progression from double-digit beat margins down into low single digits is a direct, measurable sign that the trap is closing.\n\n2. Options-implied move and directional skew. The options market prices an expected move ahead of every earnings event. Compare the implied move to the stock’s actual post-earnings moves over the prior three to four quarters. Examine the directional skew: if put premiums are elevated relative to calls, professional traders are pricing more downside risk than upside potential. That number, compared to your total sector exposure, tells you whether your current position sizing is appropriate for the event.\n\n3. Guidance quality indicators. The headline EPS beat matters less than what the guidance reveals about durability. Four qualitative factors deserve attention:\n – Hyperscaler capital expenditure commitment language: are major customers reaffirming or hedging their spending plans?\n – Volume versus price decomposition: is revenue growth driven by shipping more units or raising prices? Volume-driven growth is more durable.\n – Geographic revenue mix: concentration risk in any single region or customer base weakens the beat’s credibility.\n – Forward-guidance credibility: does the guidance imply acceleration, deceleration, or steady state? Evaluate against the fiscal 2027 revenue forecast range of mid-to-high $300 billion as the benchmark.\n\n4. Total sector exposure relative to implied downside. Add up every AI and semiconductor position in the portfolio, including ETFs that carry meaningful semiconductor weight. Compare that aggregate exposure to the options-implied downside move. If a 7-10% drawdown across the semiconductor complex would produce losses larger than you are comfortable absorbing, the position sizing question needs to be addressed before the report, not after.\n\n### Reading guidance quality, not just the headline beat\n\nA 1-5% EPS beat accompanied by strong, believable guidance can still support a premium multiple. A larger EPS beat paired with cautious or hedged forward commentary can pressure the stock. The market has learned to look past the headline number and interrogate the composition beneath it. Investors should do the same.\n\nFor investors who want to apply these guidance quality criteria systematically across any earnings release, our comprehensive walkthrough of earnings report analysis covers revenue source verification, GAAP versus non-GAAP gap assessment, free cash flow alignment, and multi-quarter consistency checks in a seven-step framework.\n\n## Believing in AI and managing the entry risk are not the same decision\n\nThe secular case for AI infrastructure remains broadly intact. Sustained demand for compute, networking, and memory has strong fundamental drivers that extend over multiple years. Nothing in the expectations trap framework requires abandoning that thesis.\n\nThe question is narrower and more practical. Nvidia’s EPS beat margin has steadily eroded from double-digit outperformance to a figure now sitting at roughly 1% above consensus, a measurable indicator of how far the expectations trap has advanced. The Q2 fiscal 2027 revenue guidance of $91 billion, beating prior estimates of approximately $87 billion, raises the baseline once again, compressing the room for next quarter’s surprise.\n\n> The expectations trap tightens with every beat-and-raise quarter: each guidance increase resets the bar higher, making the next \”surprise\” harder to deliver and the downside on a miss steeper.\n\nThe question is not whether to own AI and semiconductor exposure over a five-year horizon. For most growth-oriented investors, the secular case is clear. The question is whether the current entry price already reflects that five-year case, and if so, whether you are being compensated for the earnings-event risk you are taking on between now and when that case resolves.\n\nHolding both convictions simultaneously, the long-term thesis and the near-term caution, is not contradiction. It is precision.\n\nThis article is for informational purposes only and should not be considered financial advice. Investors should conduct their own research and consult with financial professionals before making investment decisions. Past performance does not guarantee future results. Financial projections are subject to market conditions and various risk factors.“
Broader valuation signals across US equities reinforce the sector-specific concern: the Buffett Indicator stood at 223.6% as of May 2026, approximately 2.4 standard deviations above its long-run trend, providing the macro context within which any Nvidia multiple compression would occur.
The mechanics underlying growth stock valuations, including how discounted cash flow models assign present value to earnings that may not arrive for years, explain why rising discount rates can pressure a stock’s share price even when its underlying business keeps compounding at a strong pace.