
The Dow Jones Industrial Average is up more than 160 points today. The S&P 500 and Nasdaq Composite are both in the red. If you checked your portfolio this afternoon and saw losses, then looked at a headline reading “Dow rises,” you are not misreading anything. The numbers genuinely point in opposite directions.
The explanation is not about news. It is about architecture. A benchmark semiconductor ETF is down nearly 3% on the session, and that single sector move is exposing a structural gap between how these three indexes are built. The chip selloff is hammering two of them and barely touching the third.
Here is the specific reason the Dow behaves differently from the S&P 500 and Nasdaq during a chip rout, and what that tells you about how to read today’s market tape without being misled by a single number.
The day’s scorecard: what the numbers actually show
DJIA: approximately 53,400, up 160+ points (approximately 0.3%)
The session opened strong. The Dow reached its intraday peak just under 53,500 in the opening 15 minutes of New York trading, retreated to a low around 53,100 through the late London morning session, then consolidated ahead of a scheduled policy announcement later in the day.
While the Dow climbed, the semiconductor sector told a completely different story. The session’s weak spots:
- SOXX (a benchmark semiconductor ETF): suffered losses of close to 3% on the day
- Micron Technology (MU): fell by over 5%
- AMD and Broadcom (AVGO): each posted declines on the session
- Weakness extended beyond chipmakers into optical and data storage names
These are not contradictory numbers. They are the mathematically predictable output of indexes with fundamentally different architectures responding to the same sector shock. The Dow is up because of how it is built, not because the broader market is fine.
When big ASX news breaks, our subscribers know first
How the Dow is built differently from the S&P 500 and Nasdaq
The Dow does something unusual among major indexes: it weights by price, not by size.
The DJIA arrives at its value by totalling the share prices of its 30 constituent stocks and then dividing that sum by a scaling number called the Dow Divisor (currently approximately 0.15-0.17; the exact figure is adjusted periodically for stock splits and composition changes). The Dow Divisor is a proprietary scaling number maintained by S&P Dow Jones Indices. What matters is the consequence: each stock’s influence on the index depends on its share price, not its total market value.
That means a company trading at $400 per share moves the Dow roughly twice as much as a company trading at $200, regardless of which one is actually the larger business. A high-priced non-chip stock can lift the Dow more than a much larger semiconductor company can drag it down.
Cap-weighted versus equal-weighted construction produces strikingly different real-world exposure profiles: a cap-weighted fund mechanically channels each new dollar toward whichever stocks have already appreciated most, which is precisely why mega-cap semiconductor names dominate the S&P 500 and Nasdaq to a degree the Dow’s price-weighted structure never replicates.
The DJIA is among the oldest equity benchmarks in existence, established by Charles Dow, the same figure who co-founded the Wall Street Journal. Its 30 components are selected by a committee rather than by rules-based criteria, making it inherently narrower and editorially curated.
Why market-cap weighting amplifies chip sector moves
The S&P 500 and Nasdaq Composite work differently. Both are market-capitalisation-weighted, meaning a company’s influence on the index scales with its total market value (share price multiplied by total shares outstanding). Mega-cap semiconductor names like Nvidia, AMD, Broadcom, and Micron carry substantial weight in both benchmarks.
When those names fall 3-5% in a single session, they pull cap-weighted indexes lower even if most other sectors are flat or rising. That is not a flaw in either methodology. It is a reflection of different design goals.
Mega-cap concentration risk in cap-weighted indexes like the S&P 500 and Nasdaq means that when a handful of large semiconductor and technology names sell off together, the damage to those benchmarks far exceeds what a simple sector weighting would suggest, because the top five names alone can account for nearly a quarter of total index weight.
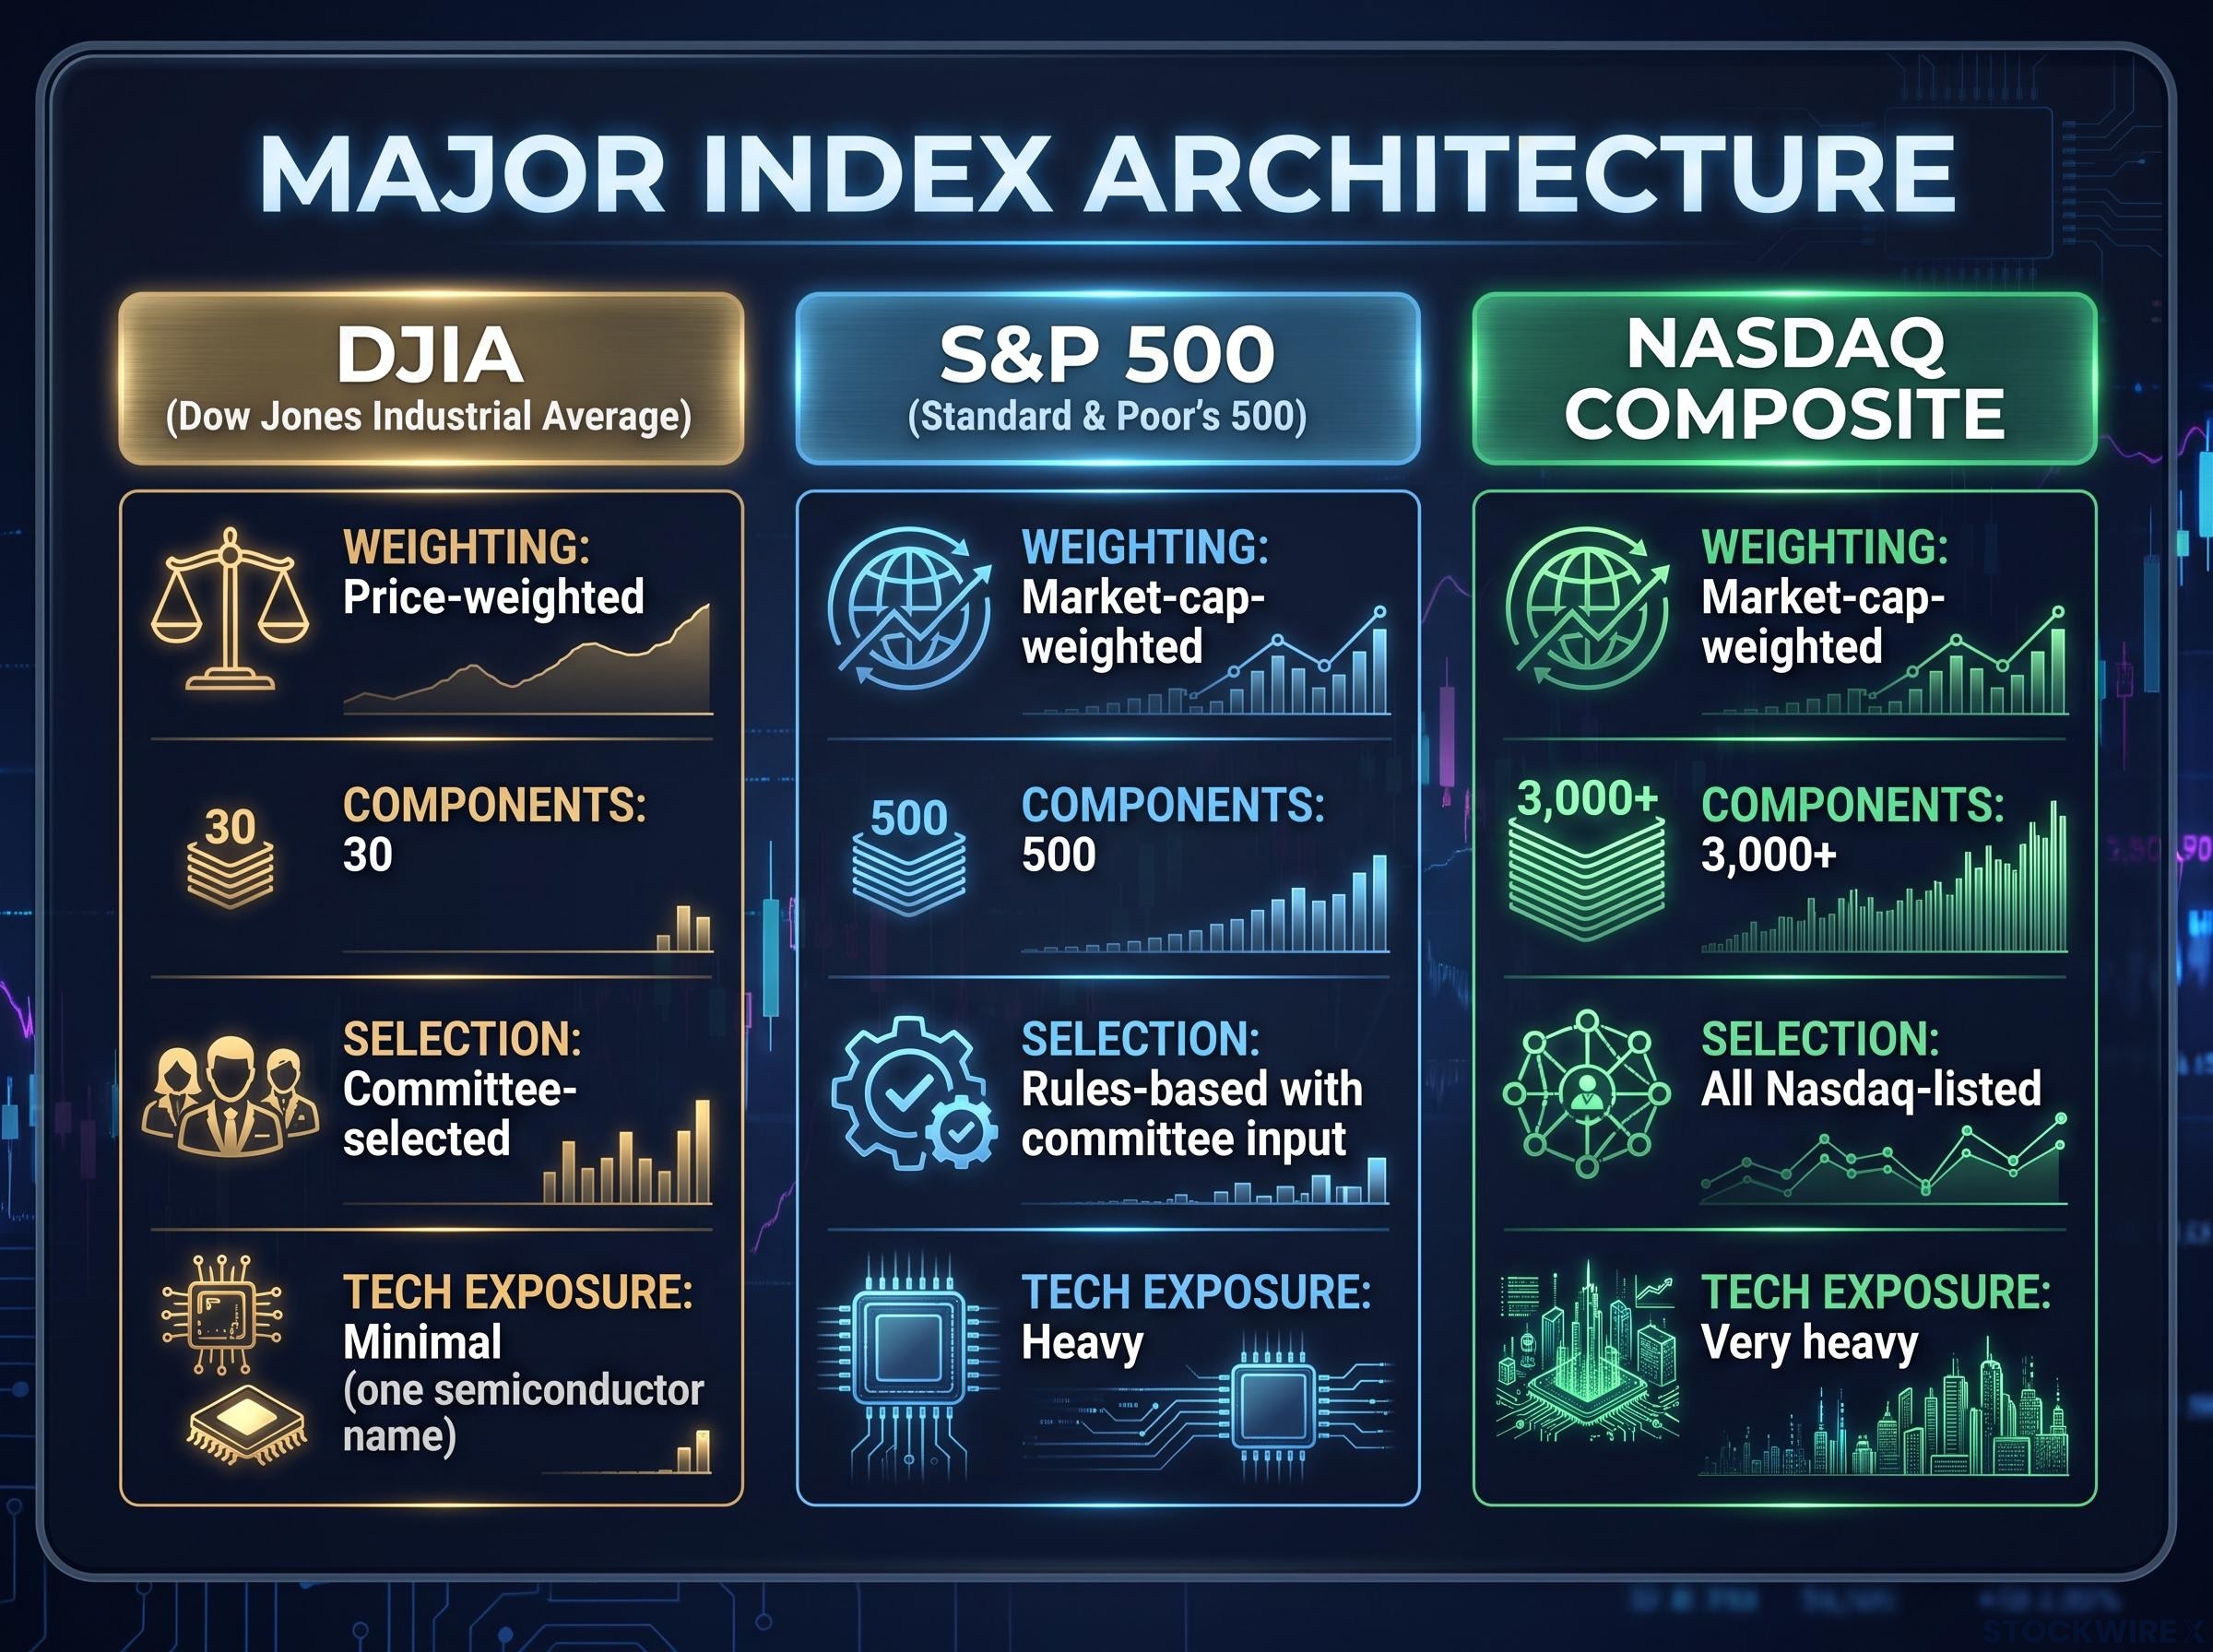
| Attribute | DJIA | S&P 500 | Nasdaq Composite |
|---|---|---|---|
| Weighting method | Price-weighted | Market-cap-weighted | Market-cap-weighted |
| Number of components | 30 | 500 | 3,000+ |
| Selection process | Committee-selected | Rules-based with committee input | All Nasdaq-listed (rules-based) |
| Typical chip/tech exposure | Minimal (one semiconductor name) | Heavy (mega-cap tech dominant) | Very heavy (tech-concentrated) |
For you, the practical implication is straightforward: the Dow’s price-weighting means the index can post gains on a day when the majority of US market capitalisation is declining. That is precisely what happened today.
The semiconductor blind spot: why the Dow barely felt today’s chip rout
Here is where the two mechanics combine into a single explanation.
Nvidia (NVDA) is the single semiconductor name included among the DJIA‘s thirty components. (Index composition changes periodically; verify its ongoing inclusion at the time you read this.) On today’s session, Nvidia was not identified as a significant decliner. The stocks causing the most damage across the chip sector, Micron down more than 5%, AMD and Broadcom both lower, are not held in the Dow at all.
The sector shock simply had almost no transmission path into the index.
The compounding effect works like this:
- Sector exposure gap: The S&P 500 and Nasdaq hold heavy semiconductor weightings. The Dow holds one chip name. The same selloff registers as a major event in one group and a non-event in the other.
- Weighting methodology difference: Even where the Dow does hold a chip stock, its price-weighting means other high-priced non-chip components can actively offset the damage. Strong performance in financials, healthcare, or industrials among the Dow’s expensive names lifts the index while chips fall.
- Combined divergence outcome: These two structural features produce a tape where the Dow rises while the S&P 500 and Nasdaq decline, not because the market is sending mixed signals, but because the indexes are measuring different things.
The Dow’s gain today is not evidence that the chip selloff is being absorbed. It is evidence that the Dow does not have enough chip exposure to register the damage.
If you are using the Dow as your primary market gauge during semiconductor-driven moves, you risk misreading the severity of what is happening across the broader technology ecosystem. Nvidia earnings are scheduled later in the week, and that report is the event most likely to change the chip narrative. Until then, the Dow is structurally insulated from the pain showing up in other benchmarks.
What traders are watching for the rest of the week
The macro calendar does not explain today’s divergence (that is structural), but it does set the stage for whether the current chip-sector weakness intensifies or reverses over the next several sessions.
| Event | Scheduled timing | Consensus forecast | Why it matters for the divergence |
|---|---|---|---|
| July core PCE price index (MoM) | Wednesday 12:30 GMT | 0.2% (annual rate 3.3%) | Inflation data shapes rate expectations, influencing growth stock valuations including chips |
| Preliminary Q2 GDP | Wednesday 12:30 GMT | Annualised 1.5%, price index 6.3% | Growth trajectory affects risk appetite across tech and industrials |
| Nvidia earnings | Wednesday evening | N/A | Strongest single catalyst: strong print could compress the index gap; weak print could widen it |
| BLS payroll benchmark revision | Friday 14:00 GMT | N/A | The 2024 preliminary estimate stripped **818,000** jobs from the total (final was 598,000); closely watched given softening labour conditions |
| Fed Chair remarks (Jackson Hole) | Friday 14:00 GMT | N/A | Forward rate guidance affects duration-sensitive tech names disproportionately |
Note: PCE and GDP forecasts are based on pre-release consensus and should be confirmed at time of publication.
The DJIA’s technical posture adds further context. Here are the levels traders are watching:
Resistance:
- Primary: the 53,500 area marked the session ceiling and represents the first level to watch
- Stronger cap near 53,800, a zone that has turned away every rally attempt since mid-month
- Further resistance at 54,100 and just below the record near 54,750
Support:
- Initial: near 53,100, where the session found its floor
- 53,000 psychological level
- 50-day EMA near 52,600, providing dynamic support
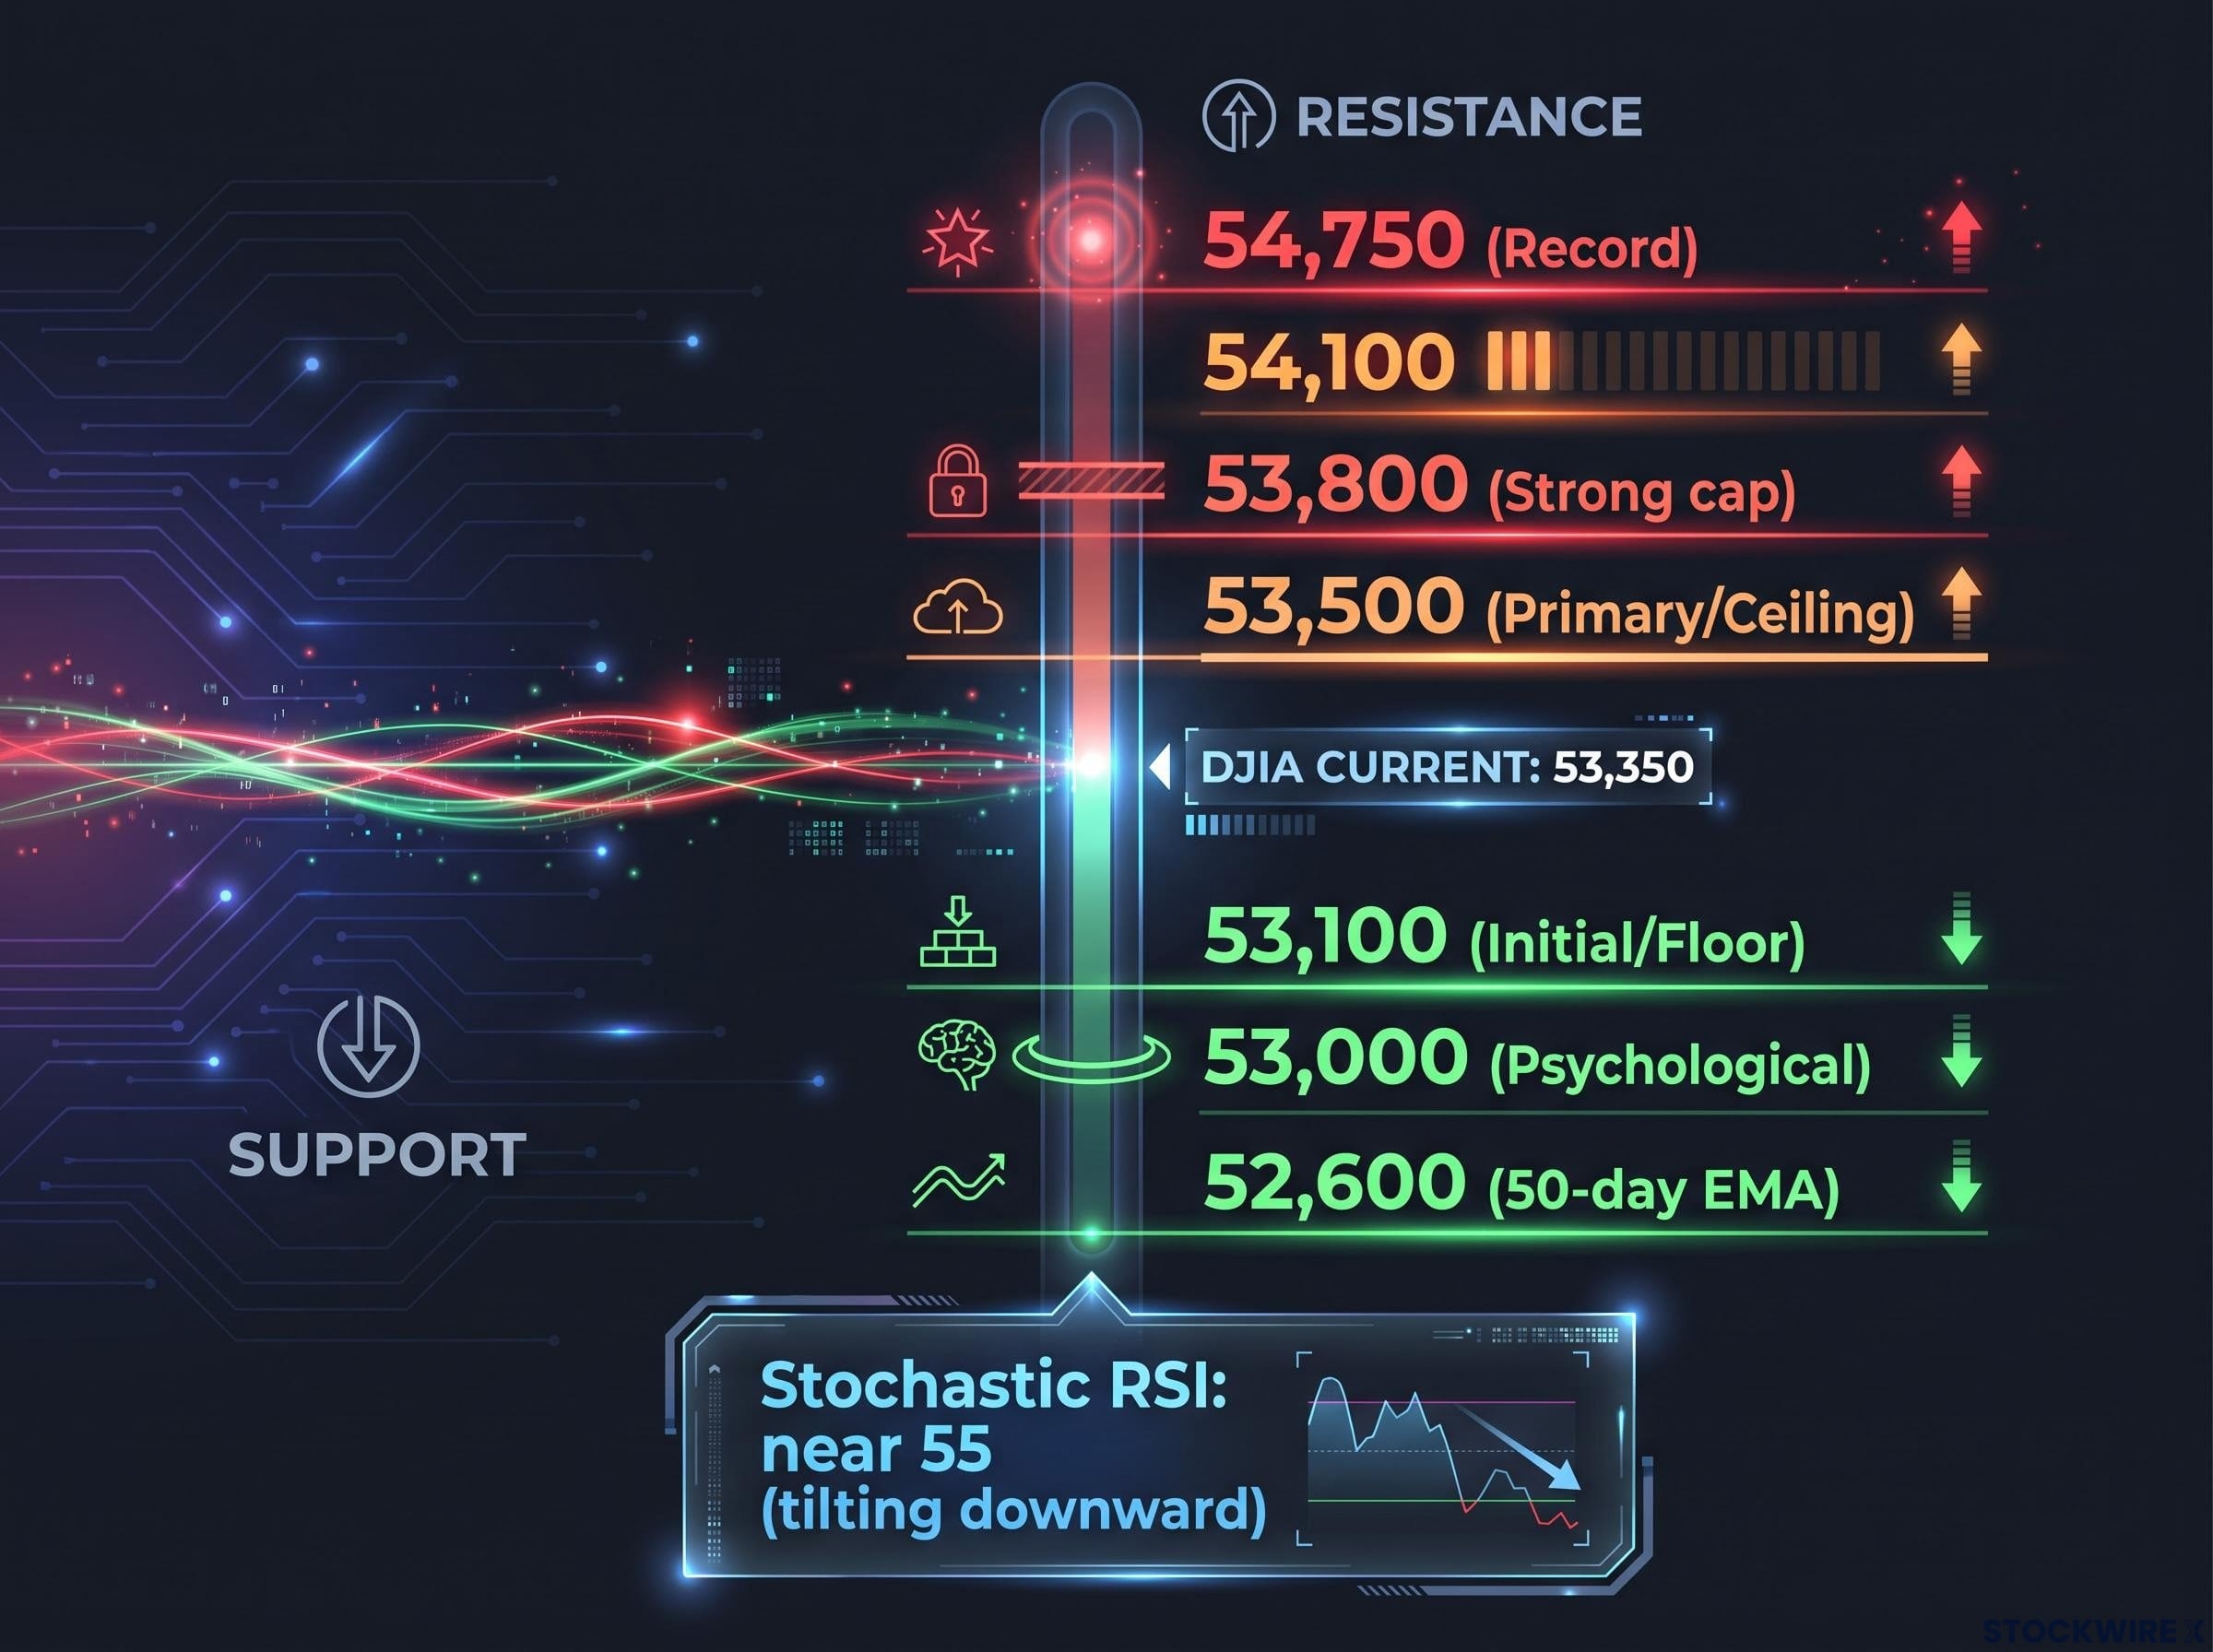
The daily Stochastic RSI (a momentum oscillator that measures the speed and direction of price changes) is tracking near 55 and tilting downward. The index retains a bearish near-term character while price remains capped by 53,800; only a daily close above that threshold would shift the outlook to the upside.
For anyone positioned in chip or tech names, or watching the Dow as a market proxy, these are the specific numbers and events to track over the next 48-72 hours. Nvidia’s earnings report is the single event most likely to either compress or widen the gap between the Dow and the other two benchmarks.
Semiconductor sector positioning heading into a major earnings week carries unusual complexity when the underlying index has simultaneously posted record gains for the year and retreated more than 20% from its peak, a situation that frames the Nvidia report as a directional test for the entire chip trade rather than a single-stock event.
What today’s divergence tells you about reading index moves accurately
You now have the three-part framework: sector exposure gap, weighting methodology difference, and combined divergence outcome. Those three components explain today’s session, and they will explain the next time this happens, too.
The practical question to ask whenever you see a Dow-versus-S&P 500 divergence in the future is whether a single sector is driving the move, and whether that sector has uneven representation across the two indexes. If the answer to both is yes, the divergence is not a mystery. It is the architecture doing exactly what it was designed to do.
Index divergence signals have historical precedent in Dow Theory, which holds that a healthy bull market requires confirmation across industrial and transportation averages; when those averages diverge, the framework treats the gap as a warning about the rally’s structural integrity rather than noise.
The Dow’s legitimate strengths
None of this means the Dow is a broken gauge. Its 30-component, price-weighted construction gives it legitimate value as a measure of blue-chip, non-tech industrial performance. If you want to track how large US industrials, financials, and healthcare names are behaving, the Dow captures that. The SPDR Dow Jones Industrial Average ETF (DIA) is the primary vehicle for tracking or trading the index directly.
The problem is using it as a stand-in for the entire market. On a day like today, when semiconductor stocks are selling off broadly, the Dow’s 30 names tell you almost nothing about what is happening across the 500 names in the S&P 500 or the 3,000-plus names on the Nasdaq.
Index literacy is a practical skill, not an academic exercise. Misreading a Dow gain as broad market strength during a semiconductor selloff can give you a false sense of security in a portfolio that is heavily weighted toward the exact names dragging the S&P 500 and Nasdaq lower. Now that you know how the construction works, you will not make that mistake.
This article is for informational purposes only and should not be considered financial advice. Investors should conduct their own research and consult with financial professionals before making investment decisions.