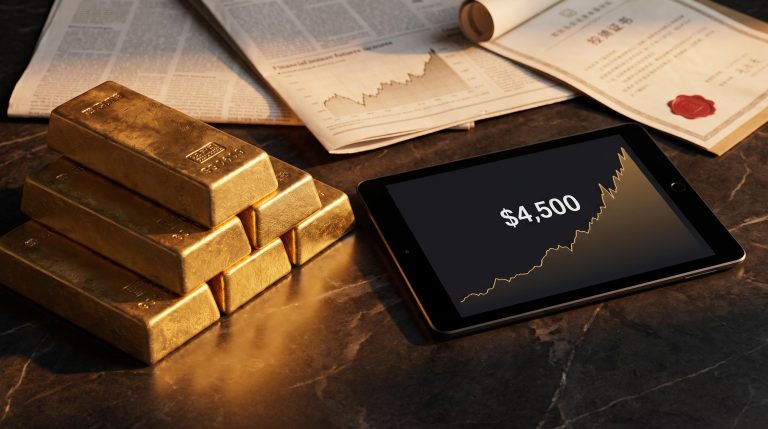
On Friday, 21 August 2026, gold crossed above the $4,600 per troy ounce mark, closing out the week at a three-month peak. Crude oil, meanwhile, held close to its strongest level in a month. Neither move had much to do with the supply-and-demand fundamentals of either commodity. The real engines are the Iran standoff, a weakening dollar, and declining real yields, three forces that have temporarily seized control of commodity pricing from the usual inputs.
That matters because any investor trying to read commodity prices as signals right now is looking at the wrong dashboard. Inventory reports, demand revisions, and production data have been marginalised. Macro forces and geopolitical risk premiums are doing the directional work, and until that changes, the usual analytical toolkit gives you incomplete answers.
Here is the mechanism behind each rally, why both can happen simultaneously without contradiction, and why two specific events next week, the PCE release on Wednesday 26 August and Fed Chair Kevin Warsh’s Jackson Hole keynote on Friday 28 August, will determine whether these advances hold or unwind. You leave with a precise interpretive frame, not a general awareness that commodities moved.
Gold’s move to a three-month high: what is actually driving it
Anchor data point: TradingEconomics recorded gold at approximately $4,622.8 per ounce intraday on 21 August 2026, a daily gain of roughly 2.3% and a three-month high, with the metal positioned for a potential third consecutive weekly gain.
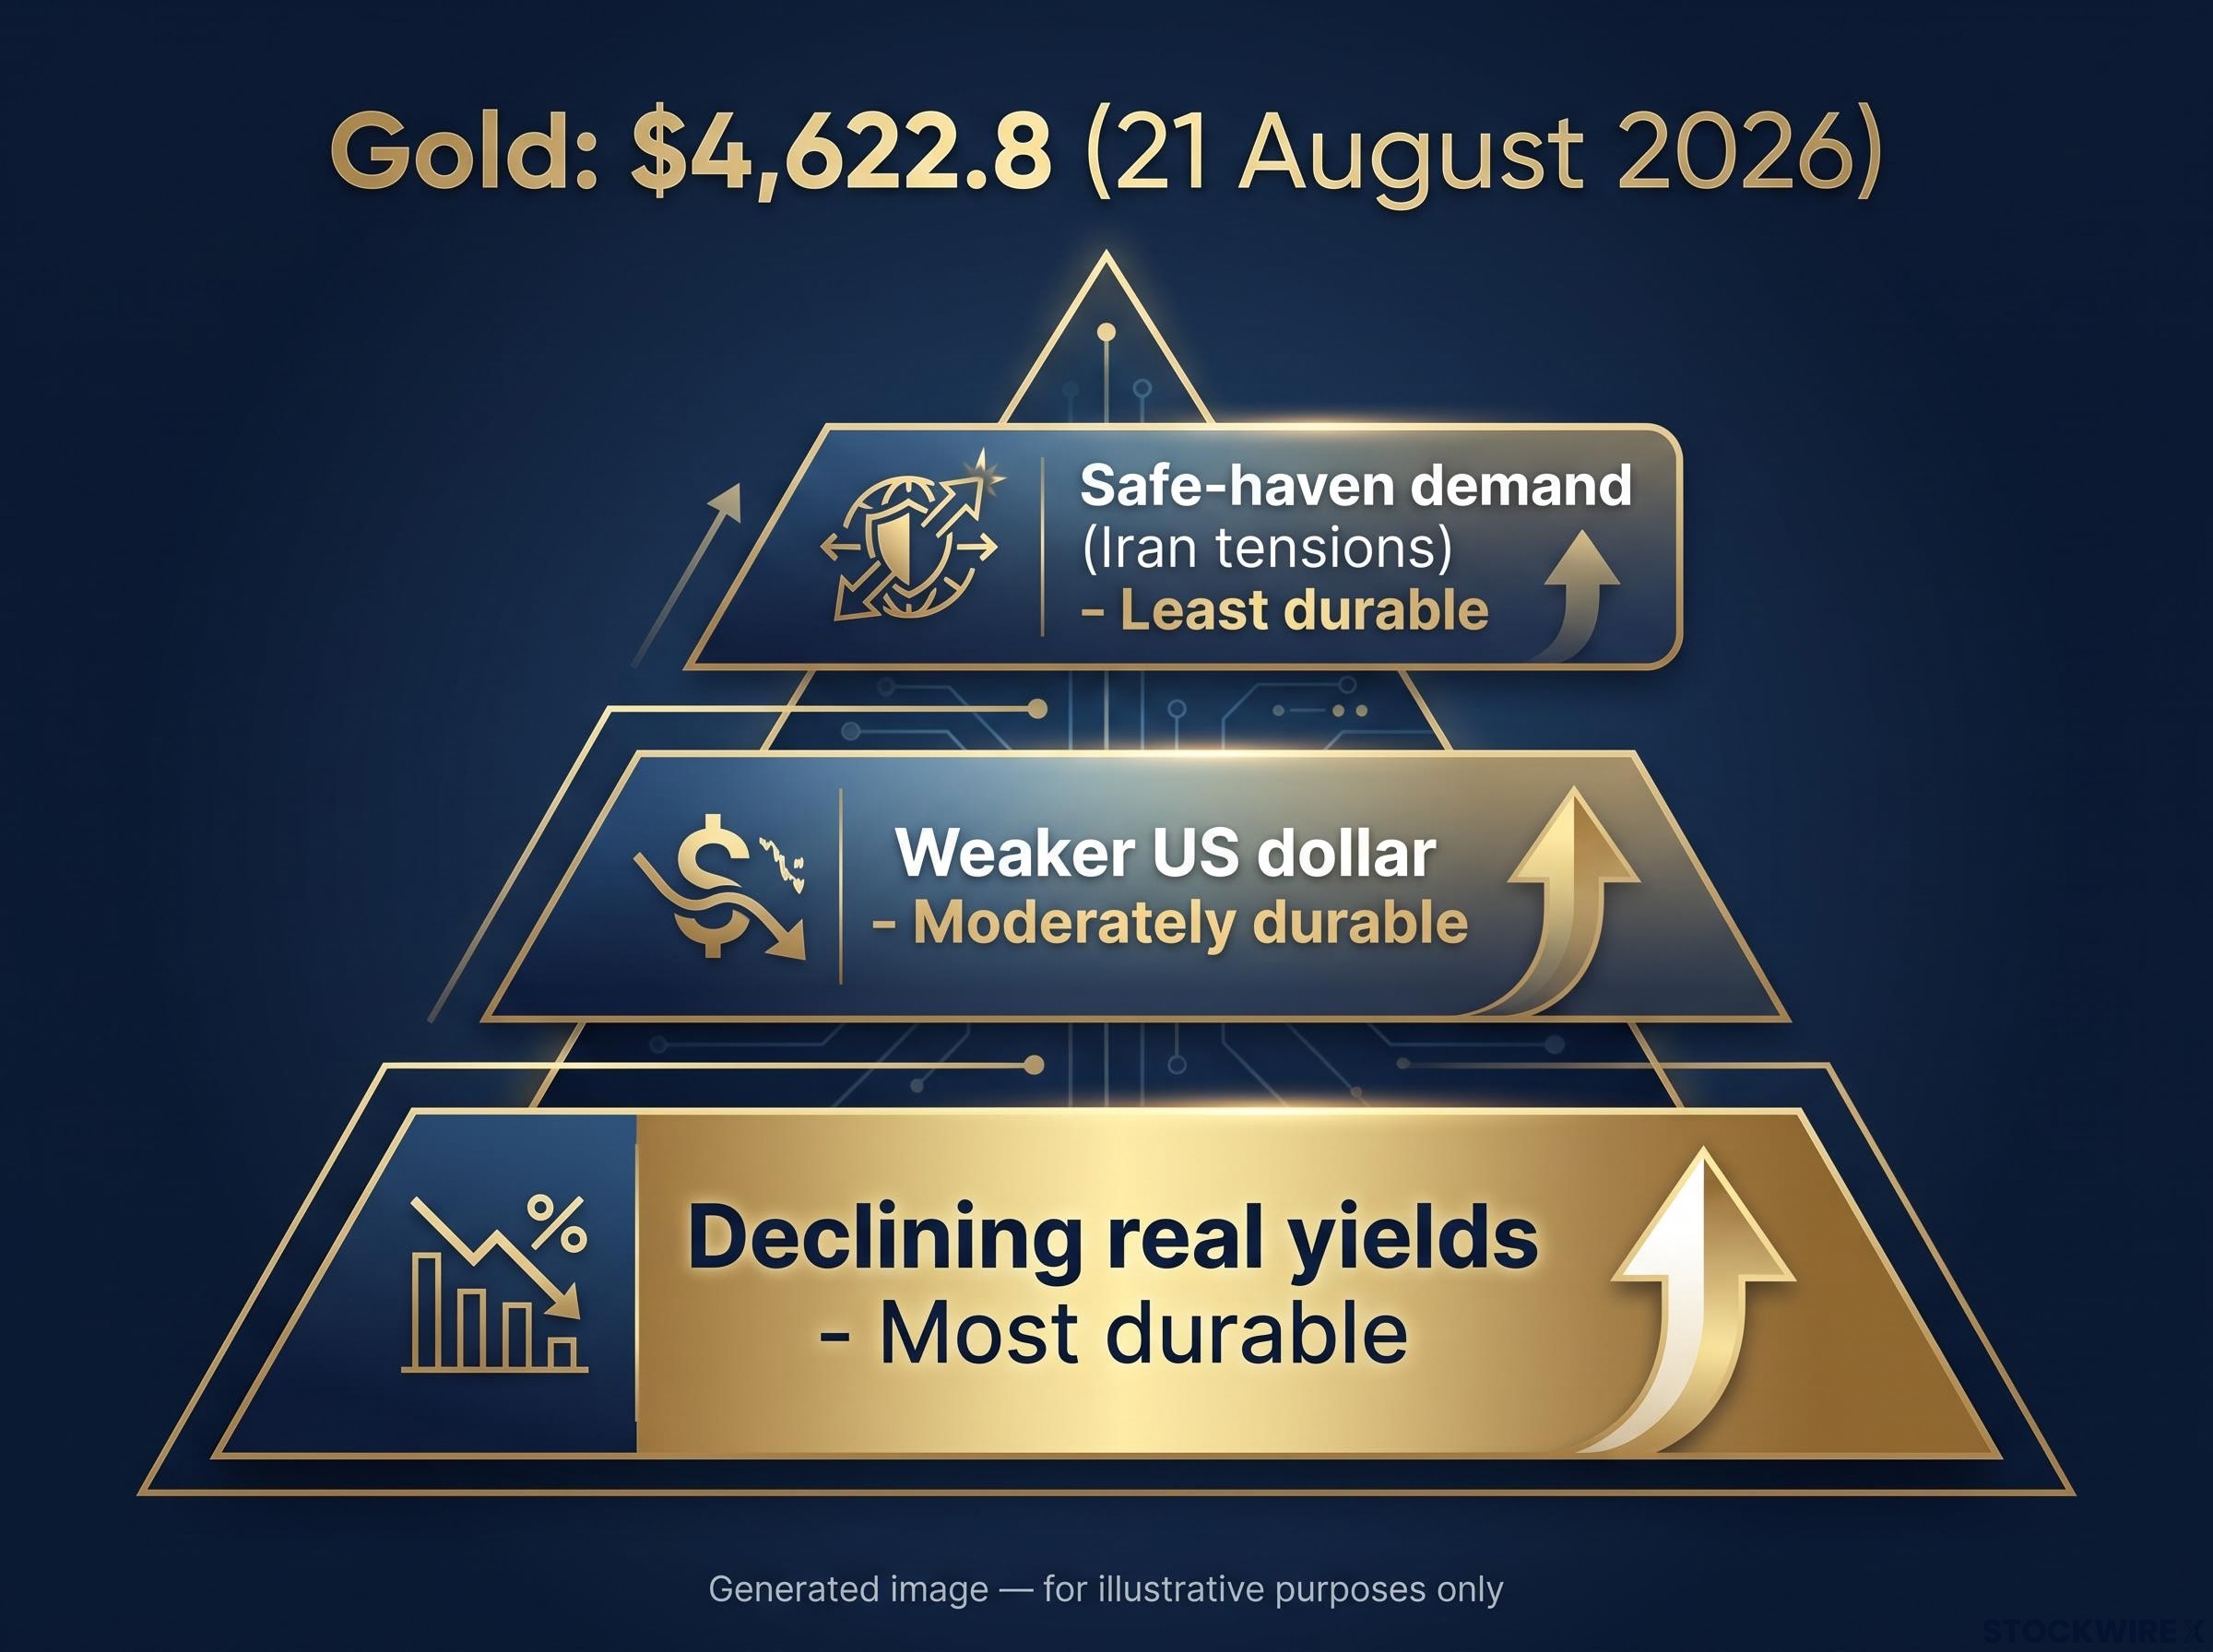
The price fact is striking. What matters more is the structure underneath it. Three distinct forces pushed gold to that level, and they differ sharply in how long they can sustain it.
Sequenced from least to most durable:
- Safe-haven demand from Iran tensions (fragile): geopolitical defensive flows move fast but reverse just as quickly once headlines calm
- A weaker US dollar (moderately durable): a softer dollar reduces gold’s cost in local-currency terms for non-US buyers, and dollar trends typically persist for weeks to quarters
- Declining real yields (most durable): lower real yields, the returns on inflation-protected Treasuries, reduce the opportunity cost of holding a non-yielding asset like gold, and this dynamic can persist across entire rate cycles
That sequencing tells you exactly where to watch for cracks. If Iran headlines calm, the safe-haven layer unwinds first. But as long as real yields stay depressed and the dollar stays soft, gold retains structural support regardless of geopolitical noise. Investors who treat this move as purely a geopolitical trade risk misreading the macro architecture underneath it.
When big ASX news breaks, our subscribers know first
Why oil is rallying on fear, not growth
WTI crude settled the week around the upper-$80s per barrel, posting its best close in roughly four weeks. The instinct is to read rising oil as a growth signal. That instinct is wrong in this environment.
Oil can rally in two distinct regimes, and the mechanism differs entirely:
- Growth-driven rally: demand expectations rise, consumption forecasts are upgraded, and oil advances because the world needs more of it
- Fear-driven rally: supply-disruption risk rises, and oil advances because the market prices the probability-weighted cost of interrupted output, regardless of demand conditions
The current move belongs to the second category. Masoud Pezeshkian, Iran’s president, maintained an aggressive public posture that kept the geopolitical risk premium alive. While Washington’s decision to pursue economic sanctions rather than direct military action took some of the sharpest supply-shock fears off the table, the breakdown in diplomatic progress has continued to place a floor beneath prices.
Hormuz supply risk has a documented history of producing precisely this configuration, with Brent swinging nearly $2 per barrel in a single May 2026 session as armed exchanges near the strait activated a probability-weighted disruption premium that moved independently of underlying demand conditions.
The absence of a data catalyst
The crude market entered the week without any scheduled oil-specific releases on the calendar, which underscores a broader point: with no fundamental data driving direction, price action is dictated almost entirely by geopolitical developments, leaving WTI acutely exposed to any shift in rhetoric from Tehran or Washington. Misreading this as a growth signal would lead to misaligned portfolio positioning, treating risk-premium strength as confirmation of economic momentum it does not represent.
How gold and oil can rally together without contradicting each other
A reader watching both metals and energy tick higher on the same day might reasonably ask: if gold is a safe-haven and oil is a risk asset, what is the market actually saying?
The answer is that gold and oil are not receiving a single signal. They are receiving two distinct signals from the same source.
Gold is responding through safe-haven demand and macro channels: the weaker dollar and declining real yields. Oil is responding through a supply-side risk premium: the probability-weighted cost of interrupted Iranian output. Both responses are rational. Both are simultaneous. And they do not contradict each other because they operate through entirely different transmission mechanisms.
| Attribute | Gold | Oil |
|---|---|---|
| Primary driver | Safe-haven demand + macro (real yields, dollar) | Supply-disruption risk premium (Iran) |
| Transmission mechanism | Opportunity-cost reduction and currency effect | Probability-weighted supply interruption |
| Shared tailwind | Weaker dollar lowers local-currency cost for non-US buyers | Weaker dollar lowers local-currency cost for non-US buyers |
The weaker dollar is the common lift that supports both commodities simultaneously, but it sits on top of each asset’s distinct driver. When gold and oil advance together in this configuration, the signal is not confusion. It is a single geopolitical event activating two commodity transmission mechanisms at the same time, which is analytically coherent.
The macro architecture behind both rallies: dollar, real yields, and the Fed
The Fed’s signalling posture is not background context for this commodity rally. It is one of the primary engines.
Gold’s pricing revolves around two mechanical inputs. First, real yields: when real yields (the return on inflation-protected government bonds, after accounting for expected inflation) decline, the opportunity cost of holding gold, which pays no yield, falls. Gold becomes more attractive relative to interest-bearing alternatives. Second, the dollar: a weaker dollar makes dollar-denominated gold cheaper for non-US buyers, directly supporting demand.
The transmission chain from upcoming data to gold is direct:
- The PCE inflation print informs expectations for the Fed’s rate path
- Rate expectations shift real yields
- Real yields move the dollar
- The dollar and real yields together move gold
Kevin Warsh, sworn in as Fed Chair on 22 May 2026, delivers the Jackson Hole keynote next week. His tone will feed directly into steps one and two of that chain, making it one of the most consequential single communications for gold positioning this quarter.
Warsh’s policy posture has already demonstrated its market impact: following his appointment, the 10-year TIPS real yield climbed to 2.22%, its highest level in over 12 months, a move that directly tightened the opportunity-cost channel through which gold pricing operates.
Any investor holding gold or oil right now is implicitly positioned on the outcome of next week’s Fed communications, whether they realise it or not.
How the same macro forces affect oil differently
Oil’s Fed sensitivity operates more indirectly. A weaker dollar provides the same common lift it gives gold, but oil’s primary directional driver in this regime remains geopolitical rather than monetary. An unexpectedly hawkish Fed signal could pressure crude through a stronger dollar and dampened risk appetite, but the geopolitical risk premium would cushion some of that impact. The Fed shapes oil’s environment; it does not drive oil’s thesis the way it drives gold’s.
PCE data and Jackson Hole: the two events that could break or extend these rallies
Two events next week will test whether the conditions sustaining both rallies remain intact.
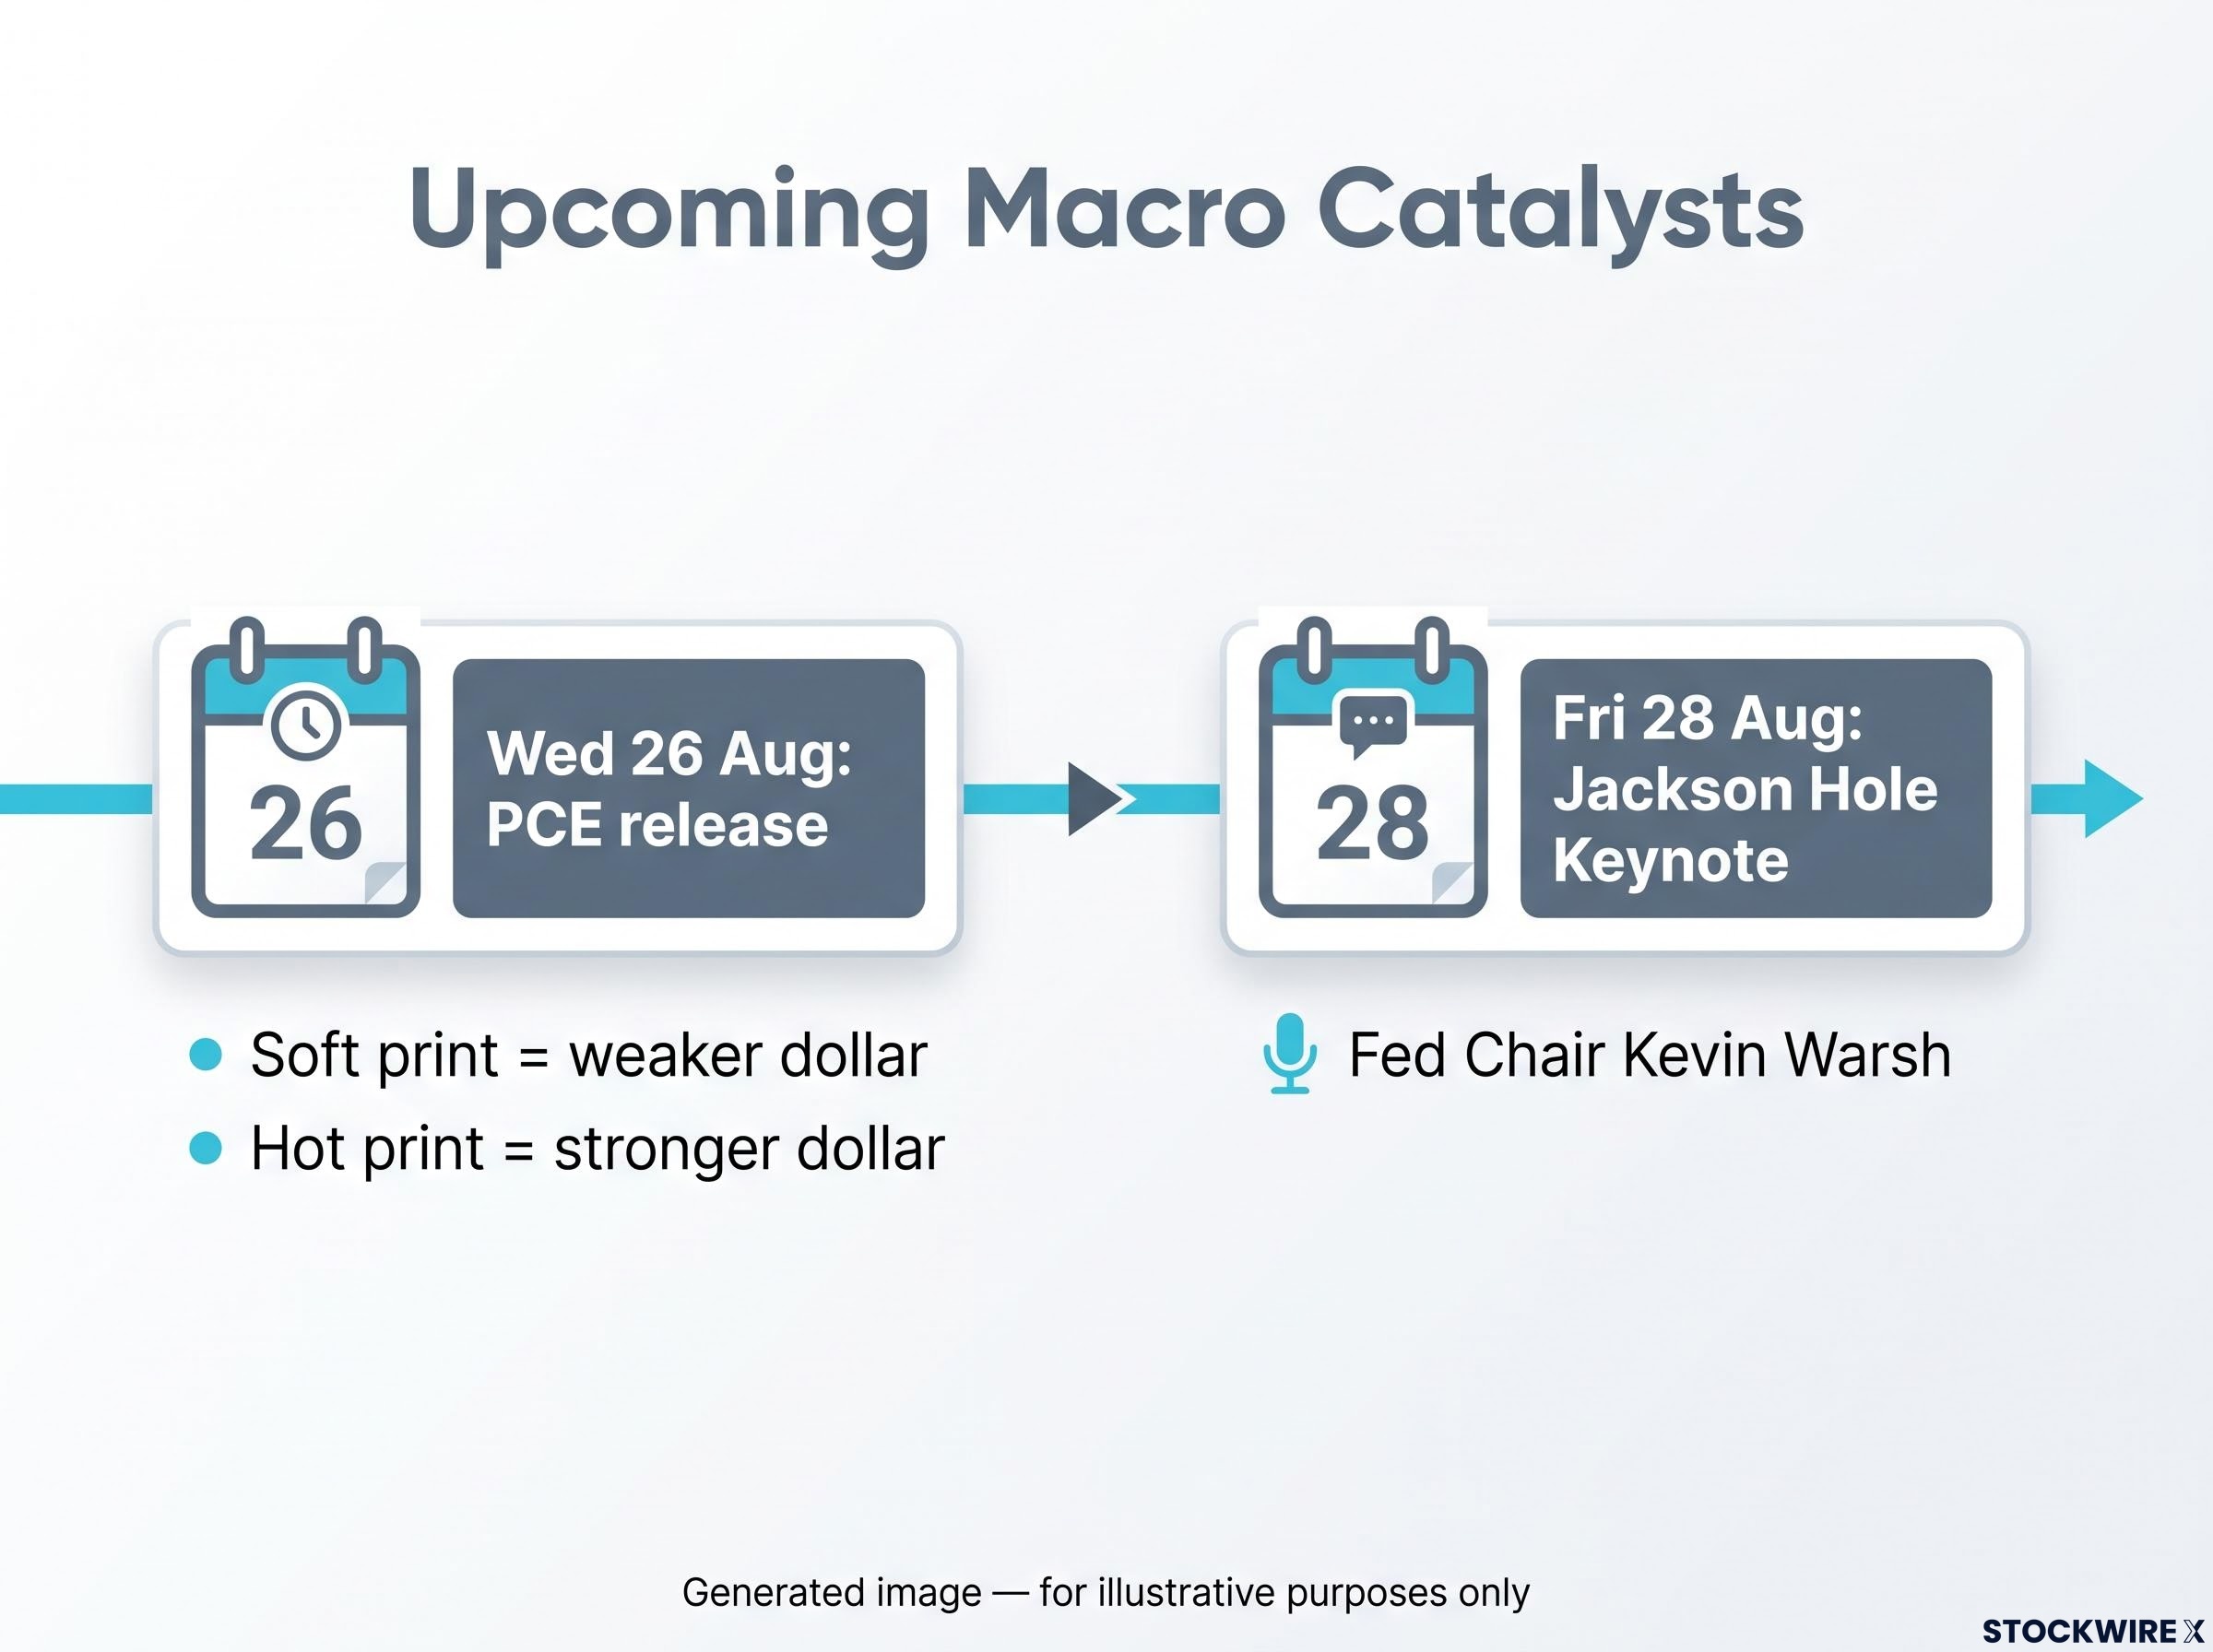
Wednesday 26 August: the PCE inflation release. A softer-than-expected print reinforces the “Fed will cut” narrative, extending dollar weakness and real-yield compression, both constructive for gold. A hot print reverses the logic and could trigger the first meaningful pullback in weeks.
PCE and geopolitical risk collisions have recurred throughout 2026 as a market structure pattern: when the June PCE print landed alongside the Iran ceasefire framework in the same week, the 2-year Treasury yield emerged as the cleanest real-time signal of which force was dominating, a lens that applies equally to the August setup.
Friday 28 August: Fed Chair Warsh’s Jackson Hole keynote. This is the higher-stakes event for gold specifically, given how directly the Fed-to-gold transmission chain operates.
For gold, Jackson Hole is the primary event. The directness of the transmission chain from Fed signals through real yields and the dollar to gold pricing makes Warsh’s keynote the single most consequential input for gold’s near-term trajectory.
For oil, both events are more indirect. A dovish Fed supports risk sentiment and a weaker dollar, both marginally constructive for crude. But oil’s primary catalyst remains geopolitical headline flow; an unexpected diplomatic development out of Tehran or Washington would move crude more than any PCE print.
| Event | Date | Bullish scenario | Bearish scenario |
|---|---|---|---|
| PCE release | Wed 26 Aug | Soft print extends dollar weakness and real-yield compression; gold advances, oil gets marginal tailwind | Hot print strengthens dollar, lifts real yields; gold pulls back, oil faces indirect pressure |
| Jackson Hole keynote (Warsh) | Fri 28 Aug | Dovish signal extends gold’s multi-week advance; supports broad risk sentiment for oil | Cautious tone on rate cuts triggers gold pullback; oil cushioned by geopolitical risk premium |
For any investor holding gold or oil into next week, the relevant question is not whether these commodities are fundamentally attractive. It is whether the specific macro and geopolitical conditions that created the current rally will still be in place by the close on 28 August.
What the next week’s data tells you before it arrives
The analysis above gives you something more useful than a prediction: an interpretive framework you can apply in real time as data arrives.
Three variables will determine direction over the next five trading days. Each affects gold and oil differently:
- Fed signalling tone from Warsh: affects gold most directly via the real-yield and dollar channels; affects oil indirectly through risk sentiment
- PCE-driven dollar trajectory: a soft print weakens the dollar and supports both commodities; a hot print strengthens the dollar and pressures both, though oil’s geopolitical floor provides a cushion
- Iran diplomatic headline flow: the dominant and least predictable variable for oil; secondary for gold unless escalation triggers a fresh wave of safe-haven demand
There is an asymmetry in this setup worth noting. Gold has more structural macro support through the dollar and real-yield channels, which makes it more sensitive to Fed signals but also more resilient to a calming of geopolitical headlines. Oil’s primary risk factor remains geopolitical and is harder to forecast from a data calendar.
If Iran headlines remain stalled and both PCE and Jackson Hole signal a patient Fed, both rallies are likely to give back at least a portion of their recent gains. That scenario should be modelled before it arrives, not after.
Positioning in either commodity over the next week is effectively a bet on at least one of those three variables. Knowing that explicitly allows for more deliberate risk management than treating the rally as a single undifferentiated commodity move.
For investors wanting to stress-test the analytical framework above against gold’s historical tendency to confound even well-constructed macro models, our full explainer on gold price prediction failures examines three documented rate cycles where gold produced outcomes that directly contradicted the most widely cited trading rules.
This article is for informational purposes only and should not be considered financial advice. Investors should conduct their own research and consult with financial professionals before making investment decisions. Forward-looking statements regarding Fed policy and commodity prices are speculative and subject to change based on market developments.
—