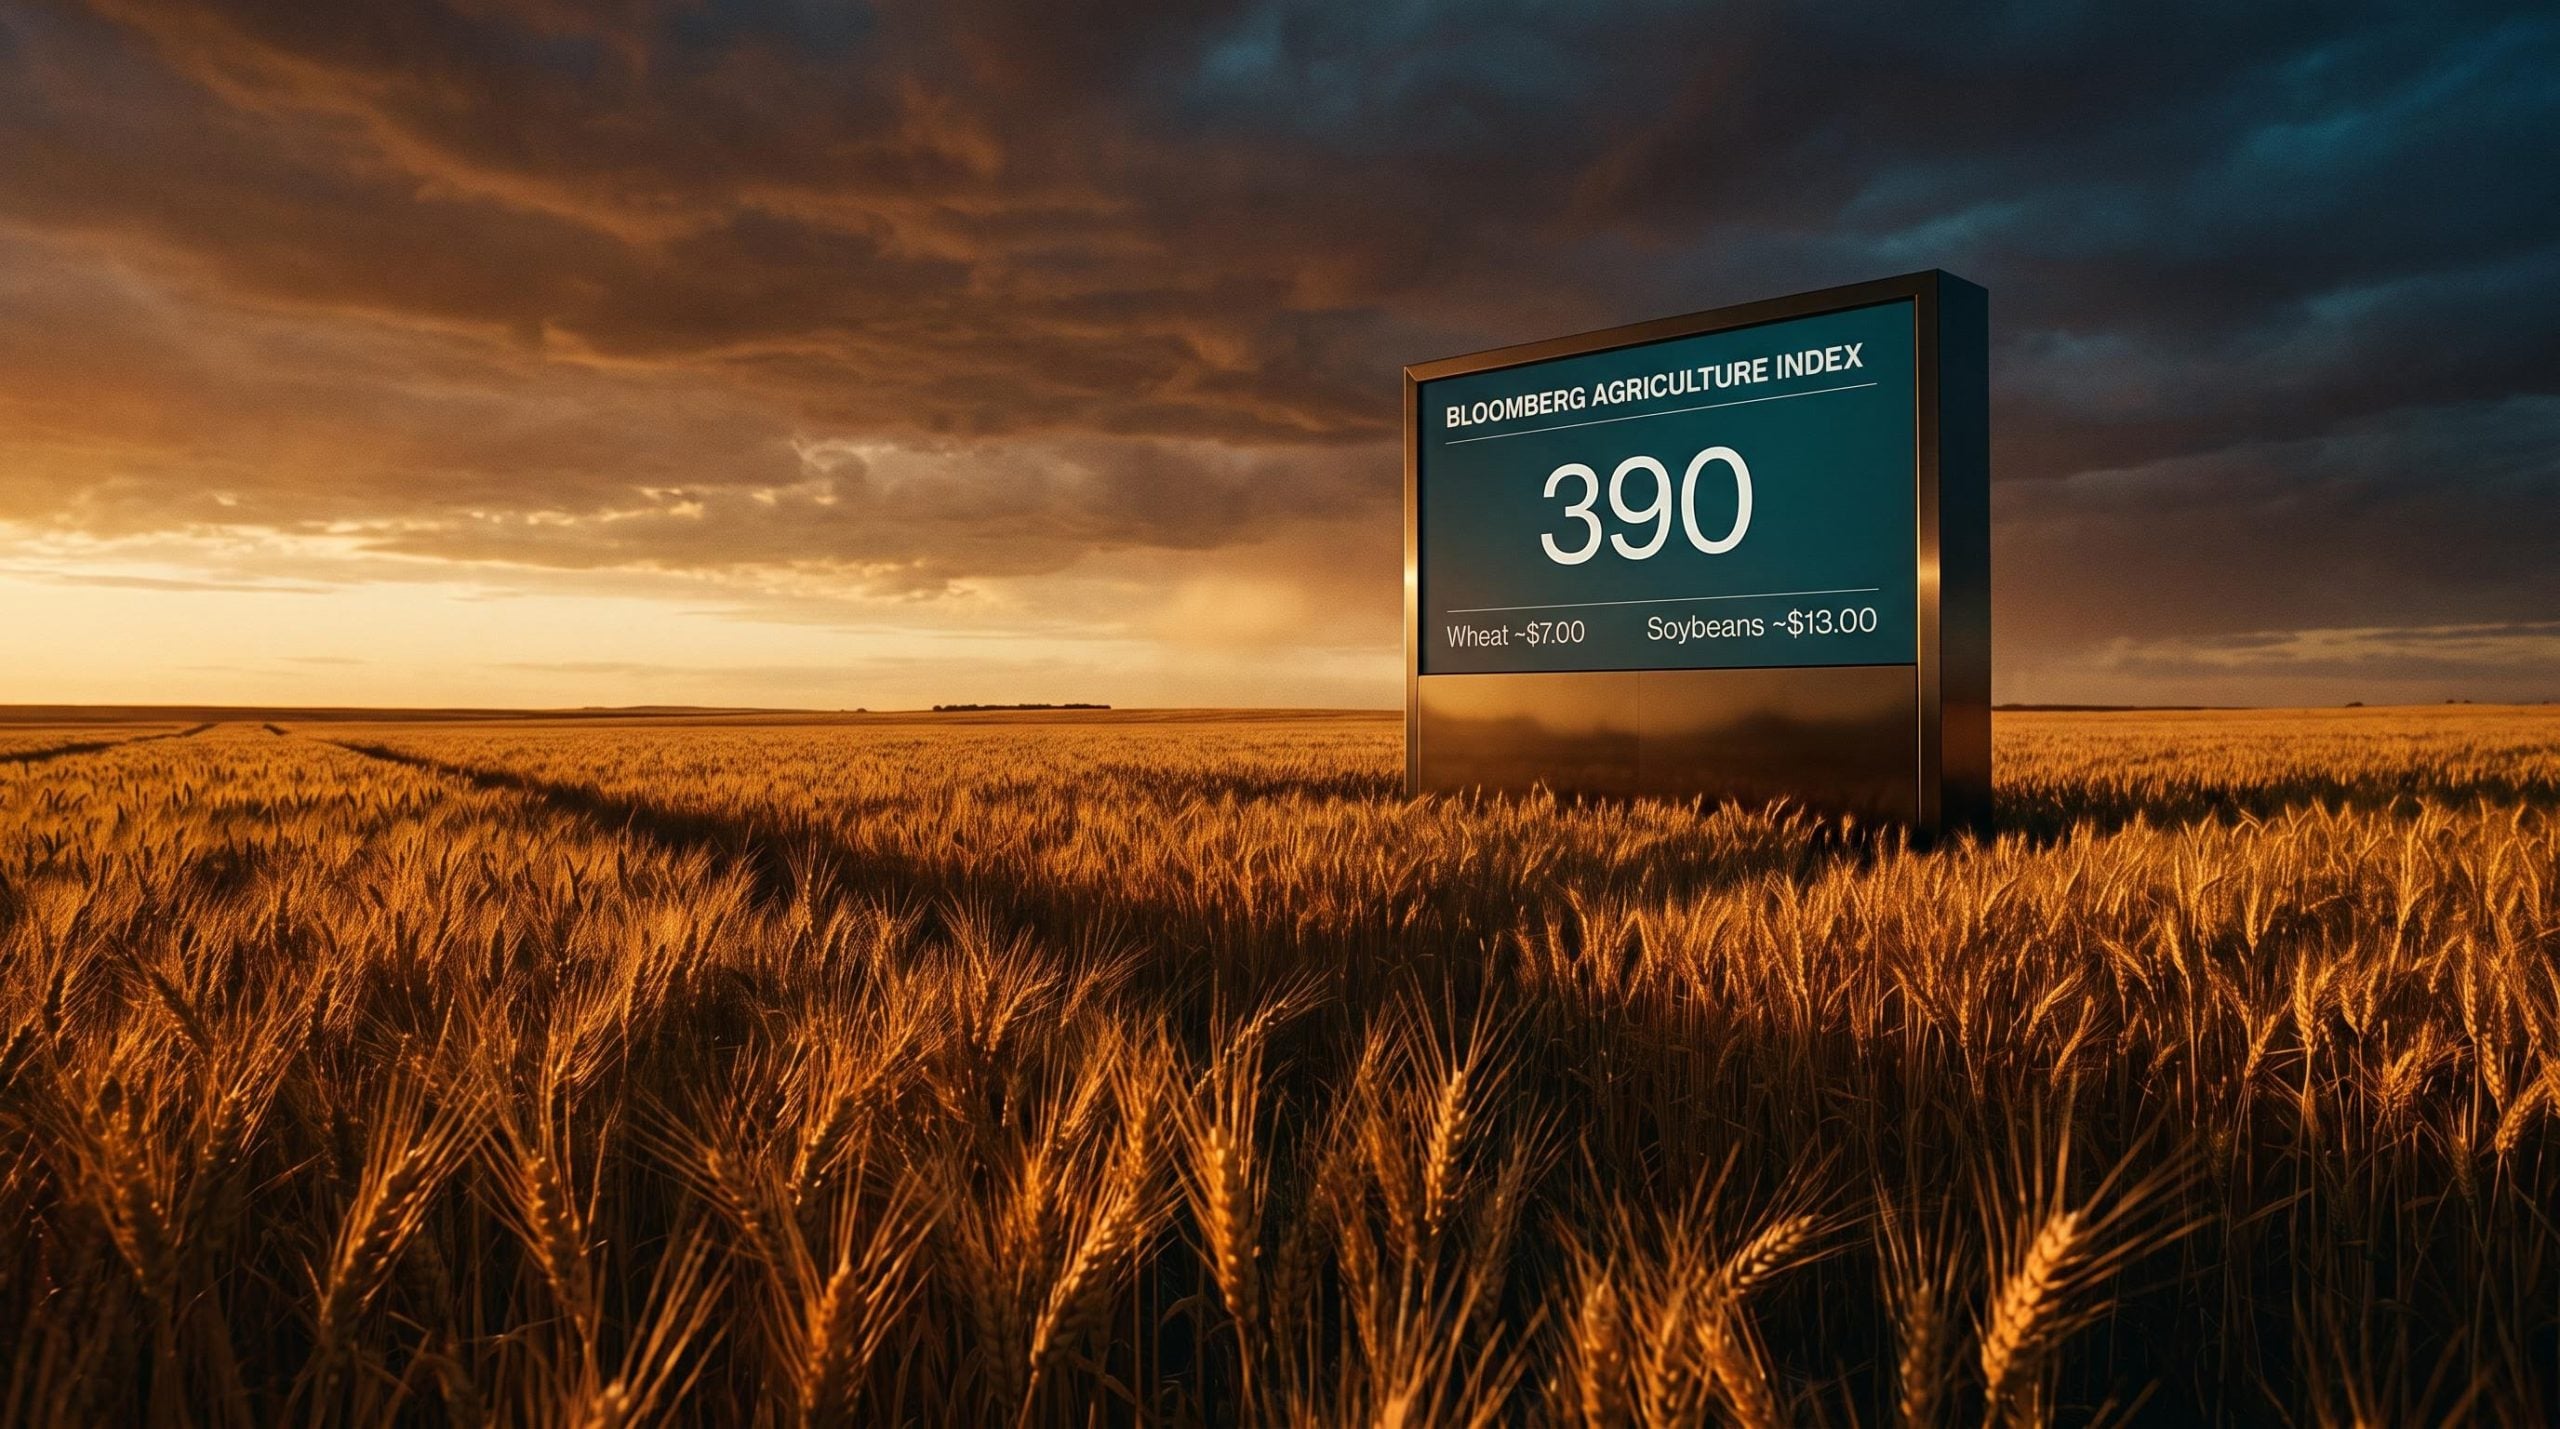
Financial media has spent weeks fixed on bond markets, rate expectations, and the next central bank decision. Meanwhile, a quieter but arguably more durable move has been unfolding in a corner of the market that tends to get attention only when grocery bills become a political issue. The Bloomberg Agriculture Index hit its highest level since May 2024 in August 2026, and the breadth of the advance suggests this is more than a weather headline.
This is not a spike driven by a single drought or a geopolitical shock to one crop. The move across wheat, corn, and soybeans reflects an accumulation of structural pressures, from fertiliser costs that have repriced the economics of food production to soil depletion risks that take more than one growing season to reverse. Demand has held up. Supply has not kept pace.
Here is what the data actually tells you about why agricultural commodity prices are rising, why the next leg may be harder to reverse than the last one, and what the implications are for food prices, inflation, and portfolio positioning over the next 12-24 months.
The political and consumer economy of a food-energy squeeze
Food and energy are the two most visible, highest-frequency purchases in any household budget. Their prices shape perceived inflation far more than their weighting in official consumer price indices would suggest, because they are the costs people see every day. Lower-income households feel it most acutely, allocating a disproportionately large share of income to groceries and fuel.
When official metrics that strip out food and energy show inflation moderating, but sticky-price indices and food components remain firm, a three-way disconnect opens up:
The headline inflation divergence between commodity-driven CPI components and core measures became particularly visible in the April 2026 US data, where fuel costs surged 28.4% annually while core CPI excluding food, energy, and shelter came in at just 2.3%, illustrating precisely the three-way disconnect between official metrics, consumer experience, and central bank credibility this agricultural cycle is now reinforcing.
- Consumer sentiment weakens. Households trust what they see at the checkout, not what the statistics office reports. Weak confidence can suppress discretionary spending even when aggregate economic data looks benign.
- Central bank credibility is tested. Persistent food inflation fuels inflation expectations that can make the overall disinflation process slower and more protracted, complicating the path to rate cuts.
- Political pressure on incumbent governments intensifies. Sustained food and energy price strength has historically generated electoral consequences, shifting economic policy in directions that are difficult to predict from a standard macro framework.
The political economy dimension matters for investors because the policy responses it provokes, whether subsidies, export restrictions, or delayed rate decisions, can themselves become sources of market volatility. Agricultural price strength is not just a commodity theme. It is a macro risk factor with second-order effects across equities, fixed income, and currencies.
When big ASX news breaks, our subscribers know first
Agricultural commodities on a bull run: the Bloomberg Index at a two-year high
The Bloomberg Agriculture Index tracks a basket of major agricultural markets spanning grains, oilseeds, soft commodities, and fibres, including corn, wheat, soybeans, soybean meal, sugar, cotton, and coffee. Its August 2026 print at a multi-year peak is not a development confined to any single market. It represents a repricing of the sector as a whole.
The advance has followed a sequential rotation across commodity sectors that Peter Boockvar, CIO at Bleakley Financial Group Wealth Partners, has characterised as a defining feature of the current cycle. In his framing, precious metals staged the first leg of the move, industrial metals followed, energy came next, and agricultural commodities have now emerged as the leading sector in the current phase.
Boockvar has described the progression as a sequential commodity bull market, with agricultural commodities now the leading sector in the current cycle phase, following the pattern set by precious and industrial metals in prior years.
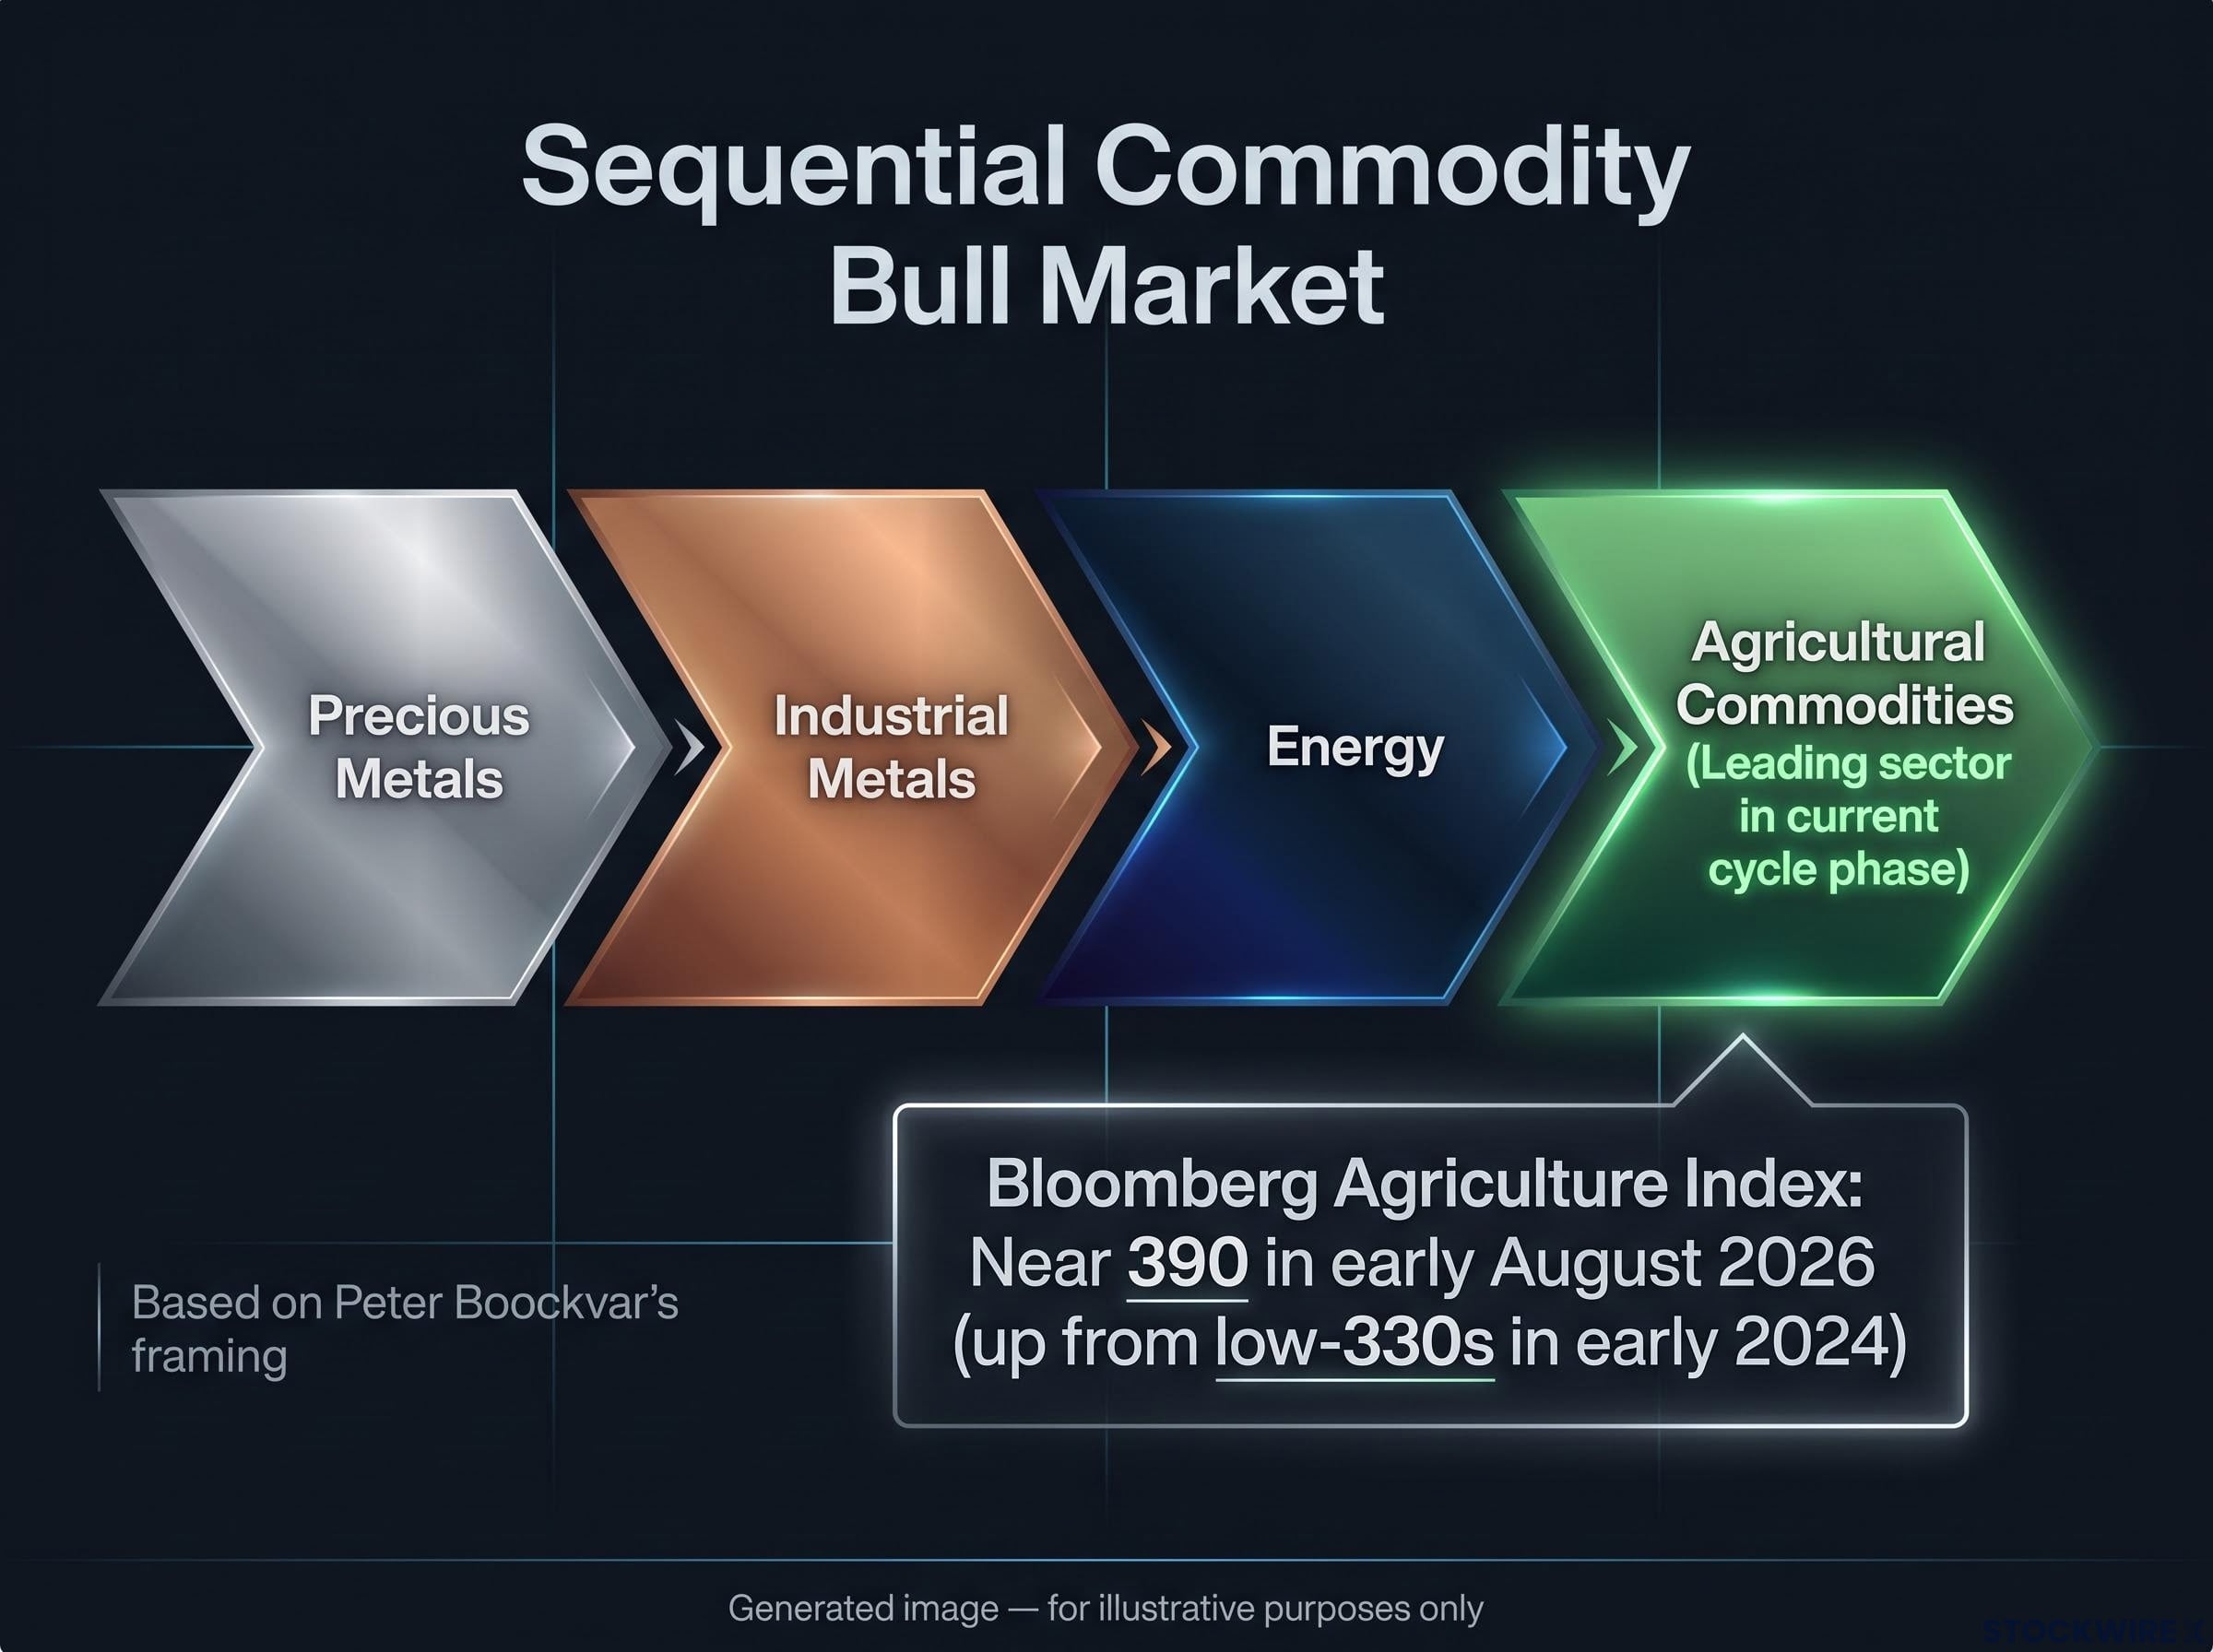
The agriculture spot index stood near 390 in early August 2026, up from the low-330s range in early 2024. Total-return measures reinforce the trend. This is a sustained advance, not a speculative spike. Individual grain prices tell the same story:
- Wheat: approximately $7.00 per bushel, sitting well above the price norms that prevailed before 2020 while remaining below the acute highs reached during the 2022 supply shock
- Corn: approximately $5.00 per bushel, consistent with a structurally repriced input cost environment rather than a transient spike
- Soybeans: approaching $13.00 per bushel, underpinned by firm global oilseed consumption
The breadth matters. Broad-based commodity moves tend to be stickier and harder to reverse than isolated supply disruptions in a single crop. When wheat, corn, soybeans, sugar, and coffee all advance together, the pricing signal is structural, not seasonal.
USDA global grain supply and demand data for the 2026/27 marketing year shows ending stocks for wheat and corn tightening relative to prior-year estimates, a pattern consistent with the structural supply constraint thesis rather than a transient seasonal shortfall.
What is actually driving the surge: the fertiliser affordability trap
The supply-side mechanism behind the current agricultural price move is self-reinforcing, and understanding the chain is the key to understanding why prices may stay elevated longer than a single growing season.
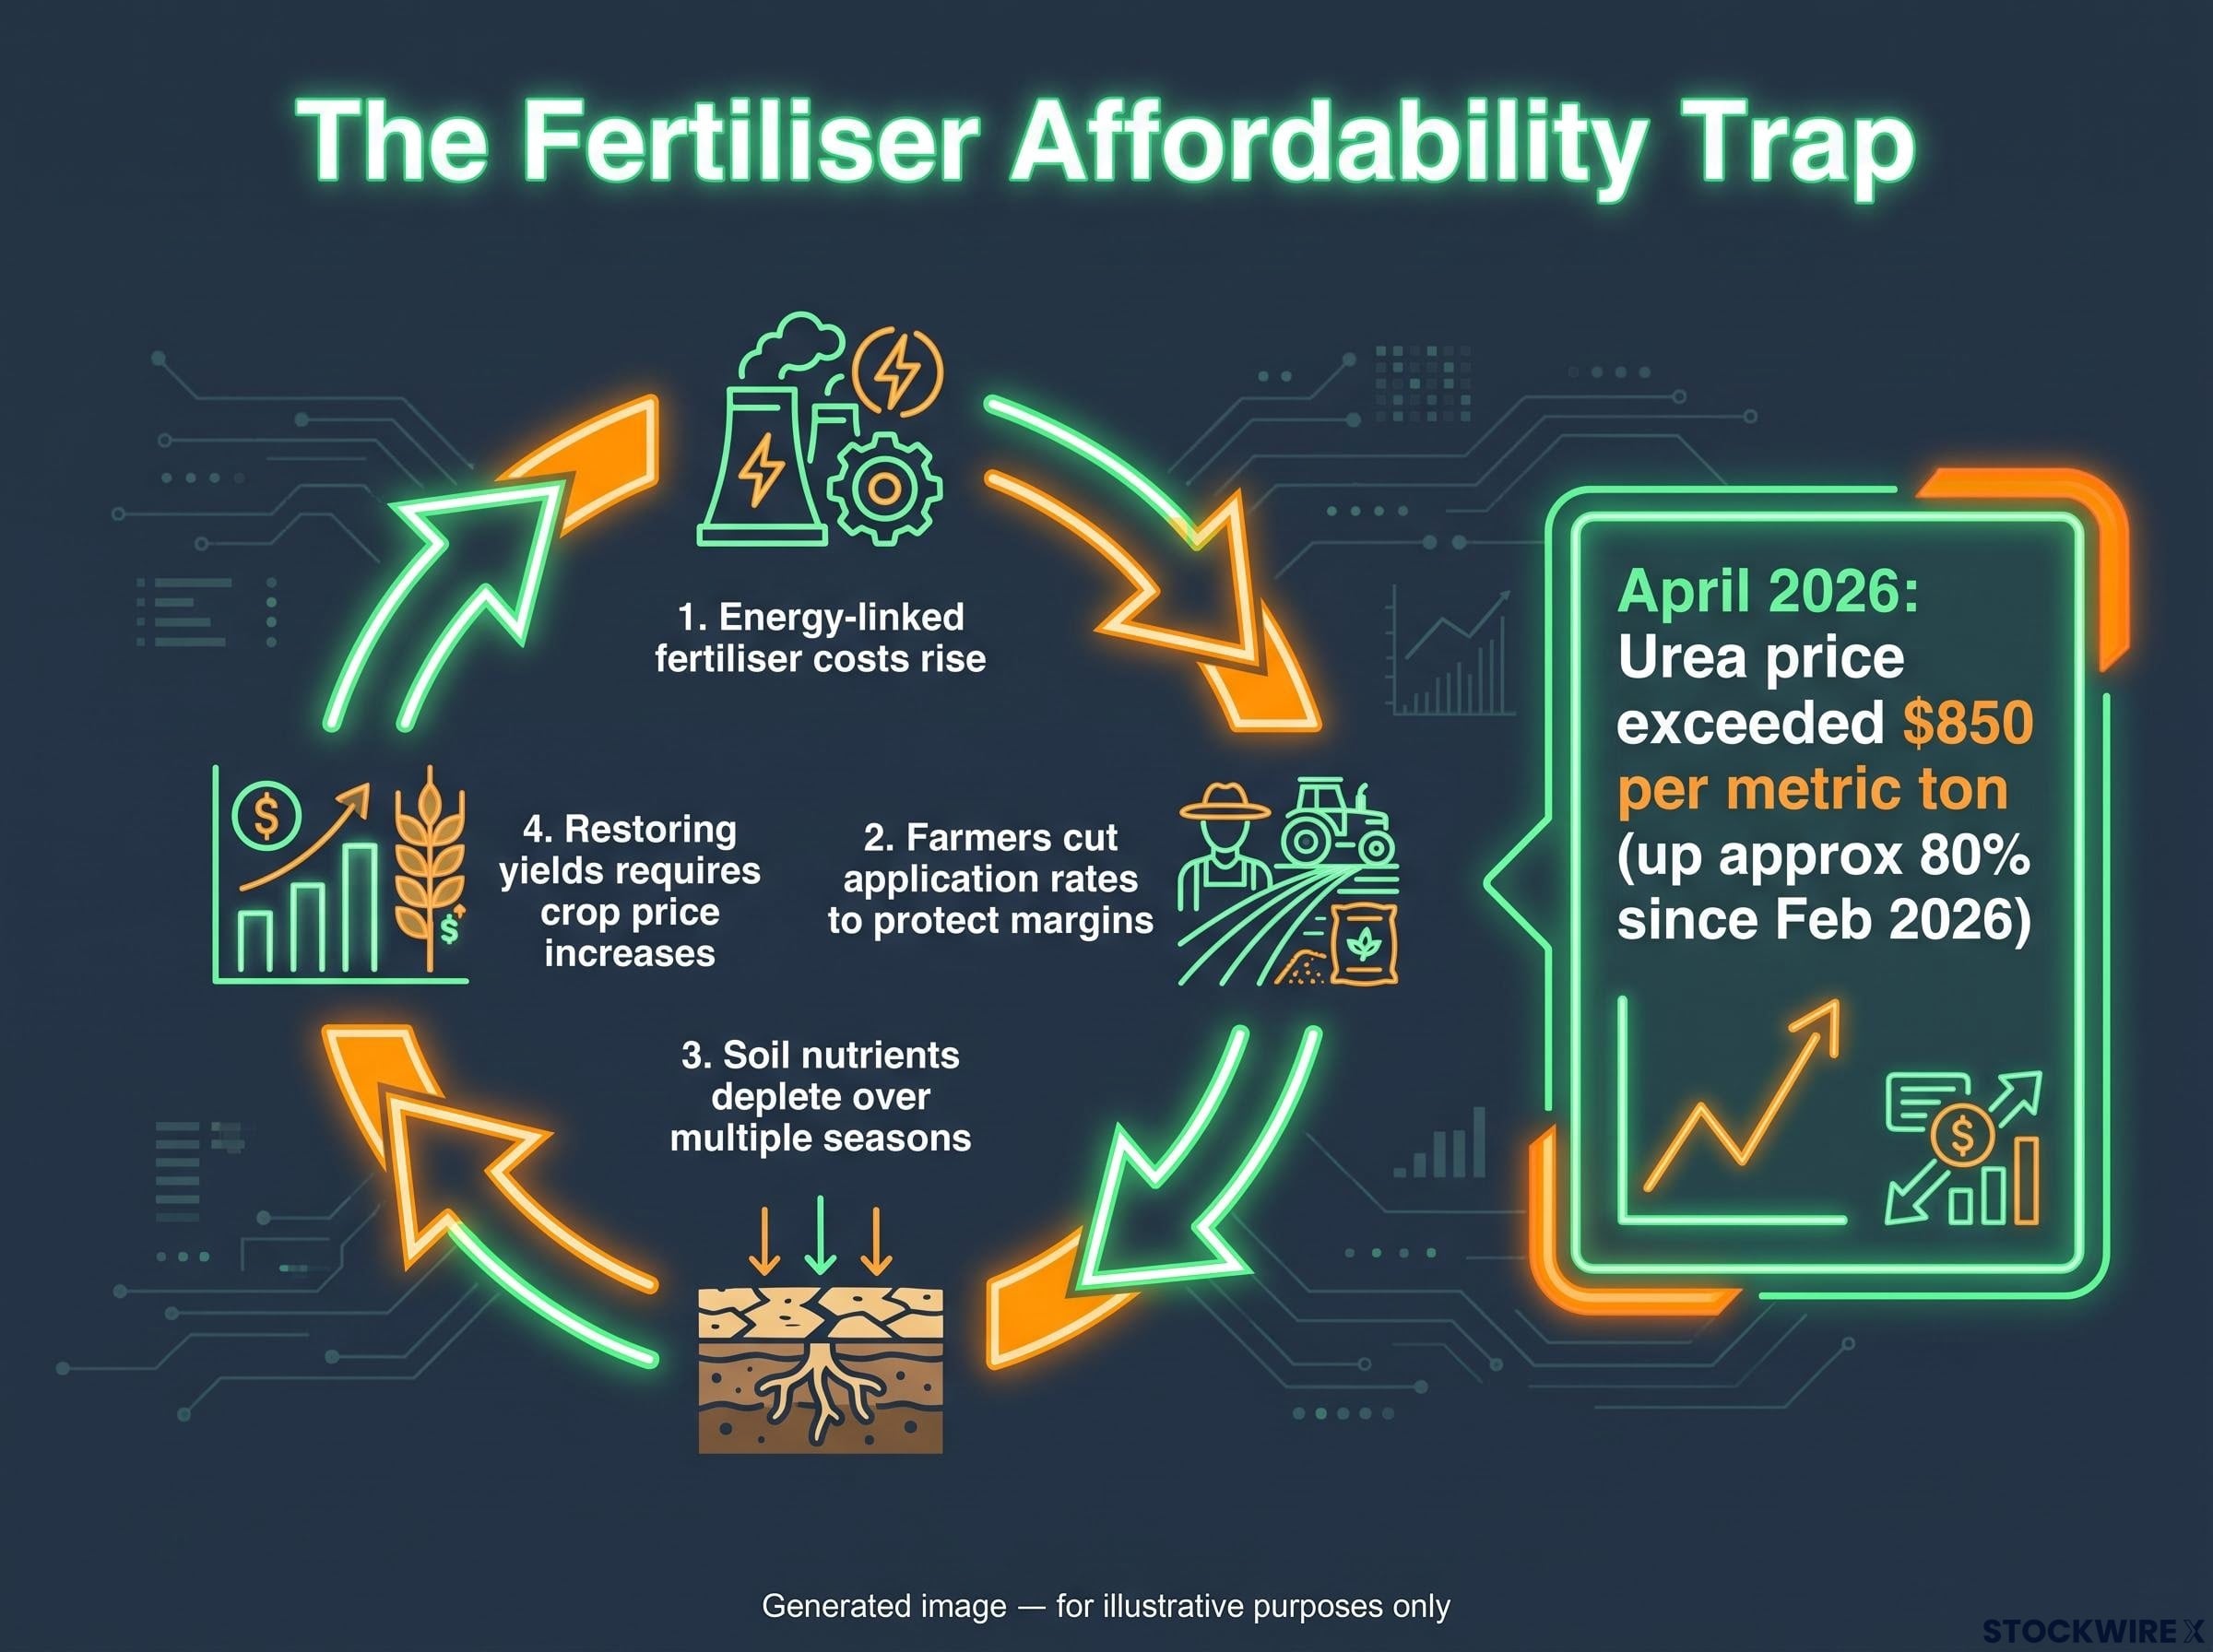
The fertiliser affordability trap works through four steps:
- Energy-linked fertiliser costs rise. Fertiliser production is tightly tied to natural gas and other energy inputs. When energy prices climb, fertiliser follows.
- Farmers cut application rates to protect margins. When fertiliser becomes expensive relative to prevailing crop prices, the rational economic response is to apply less.
- Soil nutrients deplete over multiple seasons. Under-application does not just reduce the current harvest. It draws down nutrient balances in the soil, creating yield losses that persist beyond a single year.
- Restoring yields requires the very crop price increases that make fertiliser affordable again. For farmers to justify a return to full application rates, crop prices must rise enough to restore margins, creating a self-reinforcing cycle.
The mechanism is not theoretical. Current data grounds it clearly.
| Metric | Value | Time Period |
|---|---|---|
| Urea price | Exceeded $850 per metric ton | April 2026 |
| Urea price increase | Up approximately 80% | Since February 2026 |
| Fertiliser price index change (Q1) | Rose more than 12% | Q1 2026 |
| Fertiliser price index level | Highest since October 2022 | April 2026 |
| Projected full-year index change | May rise more than 30% | Full-year 2026 |
The trap operates unevenly across regions. US, Brazilian, EU, and Indian producers face different input cost structures, subsidy regimes, and credit access conditions. That heterogeneity makes the global impact harder to quantify but does not make it less real. Fertiliser affordability relative to food prices tightened to levels not seen since mid-2022 in some periods during 2026.
Even if fertiliser prices ease in 2027 as projected, the yield losses from 2026 under-application will still be working through supply chains. Agronomic lags mean the full impact of this year’s reduced inputs may not show up in harvest data until the following season. Current grain prices may be pricing in less than the full extent of the shock.
The Strait of Hormuz closure has functioned as an accelerant to the fertiliser supply disruption already underway, with the FAO confirming that tanker flow restrictions are raising urea and phosphate prices and creating a direct transmission channel from the energy crisis into global crop economics.
Can South America offset a global under-fertilisation shock?
The bull case for a natural price ceiling rests heavily on South America. Brazil and Argentina operate as global swing producers, and their structural advantage is real: double-cropping systems, running soybeans followed by corn, allow a supply response within roughly six months rather than the full seasonal cycle that single-crop systems in the Northern Hemisphere require.
That flexibility genuinely matters. When prices spike, South American producers can plant more, harvest faster, and push additional supply onto global markets within half a year. It is a buffer that no other major producing region can match at the same speed.
Where the swing-producer thesis breaks down
Three structural constraints cap South America’s buffering capacity:
- Exposure to the same input cost environment. Brazilian and Argentine producers face the same volatile fertiliser market as everyone else. The affordability trap applies to them too, meaning their production costs rise alongside the global price signal that is supposed to incentivise more planting.
- Weather variability. El Niño and La Niña regimes strongly affect harvests across both countries and can override price incentives entirely. A favourable price signal means nothing if rainfall patterns destroy yields.
- Infrastructure bottlenecks. Storage capacity, port throughput, and transport logistics in Brazil in particular can limit how quickly additional production reaches export markets, even when yields are strong.
For investors inclined to assume South American expansion will cap any global grain rally, the calibrated read is this: the buffer is meaningful but time-limited and weather-dependent. South America can damp a structural under-fertilisation shock. It cannot neutralise one.
Why food prices do not fall as fast as they rise
When upstream input cost pressures eventually ease, consumer food prices rarely retrace their gains in full. Instead, they tend to consolidate at a higher level, as retailers and food-service businesses use the margin relief to repair profitability rather than passing savings back to shoppers. This dynamic, whereby price increases are transmitted quickly but price reductions are not, is known as the ratchet effect.
The ratchet effect is the tendency for prices to rise quickly in response to cost increases but decline slowly, or not at all, when those costs fall. In food markets, it means the price you pay at the supermarket tends to go up faster than it comes down.
Euro-area data provides the clearest empirical case study. During the 2022 inflation surge, the monthly frequency of price changes rose to approximately 12%, up from a pre-pandemic average of around 8%. Retailers were repricing faster and more aggressively than at any point in recent history.
Euro-area food inflation peaked at 15.5% in March 2023, then decelerated substantially, but averaged approximately 2.9% in 2025, still above the pre-pandemic long-term average of approximately 2.2%. The floor never returned to baseline.
The distinction between food categories matters:
- Fresh food shows seasonal corrections and can fall meaningfully when supply conditions improve
- Processed food prices have shown greater persistence, with manufacturers and retailers maintaining elevated pricing even as input costs eased
The persistence of elevated food prices, even as commodity costs moderate, means that upstream relief does not translate cleanly into lower supermarket bills. For both consumers and central banks, expecting a full reversal of recent food price gains is likely to prove mistaken, even if the agricultural commodity cycle begins to turn.
The ratchet effect in food prices sits within a broader argument about generational inflation regimes, where analysis of 150 years of data suggests inflation moves in sustained multi-decade cycles rather than mean-reverting episodes, making a clean return to pre-pandemic food price norms historically unlikely on any near-term horizon.
What the data says about where agricultural prices go from here
Three variables will most determine the agricultural price outlook over the next 12-24 months:
- Fertiliser price trajectory into 2027. Projections suggest the fertiliser price index may rise more than 30% for full-year 2026 before potentially easing in 2027. Whether that easing materialises, and how quickly, will determine whether farmers restore full application rates or whether the yield drag extends further.
- South American weather conditions during the November-February planting and growing season. A favourable weather outcome across Brazil and Argentina would provide the most effective near-term offset to Northern Hemisphere supply pressures. An El Niño or La Niña disruption would remove that buffer entirely.
- Central bank sensitivity to sticky food inflation. If food components continue to hold up headline inflation measures, the pace and depth of rate cuts in major economies could be constrained, with knock-on effects for equity valuations, currency dynamics, and consumer spending.
The risk is asymmetric. The downside scenario, where fertiliser costs ease, South American harvests come in strong, and food inflation moderates, is plausible but requires multiple favourable conditions to align simultaneously. The upside scenario, where yield losses from 2026 under-application extend into 2027, requires only that the dynamics already in place continue.
Agricultural commodity prices returning to pre-2020 norms would require a reversal of the fertiliser cost structure, a sustained run of favourable weather across major producing regions, and a demand-side shock. That path is considerably longer than a single growing season.
The burden of proof sits with those expecting a sharp reversal, not with those expecting the current level to persist or extend. For positioning purposes, the framework below maps the agricultural cycle thesis to specific asset types.
| Asset Type | Investment Logic | Relevant Risk Factor |
|---|---|---|
| Equipment manufacturers | Benefit from farm capital spending cycles driven by improved agricultural economics | Sensitivity to farm credit conditions and interest rates |
| Fertiliser producers | Volume recovery possible even if fertiliser prices ease, as higher grain prices restore full application rates | Energy cost exposure; demand dependent on crop price levels |
| Crop-chemicals and diversified agribusiness | Broader value-chain exposure to the agricultural cycle | Regulatory risk; weather-driven demand variability |
| Inflation-linked bonds (TIPS and equivalents) | Persistent food inflation supports real-return instruments | Duration risk if real yields rise sharply |
| Short-duration nominal bonds | Consistent with the view that long rates face upward pressure from sticky inflation | Opportunity cost if disinflation accelerates faster than expected |
As of August 2026, Boockvar has positioned the portfolios he manages with roughly a third of exposure in commodities and commodity-related equities, shorter-duration US fixed income, and international equities alongside emerging market bonds, reflecting a view that the dollar faces sustained downward pressure. For most investors, agriculture-linked equities provide more practical access than direct futures, which carry roll-yield complications and leverage risk.
Agricultural real estate investment provides an alternative access point to the structural commodity cycle, with listed farmland vehicles offering CPI-linked revenue streams and long weighted-average lease expiries that insulate returns from short-term commodity price volatility while retaining upside exposure to improving agricultural economics.
The fertiliser producer sub-sector deserves particular attention. If grain prices rise enough to restore full application rates, fertiliser volume recovery can drive earnings improvement even without further price increases in fertiliser itself. That volume-driven asymmetry represents a relatively under-appreciated entry point.
This article is for informational purposes only and should not be considered financial advice. Investors should conduct their own research and consult with financial professionals before making investment decisions. The thesis presented is a multi-year thematic framework, not a short-term trading call. Past performance does not guarantee future results. Financial projections are subject to market conditions and various risk factors.