
The EIA just reported that U.S. crude inventories rose by 4.4 million barrels in a single week, and WTI barely flinched. If your instinct was “that sounds bearish, why isn’t oil falling?”, that gap between what you expected and what actually happened in the price is exactly what this guide will resolve.
Most retail investors encounter oil market news as a stream of disconnected headlines: inventory builds, resistance levels, RSI readings, OPEC quotas. Without a framework connecting those signals, the noise drowns out the actual information. A repeatable reading process changes that, turning weekly data releases and price charts into a coherent picture you can act on.
Here is the framework you will be able to apply every Wednesday after reading, using today’s WTI setup as the worked example. Every concept gets defined the moment it appears, and every data point gets connected to what it means for your position.
What moves the price of crude oil (and what you can actually track)
Most investors assume oil prices are driven by geopolitics and OPEC headlines. That is partly true, but it misses the signals you can actually observe and act on every week.
WTI (West Texas Intermediate) is the primary U.S. crude benchmark. It is a light, sweet crude, meaning it has relatively low density and low sulphur content, which makes it easier and cheaper to refine into petrol, diesel, and jet fuel. WTI is priced for delivery at the Cushing, Oklahoma hub, a major pipeline junction, which is why it behaves differently from international benchmarks like Brent. As of 19 August 2026, WTI is trading in the $84-$86 range.
Five forces drive the price:
- Global supply-demand balance: when the world consumes more oil than it produces, prices rise, and vice versa
- OPEC/OPEC+ production decisions: OPEC is an alliance of 12 oil-producing countries that votes on output targets at meetings held twice a year; OPEC+ broadens that coalition to roughly 10 further producers outside the original group, with Russia being the most significant
- Geopolitical disruptions: armed conflicts, sanctions, and political instability can remove supply from the market overnight
- U.S. Dollar strength: because crude is traded globally in dollars, a stronger dollar makes oil more expensive for foreign buyers and tends to push prices lower
- Weekly inventory data: falling inventories suggest demand is outpacing supply (bullish); rising inventories suggest the opposite (bearish)
The EIA’s overview of OPEC and OPEC+ details how production quotas are allocated across member nations and how the broader OPEC+ coalition coordinates with non-member producers like Russia, providing the institutional context behind the output targets that surface regularly in weekly oil market commentary.
Here is the distinction that matters for your weekly process: OPEC decisions and geopolitical shocks are unpredictable and largely untrackable in real time. But weekly inventory data and technical chart indicators are observable, repeatable, and available to you every single week. Those two categories are where your analytical routine lives.
Geopolitical supply shocks sit in a different analytical category from inventory data precisely because they are unpredictable: when US-Iran nuclear talks collapsed in May 2026, Brent dropped $4.64 in a single session, a move that no weekly EIA routine could have anticipated but that technical levels and momentum indicators helped traders navigate after the fact.
When big ASX news breaks, our subscribers know first
How the EIA weekly report works, and what the current data is telling us
The Energy Information Administration (EIA) Weekly Petroleum Status Report measures the volume of crude oil sitting in U.S. commercial storage and tracks how that figure changed week over week. A “build” means inventories rose, which typically signals that supply is exceeding demand, a bearish signal. A “draw” means inventories fell, suggesting demand is outpacing supply, which is bullish.
But the raw number is not the most important thing. What really moves markets is the surprise: the gap between what analysts expected and what the EIA actually reported. A 5 million barrel build that the market already priced in barely registers. A 2 million barrel build that analysts expected to be a draw can move prices sharply. The surprise is the signal; the headline number is just context.
For the week ended 7 August, U.S. commercial crude stocks jumped 17.4 million barrels to 424.4 million barrels, the largest weekly gain in approximately 3.5 years.
That was followed by another build. For the week ended 14 August, stocks rose an additional 4.405 million barrels to 428.8 million barrels, marking a third consecutive weekly increase. Both figures are bearish headline signals: more oil is being stored because it is not being consumed or exported at the expected pace.
And yet WTI is still trading in the mid-$80s. That non-reaction is itself a piece of data. When price refuses to fall on bearish inventory numbers, something else in the market structure is absorbing the selling pressure. Finding that “something else” is the analytical task, and the technical framework in the next section gives you the tools to do it.
Structural price floors are one reason bearish inventory prints can fail to move prices: when strategic petroleum reserve replenishment creates government-mandated buy demand at lower levels and war-risk insurance premiums persist on actuarial timescales, the market absorbs selling pressure that the headline data alone would suggest should push prices sharply lower.
Here is the five-step routine you should run every time the EIA report drops:
- Check the analyst forecast before the release
- Compare it to the actual reported number
- Note the size and direction of the surprise
- Watch WTI price action for the first 30-60 minutes after release
- Ask whether price is moving with the data or against it
That fifth step is the one most retail investors skip, and it is the most important. Price moving against the data tells you the market has a stronger underlying conviction than the single headline number suggests.
The principle that the surprise matters more than the headline number extends to every component of the weekly report, and reading US oil inventory data requires separating the crude figure from concurrent gasoline builds, SPR releases, and Cushing-specific movements that can each tell a contradictory story.
Reading the chart: moving averages, key levels, and WTI’s current structure
A moving average takes the closing prices over a set number of days and calculates the average, creating a smoothed line on the chart that filters out daily noise. Three timeframes matter most for oil:
- The 21-day simple moving average (SMA) tracks the short-term trend
- The 100-day SMA captures the medium-term direction
- The 200-day SMA reflects the long-term structural trend
The principle is straightforward: when price is above a key moving average, that average tends to act as a floor where buyers step in (support). When price is below a key moving average, that average tends to act as a ceiling that sellers defend (resistance).
Right now, WTI’s moving average map tells a specific story. The 21-day SMA sits near $82, providing short-term support. The 100-day SMA near $86 is acting as the primary overhead barrier. The 200-day SMA near $76 represents deeper structural support. WTI is trading above both the 21-day and 200-day averages but below the 100-day, which tells you the long-term structure is bullish but the near-term path is capped. This is a market building tension around a specific decision point, not drifting without direction.
The most important level on the chart right now is the $86.65-$86.70 confluence zone, where the 100-day SMA and a descending trend line intersect. A decisive break and hold above that band would convert it from resistance into support and clear the way for a run toward the $92.25 high recorded in July 2026.
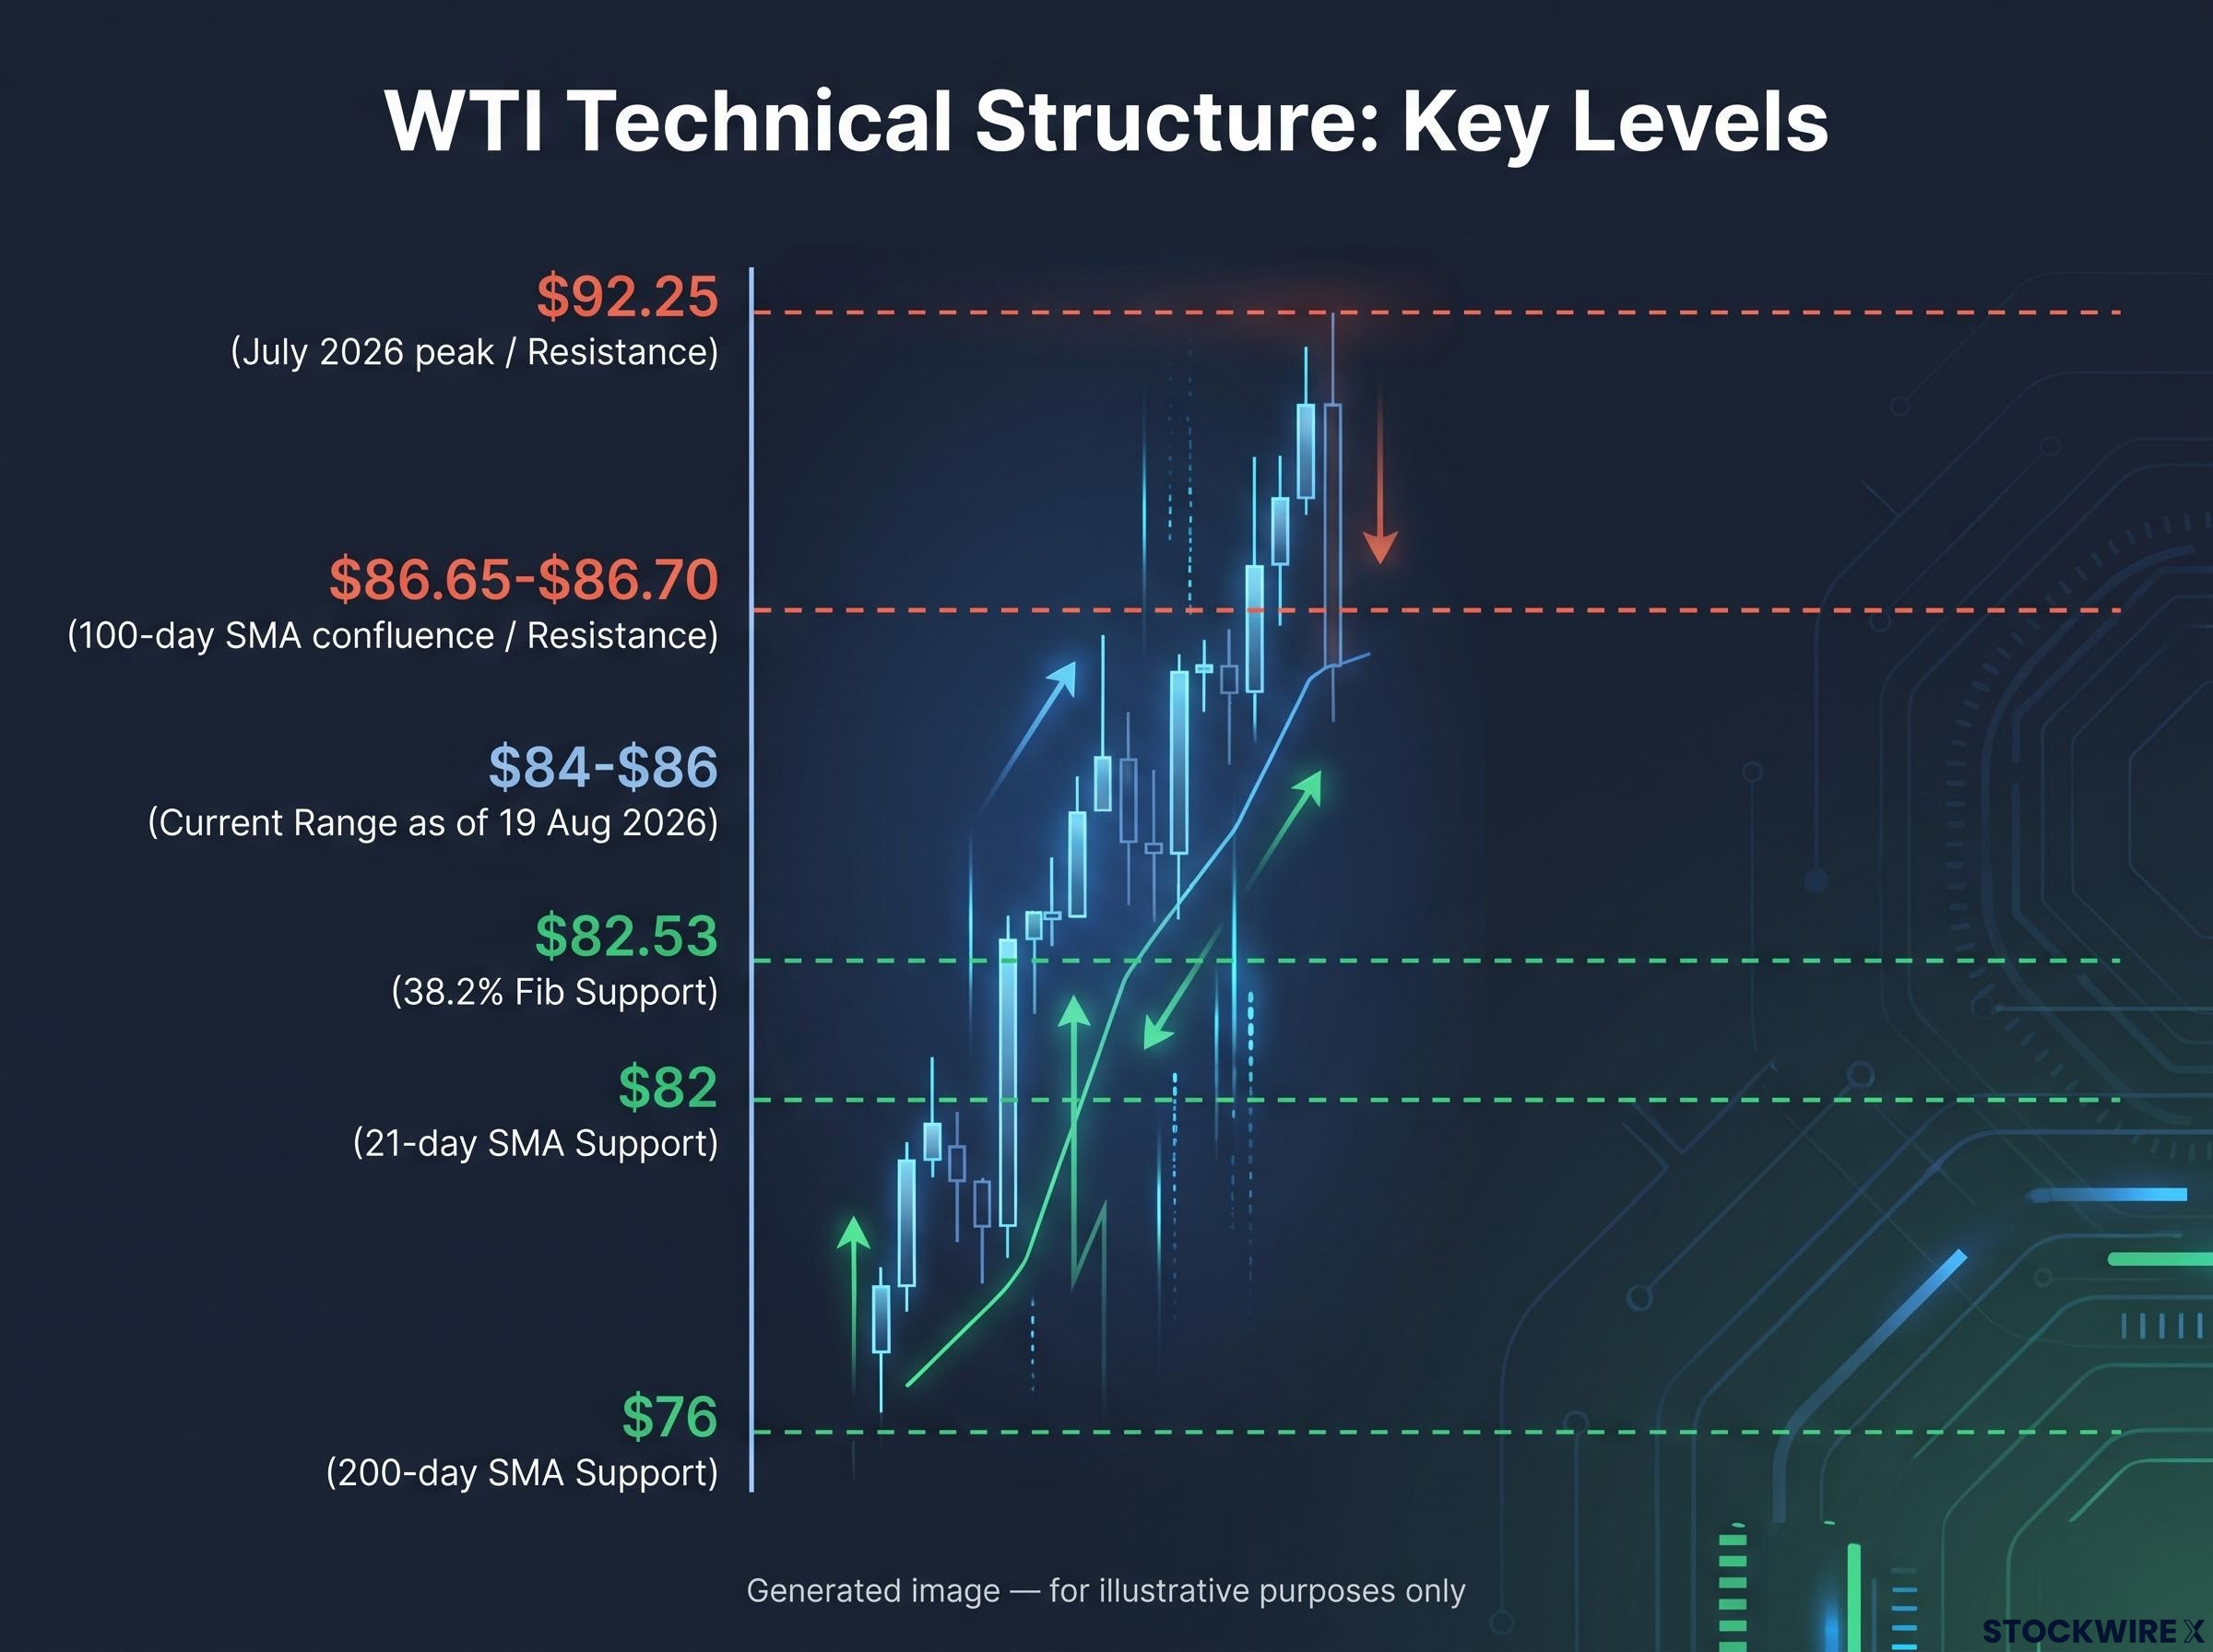
| Level | Price (Approx.) | Type | Significance |
|---|---|---|---|
| 200-day SMA | $76 | Support | Long-term structural floor; deeper correction target |
| 38.2% Fibonacci retracement | $82.53 | Support | Initial defence floor from the July-August downswing |
| 21-day SMA | $82 | Support | Short-term trend support; first level buyers defend |
| 100-day SMA / trend line confluence | $86.65-$86.70 | Resistance | Primary near-term ceiling; the key breakout level |
| July 2026 peak | $92.25 | Resistance | Key upside target if $86.65-$86.70 resistance clears |
Where buyers step in: the support map
If WTI pulls back from the current $84-$85 consolidation range, your first reference point is $82.53, the 38.2% Fibonacci retracement of the recent July-to-August downswing (a Fibonacci retracement measures how far a price has pulled back from a prior move, with 38.2% being the shallowest commonly watched level). This roughly aligns with the 21-day SMA, making it a zone where short-term buyers would be expected to defend.
Below that, the 200-day SMA near $76 is where longer-term structural buyers would likely engage. The mid-$73s exist as a scenario-level reference point in a severe breakdown, though nothing in the current technical picture projects that outcome as the base case.
Momentum indicators: what RSI and MACD add to the picture
Moving averages tell you where price sits relative to the trend. Momentum indicators tell you how much energy is behind that trend, and whether it is building or fading. Two are worth tracking weekly.
RSI (Relative Strength Index) measures momentum on a scale from 0 to 100:
- Above 70: overbought, meaning the rally may be stretched and vulnerable to a pullback
- 30-70: neutral to trend-confirming territory; the trend can continue without exhaustion
- Below 30: oversold, meaning the selloff may be stretched and due for a bounce
MACD (Moving Average Convergence Divergence) compares a short-term and a long-term exponential moving average. When MACD is above zero, the short-term trend is stronger than the long-term trend, which is typically bullish. A “bullish crossover,” where the MACD line crosses above its signal line, generates a buy signal.
WTI’s current RSI sits at approximately 56-58, and MACD is above zero and edging higher. Both indicators are aligned and sending the same message: the trend has genuine upward energy behind it, with no sign yet of overextension.
That joint reading matters. An RSI in the mid-to-upper 50s with MACD rising tells you the trend has room to continue before hitting an exhaustion signal. That is meaningfully different from a market where RSI is already above 70 and MACD is flattening, which would warn you that the rally is living on borrowed time.
When RSI and MACD agree, the signal carries more weight. When they diverge (for example, price making new highs while RSI makes lower highs), that divergence itself becomes information worth investigating. For now, both are confirming the same story: buyers are in control, and the trend is not overextended.
Putting it together: three scenarios the current WTI setup could resolve into
Reading fundamentals and technicals in isolation gives you partial answers. Reading them together gives you a decision map. Rather than making a single-point price prediction, define the scenarios the market could resolve into and know what signals would confirm or invalidate each one.
| Scenario | Key Trigger | Price Target / Range | RSI Signal | MACD Signal |
|---|---|---|---|---|
| Bullish continuation | Decisive break and hold above $86.65-$86.70 | $87.23, then $91.93, then $92.25 | Pushing higher but remaining below 70 | Continuing to rise above zero |
| Sideways consolidation | WTI range-bound; no new catalyst | $82.50-$86.70 range | Drifting in the 50s | Flattening near current levels |
| Bearish reversal | Repeated failure at $86.65-$86.70, then break below $82.50 | $76-$77; potentially mid-$73s | Slipping toward 40 | Approaching zero or turning negative |
The bullish case requires WTI to clear that $86.65-$86.70 confluence zone with conviction. If it does, the 100-day SMA flips from resistance to support, and the next meaningful targets are the Fibonacci levels at $87.23 and $91.93, with the $92.25 July peak as the full-run destination. RSI should push higher without crossing 70, and MACD should continue its upward trajectory.
The consolidation case is the market treading water: price chopping between $82.50 and $86.70, inventories staying elevated without a fresh shock, RSI drifting sideways in the 50s, MACD flattening. This is the market building a base before resolving in either direction.
The bearish case requires repeated rejection at $86.65-$86.70 followed by a break below $82.50. In that scenario, RSI slips toward 40, MACD moves back toward zero, and a test of the 200-day SMA near $76-$77 becomes increasingly probable.
The objective is not to predict which scenario plays out. The objective is to recognise which scenario the market is currently tracking and to know what specific data point or price level would tell you it is shifting from one to another. That is the more durable analytical posture: you are not trying to be right about the future; you are preparing to recognise it quickly when it arrives.
A repeatable Wednesday routine for reading oil markets every week
The EIA report is released on Wednesdays, which makes that day the natural anchor for your weekly oil market process. Here is the routine, split into two phases.
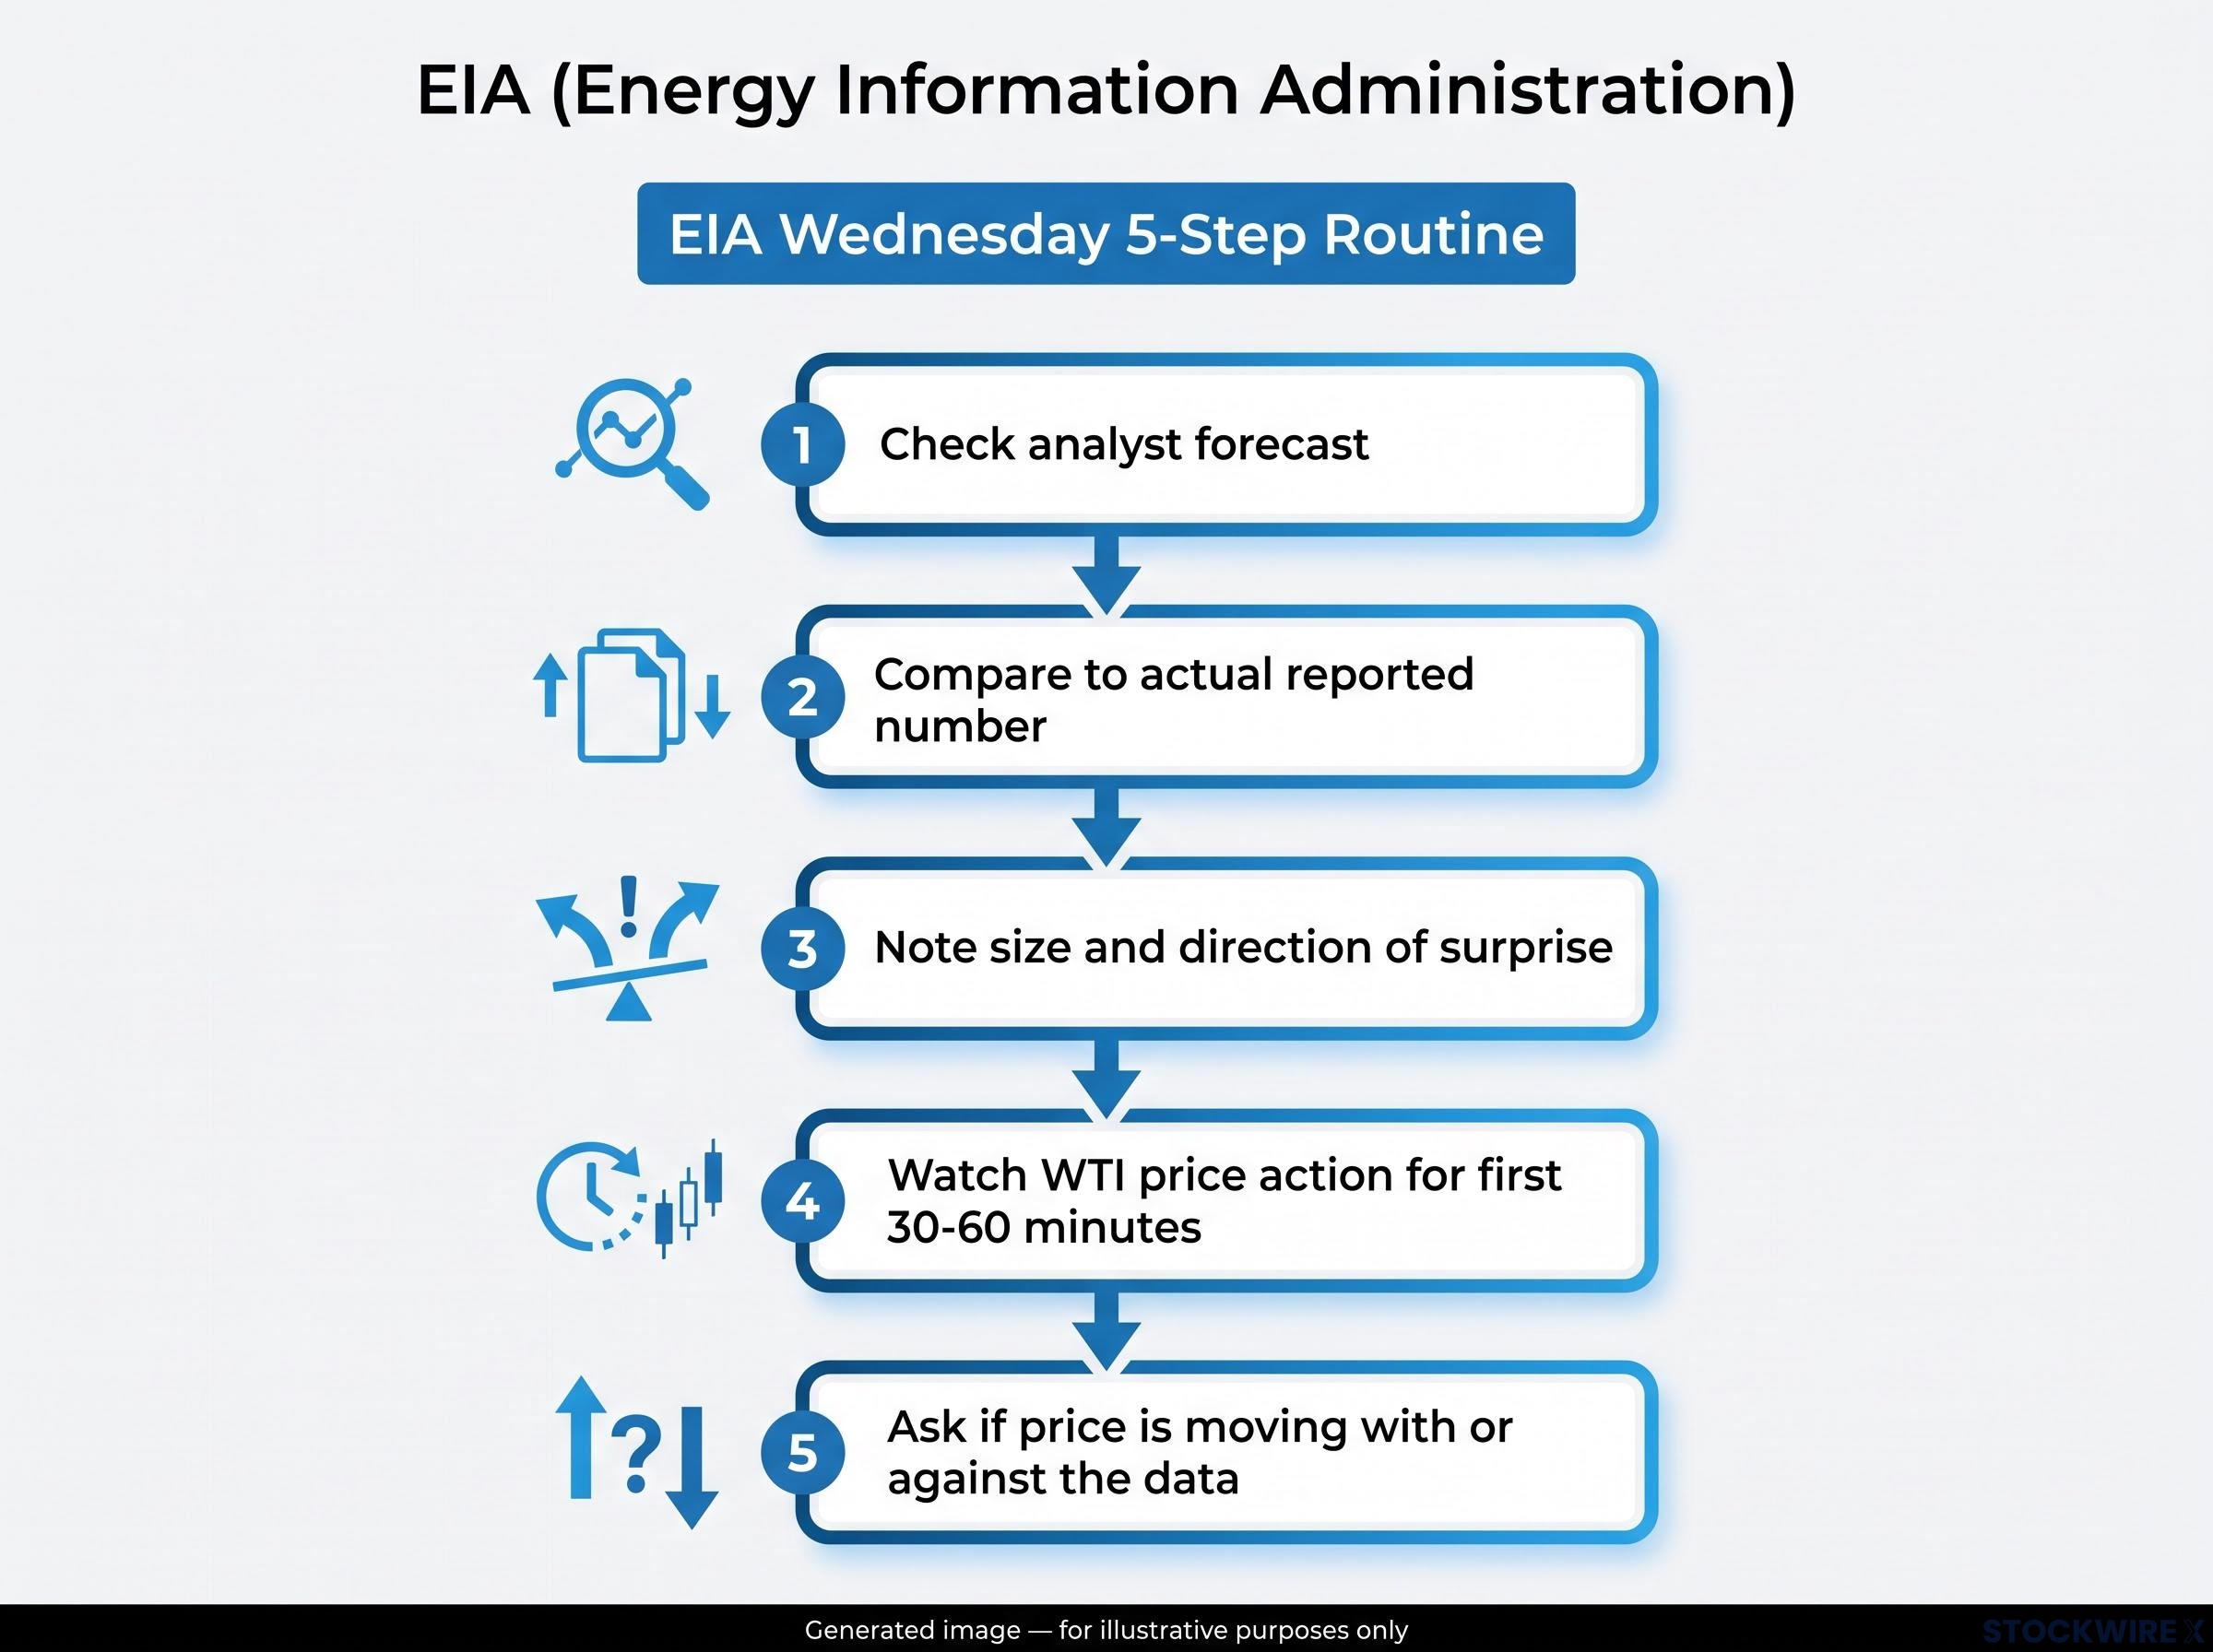
Before the EIA release
- Mark your key support levels on the chart ($82.53 and $76 in the current setup) and your key resistance levels ($86.65-$86.70)
- Note where the 21-day, 100-day, and 200-day SMAs are sitting relative to current price; are they converging, diverging, or holding steady?
- Record the current RSI reading (is it trending, overbought, oversold, or neutral?) and whether MACD is above or below zero and moving in which direction
After the EIA release
- Compare the analyst forecast to the actual inventory figure and calculate the size and direction of the surprise
- Watch WTI price action for the first 30-60 minutes after the release; the initial reaction often tells you more than the number itself
- Ask the core question: is price moving with the data or against it, and what does that tell you about which of your three scenarios is gaining or losing probability?
The third step is where the integration happens. If inventories build and price falls, the fundamentals are leading. If inventories build and price holds or rises, the technicals and positioning are overriding the headline signal, exactly the pattern you saw in the week of 14 August.
Doing this process once gives you a snapshot. Doing it every week builds something more valuable: pattern recognition. You start noticing when the market consistently absorbs bearish data, or when it starts failing at the same resistance level for the third week running. That cumulative context is what converts weekly data from a series of individual surprises into updates to a living analytical map.
Building a framework that outlasts any single trade
The specific numbers in this guide, $86.65-$86.70 resistance, RSI at 56-58, 17.4 million barrels, will all be outdated within weeks. The framework will not.
What you now hold is a method for reading fundamentals and technicals as complementary layers rather than competing explanations. Inventory data tells you what the supply-demand balance is doing. Moving averages tell you where the market’s structural boundaries sit. RSI and MACD tell you how much energy the current trend has left. And the scenario map tells you what to watch for, so you are never caught improvising under pressure.
The current WTI setup is a live case study in market ambiguity: bearish inventory data, bullish technical structure, and an unresolved resistance zone at $86.65-$86.70 that will eventually break one way or the other. The framework does not force you to pick a side prematurely. It teaches you to sit with that ambiguity, watch the signals, and act when the evidence tilts.
Your next opportunity to run the full process is the next Wednesday EIA release. Mark the levels, check the momentum, compare the forecast to the actual number, and watch what price does in the first hour. The analytical value compounds each week you do it.
For investors wanting to understand the macro backdrop that pushed WTI and Brent into the triple digits earlier in 2026, our deep-dive into how the Iran conflict reshaped crude price levels explains the Strait of Hormuz mechanics, Federal Reserve constraints, and supply chain normalisation timelines that define the structural ceiling now sitting above the current $84-$86 range.
This article is for informational purposes only and should not be considered financial advice. Investors should conduct their own research and consult with financial professionals before making investment decisions. Past performance does not guarantee future results.