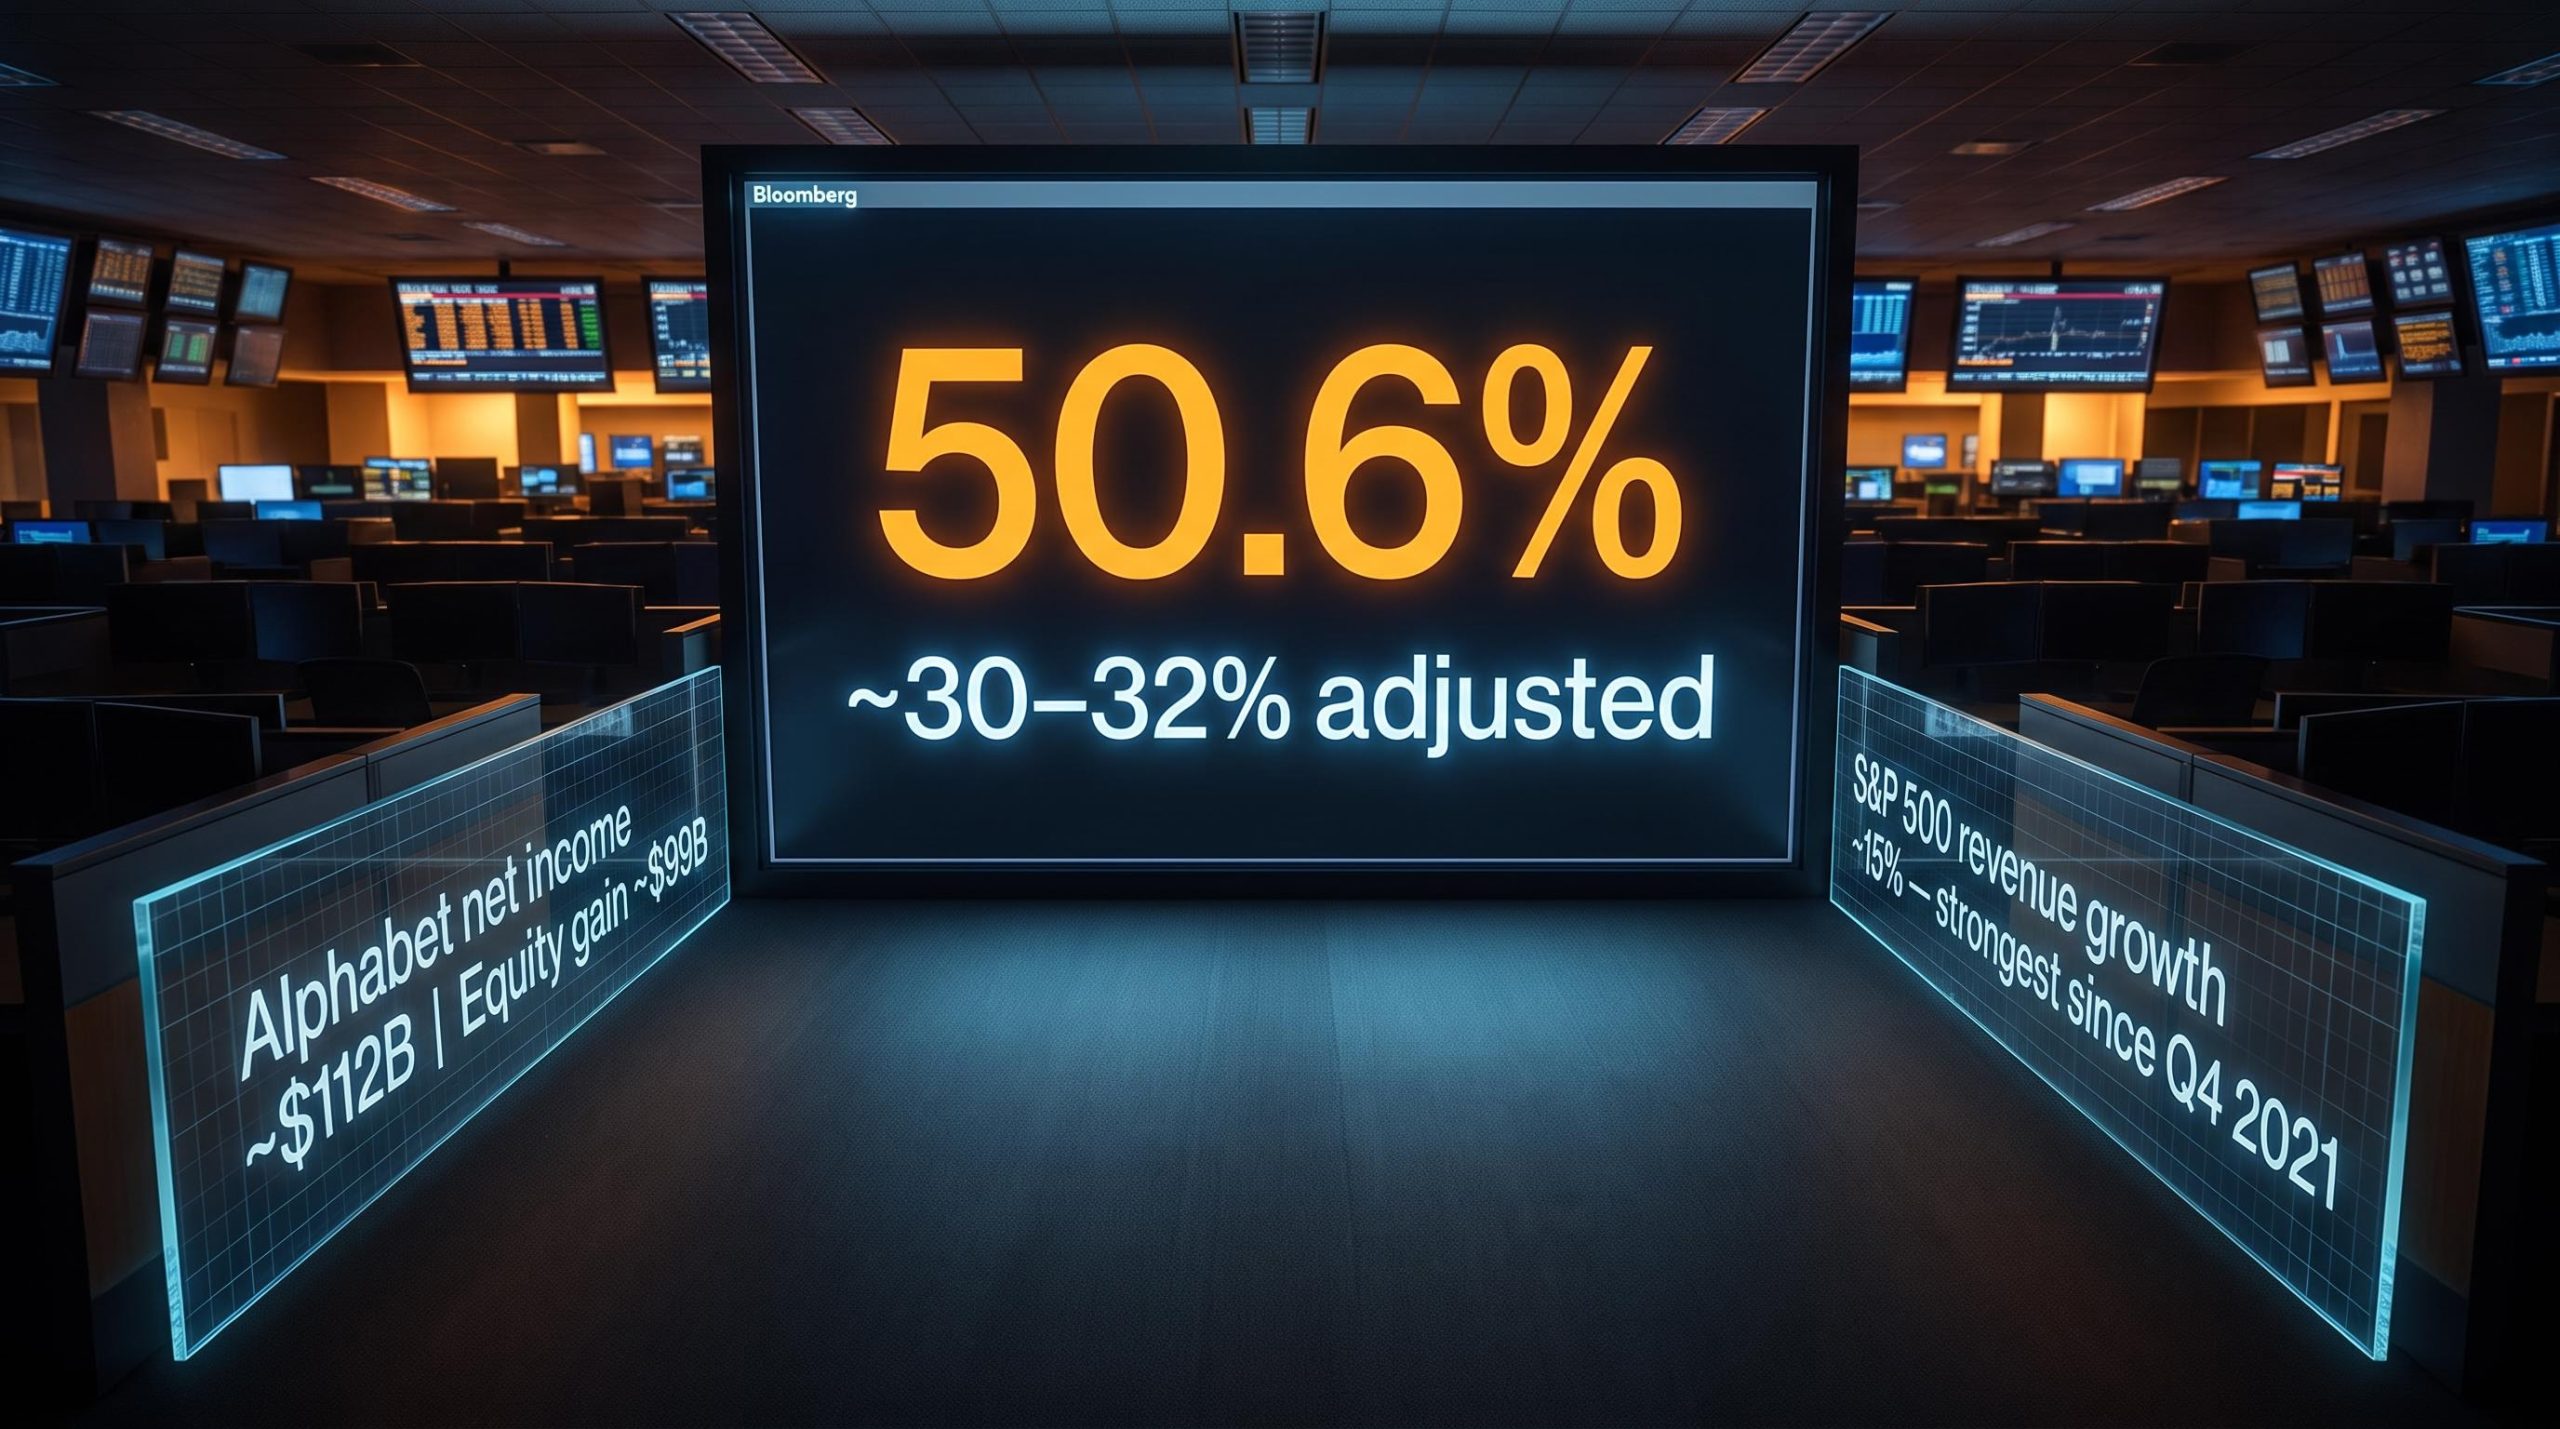
S&P 500 earnings grew 50.6% in Q2 2026. That figure, reported with more than 90% of companies having disclosed results, sounds like a misprint. Your instinct to question it is correct, but the real story is not that the number is wrong. It is that the number is incomplete.
This is the seventh consecutive quarter of double-digit earnings growth. Analyst beat rates sit at multi-year highs. The figure will feed directly into how portfolio managers set valuation multiples and forward expectations for the rest of 2026. It is not academic; it is the number that reprices risk assets.
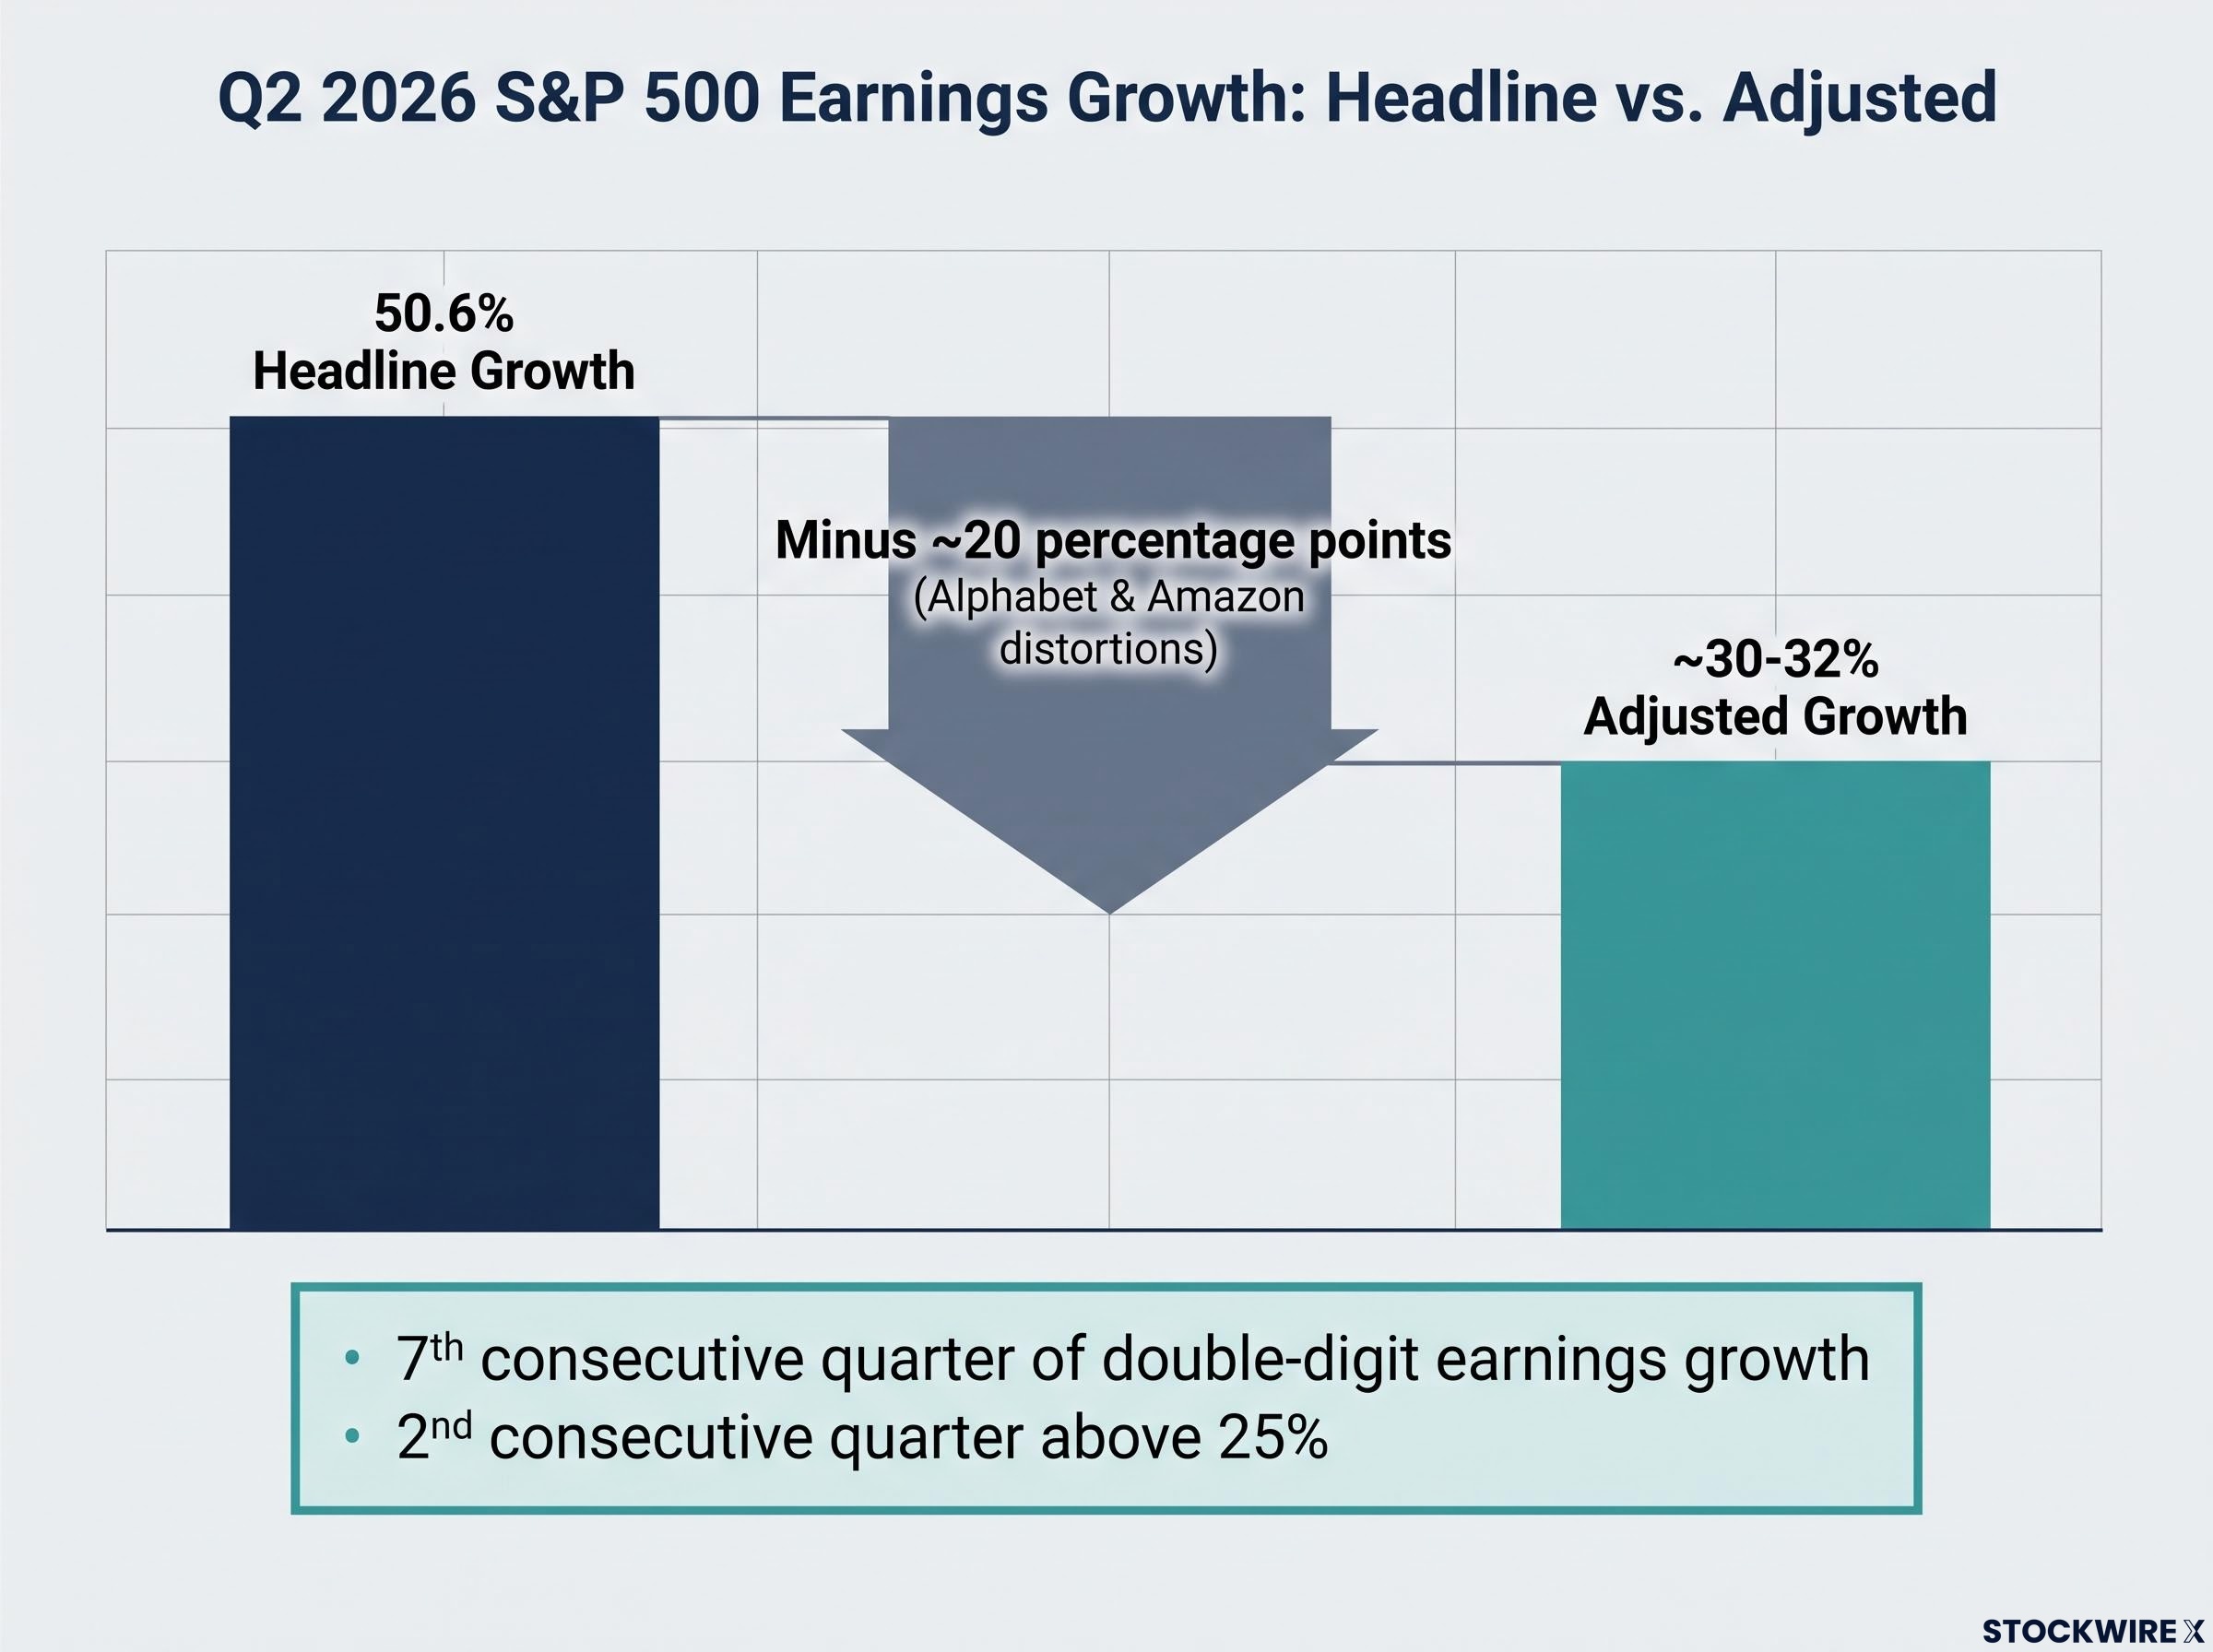
Here is what the data tells you once you separate the signal from the noise: two companies inflated the headline by roughly 20 percentage points, tariff refunds added real but immaterial cash, and the adjusted growth rate, confirmed by the strongest revenue expansion since late 2021, still represents one of the most powerful earnings environments in the post-financial-crisis era. The figure you should anchor decisions to is not the one on the front page.
What 50.6% growth actually means in seven consecutive quarters of gains
The streak came first. Before the headline figure even appeared, the S&P 500 had already strung together six straight quarters of double-digit earnings expansion, a run that included Q1 2026’s 29.0% year-over-year growth. Q2 2026 accelerated from that base.
The asymmetry in that valuation setup matters: forward P/E valuation pressure was already elevated before Q2 results arrived, with the market priced above its five-year and ten-year averages, meaning beats earned limited upside while misses carried disproportionate downside risk.
As of 17 August 2026, FactSet data showed blended earnings growth of approximately 50.6% year-over-year, consistent with John Butters’s 7 August FactSet Earnings Insight figure of 50.4%. The difference is rounding and reporting timing, not substance.
The FactSet Earnings Insight, authored by John Butters and published on 7 August 2026, recorded a blended earnings growth rate of 50.4% alongside an 86% EPS beat rate, and explicitly quantified the distortion created by Alphabet and Amazon within the index-level figure.
The breadth is what makes this quarter stand out:
- Seventh consecutive quarter of double-digit earnings growth
- Second consecutive quarter above 25%
- 85% of reporting companies exceeded analyst estimates, a result that surpasses both the 5-year average of 78% and the 10-year average of 76%
- Nine out of 10 sectors that grew earnings did so positively, with Health Care the only sector to record a contraction
The obvious historical comparison is Q2 2021, which recorded S&P 500 earnings growth of 91.6% year-over-year. That result was driven overwhelmingly by a low starting point, as profits in 2020 had been crushed by pandemic disruptions and business closures. Q2 2026’s 50.6% is occurring against normal prior-year earnings, which makes it the more operationally meaningful result.
That distinction matters. Growth driven by a low base tells you what happened last year. Growth against a normal base tells you what is happening now.
When big ASX news breaks, our subscribers know first
How two companies inflated the headline by roughly 20 percentage points
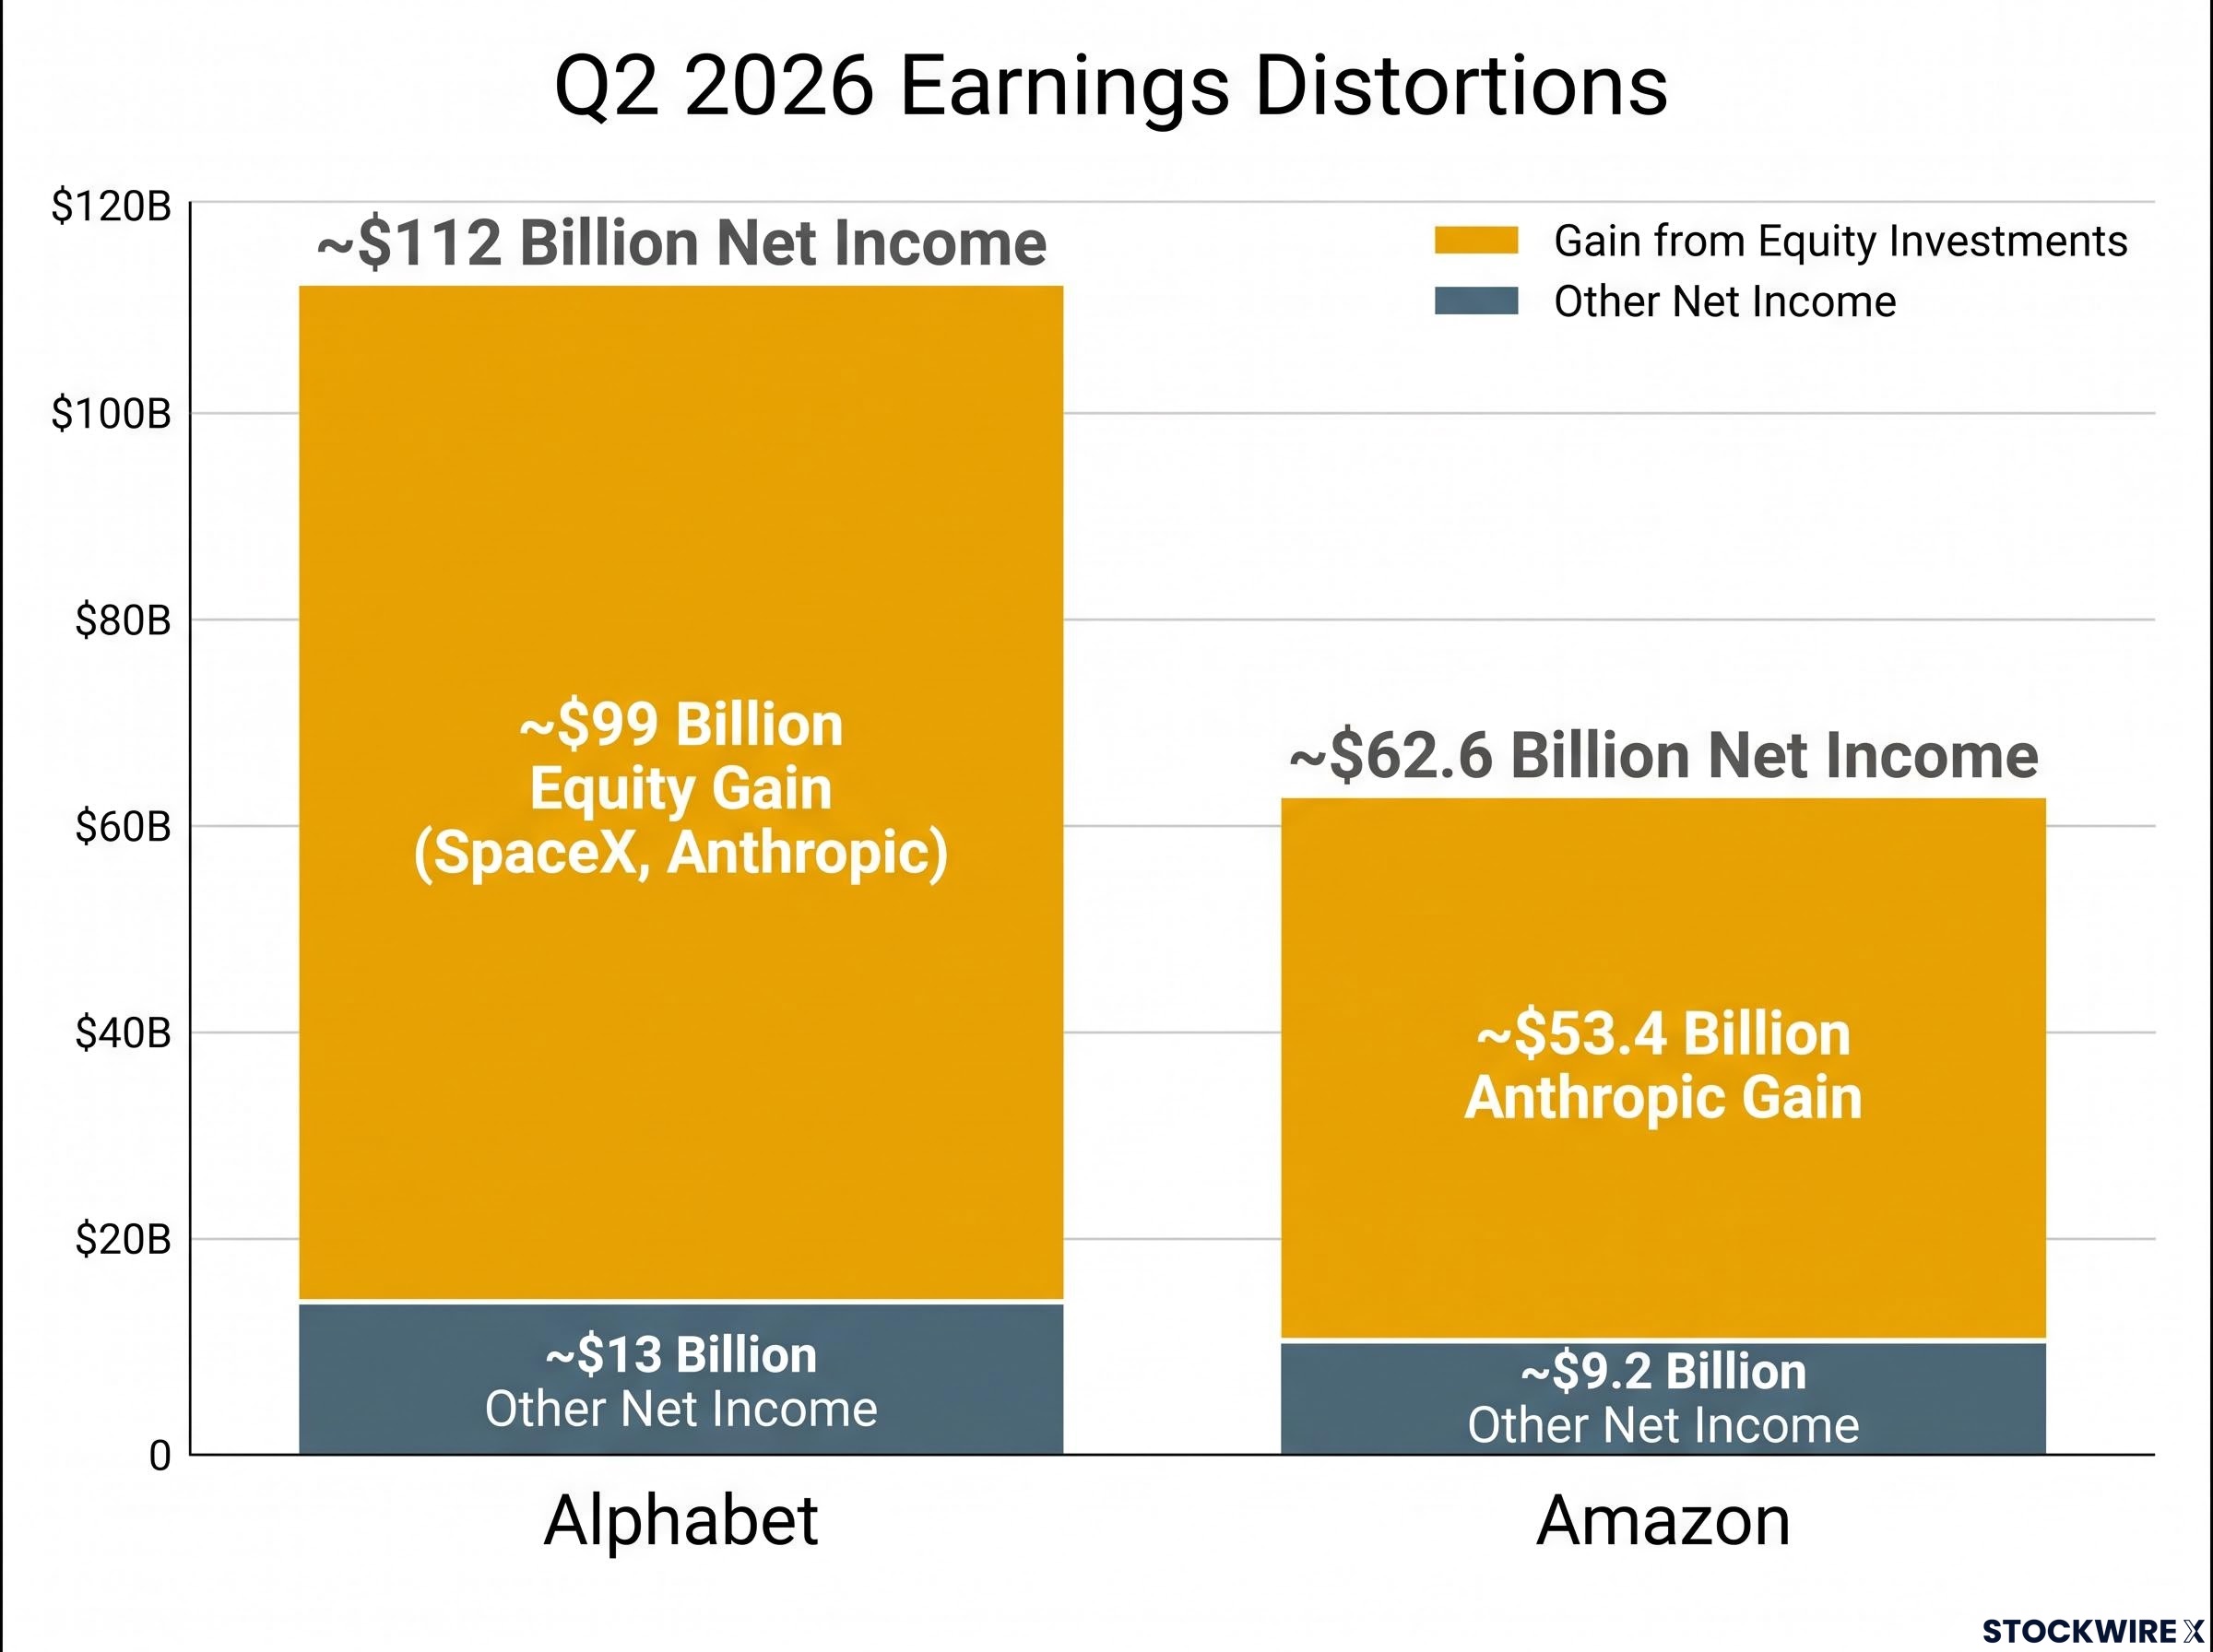
Alphabet’s Q2 2026 results carry the largest single distortion. The company booked approximately $99 billion in gains on equity securities in other income, primarily from stakes in SpaceX and Anthropic. Net income jumped to roughly $112 billion, up nearly 300% year-over-year, with the equity gains contributing approximately $6.26 of Alphabet’s $9.11 in diluted earnings per share. More than two-thirds of reported EPS came from mark-to-market gains rather than core operations.
Amazon showed a parallel, though smaller-scale, dynamic. According to available reporting, net income surged to approximately $62.6 billion, driven by a non-operating pre-tax gain of approximately $53.4 billion tied to its Anthropic investment. That gain dwarfed operating income of roughly $27.5 billion. (Amazon-specific figures are sourced from Perplexity and have not been independently verified; they should be treated as directionally indicative.)
| Company | Headline Net Income | Non-Operating Gain Source | Gain Amount |
|---|---|---|---|
| Alphabet | ~$112 billion | Equity securities (SpaceX, Anthropic) | ~$99 billion |
| Amazon | ~$62.6 billion* | Anthropic investment revaluation | ~$53.4 billion* |
*Amazon figures are unverified and sourced from Perplexity. Treat as directionally indicative.
Both companies’ core operations also grew solidly. Advertising, cloud, and AWS all posted double-digit revenue gains. The investment marks supplemented an already strong operational quarter; they did not mask weakness. The accounting mechanism, however, is the critical detail: mark-to-market rules require recognition of unrealised gains in the income statement even if no shares are sold. The same line items that added tens of billions this quarter can subtract billions in future quarters if private-company valuations reverse.
What the index looks like without the two biggest distortions
FactSet explicitly calculated the impact. In a late-July update, excluding Alphabet and Amazon would have reduced Q2 2026 blended growth from 47.4% to 28.8%. As the reporting season completed and the overall rate rose to approximately 50.4%, an ex-Alphabet/Amazon growth rate in the low 30s is a directionally consistent estimate for the full quarter.
That adjusted figure, approximately 30-32%, is the analyst-grade number. It marks the seventh quarter running of double-digit earnings expansion and the second in a row to clear the 25% threshold. This is not a consolation figure; it represents one of the strongest non-base-effect earnings environments in the post-financial-crisis era, and it is the number that belongs in a valuation model.
Tariff refunds: real money, wrong conclusion
The Wall Street Journal’s Theo Francis and Celia Bernhardt reported that, by 12 August 2026, 40 S&P 500 companies that had disclosed results collectively received approximately $9.6 billion in tariff refunds. The beneficiaries were real and the cash was tangible:
- Apple: approximately $2.2 billion (against total net income exceeding $110 billion, per WSJ)
- Nike: approximately $986 million (unverified, sourced from Perplexity)
- FedEx: approximately $800 million (unverified, sourced from Perplexity)
- Amazon: approximately $640 million (unverified, sourced from Perplexity)
- General Motors: approximately $500 million (unverified, sourced from Perplexity)
The Apple example is the clearest illustration of proportionality. A $2.2 billion refund against more than $110 billion in net income matters to Apple’s individual quarter but is arithmetically irrelevant to the index-level debate about whether 50%+ growth is real.
Across 40 companies, $9.6 billion in tariff refunds sits against aggregate S&P 500 quarterly earnings that run into the trillions on an annualised basis. At the index level, this is rounding error, not a structural profit driver.
Tariff refunds are genuine, taxable cash gains. They are also clearly non-recurring and not a repeatable profit engine. For stock-specific analysis, they matter. For the index-level earnings quality verdict, they do not change the conclusion.
Tariff policy uncertainty was already migrating from an executive shock model to a slower legislative one before Q2 results arrived, a transition that makes the $9.6 billion in one-quarter refunds to 40 S&P 500 companies less a structural profit driver and more a function of a specific, non-repeatable legal and policy window.
Why revenue data is the cleanest quality check available
Revenue bypasses the accounting debates entirely. It does not include mark-to-market investment gains, typically excludes one-time government transfers like tariff refunds, and is harder to engineer through accounting treatments. When you want to verify whether an earnings figure reflects actual demand or financial engineering, revenue is the simpler, less-manipulable metric.
The Q2 2026 answer is unambiguous. S&P 500 revenue grew approximately 15% year-over-year, the strongest rate since Q4 2021, based on 458 reporting companies as of 17 August 2026, per FactSet.
| Sector | Approximate Revenue Growth (YoY) | Note |
|---|---|---|
| Energy | ~42% | Strongest sector |
| Information Technology | ~36% | AI and cloud spending |
| Utilities | ~5% | Slowest sector |
| Overall S&P 500 | ~15% | Strongest since Q4 2021 |
Every one of the 11 S&P 500 sectors recorded positive revenue growth in Q2 2026. Broad revenue gains across all sectors, combined with high earnings beat rates, indicate that profit growth is being pulled along by genuine customer demand rather than constructed through accounting choices.
That 15% revenue growth rate, confirmed across every sector, is the single most important data point for a reader who wants to know whether the underlying economy is generating the demand that justifies current equity pricing. The answer is clearly affirmative. Revenue breadth prevents over-correcting after the Alphabet and Amazon adjustments: the adjusted earnings story and the revenue story point in the same direction.
Earnings growth broadening beyond the Magnificent Seven is corroborated by Russell 3000 data showing the median stock delivering 15% profit growth in Q2 2026, the strongest pace since 2021, a finding that reinforces why the revenue breadth across all 11 S&P 500 sectors is the more durable signal than any single headline figure.
Building an adjusted earnings framework for valuation decisions
The diagnosis is complete. Here is how to turn it into a durable decision-making tool, structured as three sequential analytical layers:
- Strip non-recurring items. Remove Alphabet’s and Amazon’s mark-to-market equity gains (SpaceX, Anthropic) and set aside the $9.6 billion in tariff refunds as episodic cash, not repeatable earnings. This brings the headline 50.6% down to an adjusted rate of approximately 30-32%.
- Anchor valuation models to the adjusted rate. The approximately 30-32% figure, not the 50.6% headline, is the number that belongs in forward earnings models. Compare it to the right historical benchmark: Q2 2021’s 91.6% growth was almost purely a base-effect phenomenon against pandemic troughs, while Q2 2026’s adjusted rate is occurring against normal prior-year earnings, which gives it more lasting valuation support.
Fiscal policy risks to equity pricing extend beyond the earnings statement: an unfunded capital gains cut against a $1.8 trillion deficit trajectory points to higher Treasury yields and a tighter Fed stance that could compress the very valuation multiples that strong Q2 earnings support.
- Use revenue breadth as ongoing quality verification. The 15% revenue growth across all 11 sectors corroborates the durability of underlying demand. Revenue is the check that keeps your earnings assumptions honest across future quarters.
As investment gains and tariff refunds roll off in Q3 and Q4 2026, reported earnings growth will decelerate from the headline 50.6%. Readers who understand this in advance will recognise normalisation for what it is. Deceleration is not the same as deterioration.
A reader who anchors forward expectations to the approximately 30-32% adjusted rate is positioned to interpret coming quarters correctly, avoiding both the panic of misreading normalisation as a downturn and the complacency of treating the headline as a permanent run rate.
This article is for informational purposes only and should not be considered financial advice. Investors should conduct their own research and consult with financial professionals before making investment decisions. Past performance does not guarantee future results. Financial projections are subject to market conditions and various risk factors.
The number that belongs in your model, not on the front page
Three findings define Q2 2026:
- The 50.6% headline is real but distorted by approximately 20 percentage points of non-recurring investment gains at two companies
- The adjusted growth rate of approximately 30-32% is the operationally relevant figure, and it represents one of the strongest earnings environments since the financial crisis
- Revenue growth of approximately 15% across all 11 sectors confirms the underlying demand story is genuine and broad-based
The streak, seven consecutive quarters of double-digit growth, two of them above 25% on an adjusted basis, is the durable signal. The headline number is the distraction.
With investment gains and tariff refunds non-recurring, Q3 and Q4 2026 reported growth will almost certainly be lower. That is arithmetic, not deterioration. The reader who can explain in two sentences why 50.6% is the number on the front page and approximately 30-32% is the number in the model has the calibrated view that separates informed positioning from headline-chasing.