Telstra switched on its longest Aura fibre route today, a cable that runs from Perth to Sydney. A launch like this looks like a revenue event, but it is not one yet. Telstra does not publish Aura-only revenue, and its shares fell about 4% to $4.80 after the FY26 results in August, as the market worried about how much capital the network build is consuming.
That leaves a gap between a very large construction project and a payoff nobody can measure. This matters for anyone forming a view on the Telstra growth outlook.
The route sits inside a $1.8 billion digital infrastructure programme. Separately, an Oxford Economics report commissioned by Telstra projects Western Australia’s digital economy rising nearly fivefold to about $89.1 billion by FY40. Read the signal correctly and you understand where Telstra’s next growth leg could come from. Read it too generously and you pay for earnings that may take years to arrive.
This analysis separates what is documented from what is inferred, so you can decide how much weight the launch deserves in your view of Telstra.
What the Perth-Sydney route actually adds to Telstra’s network
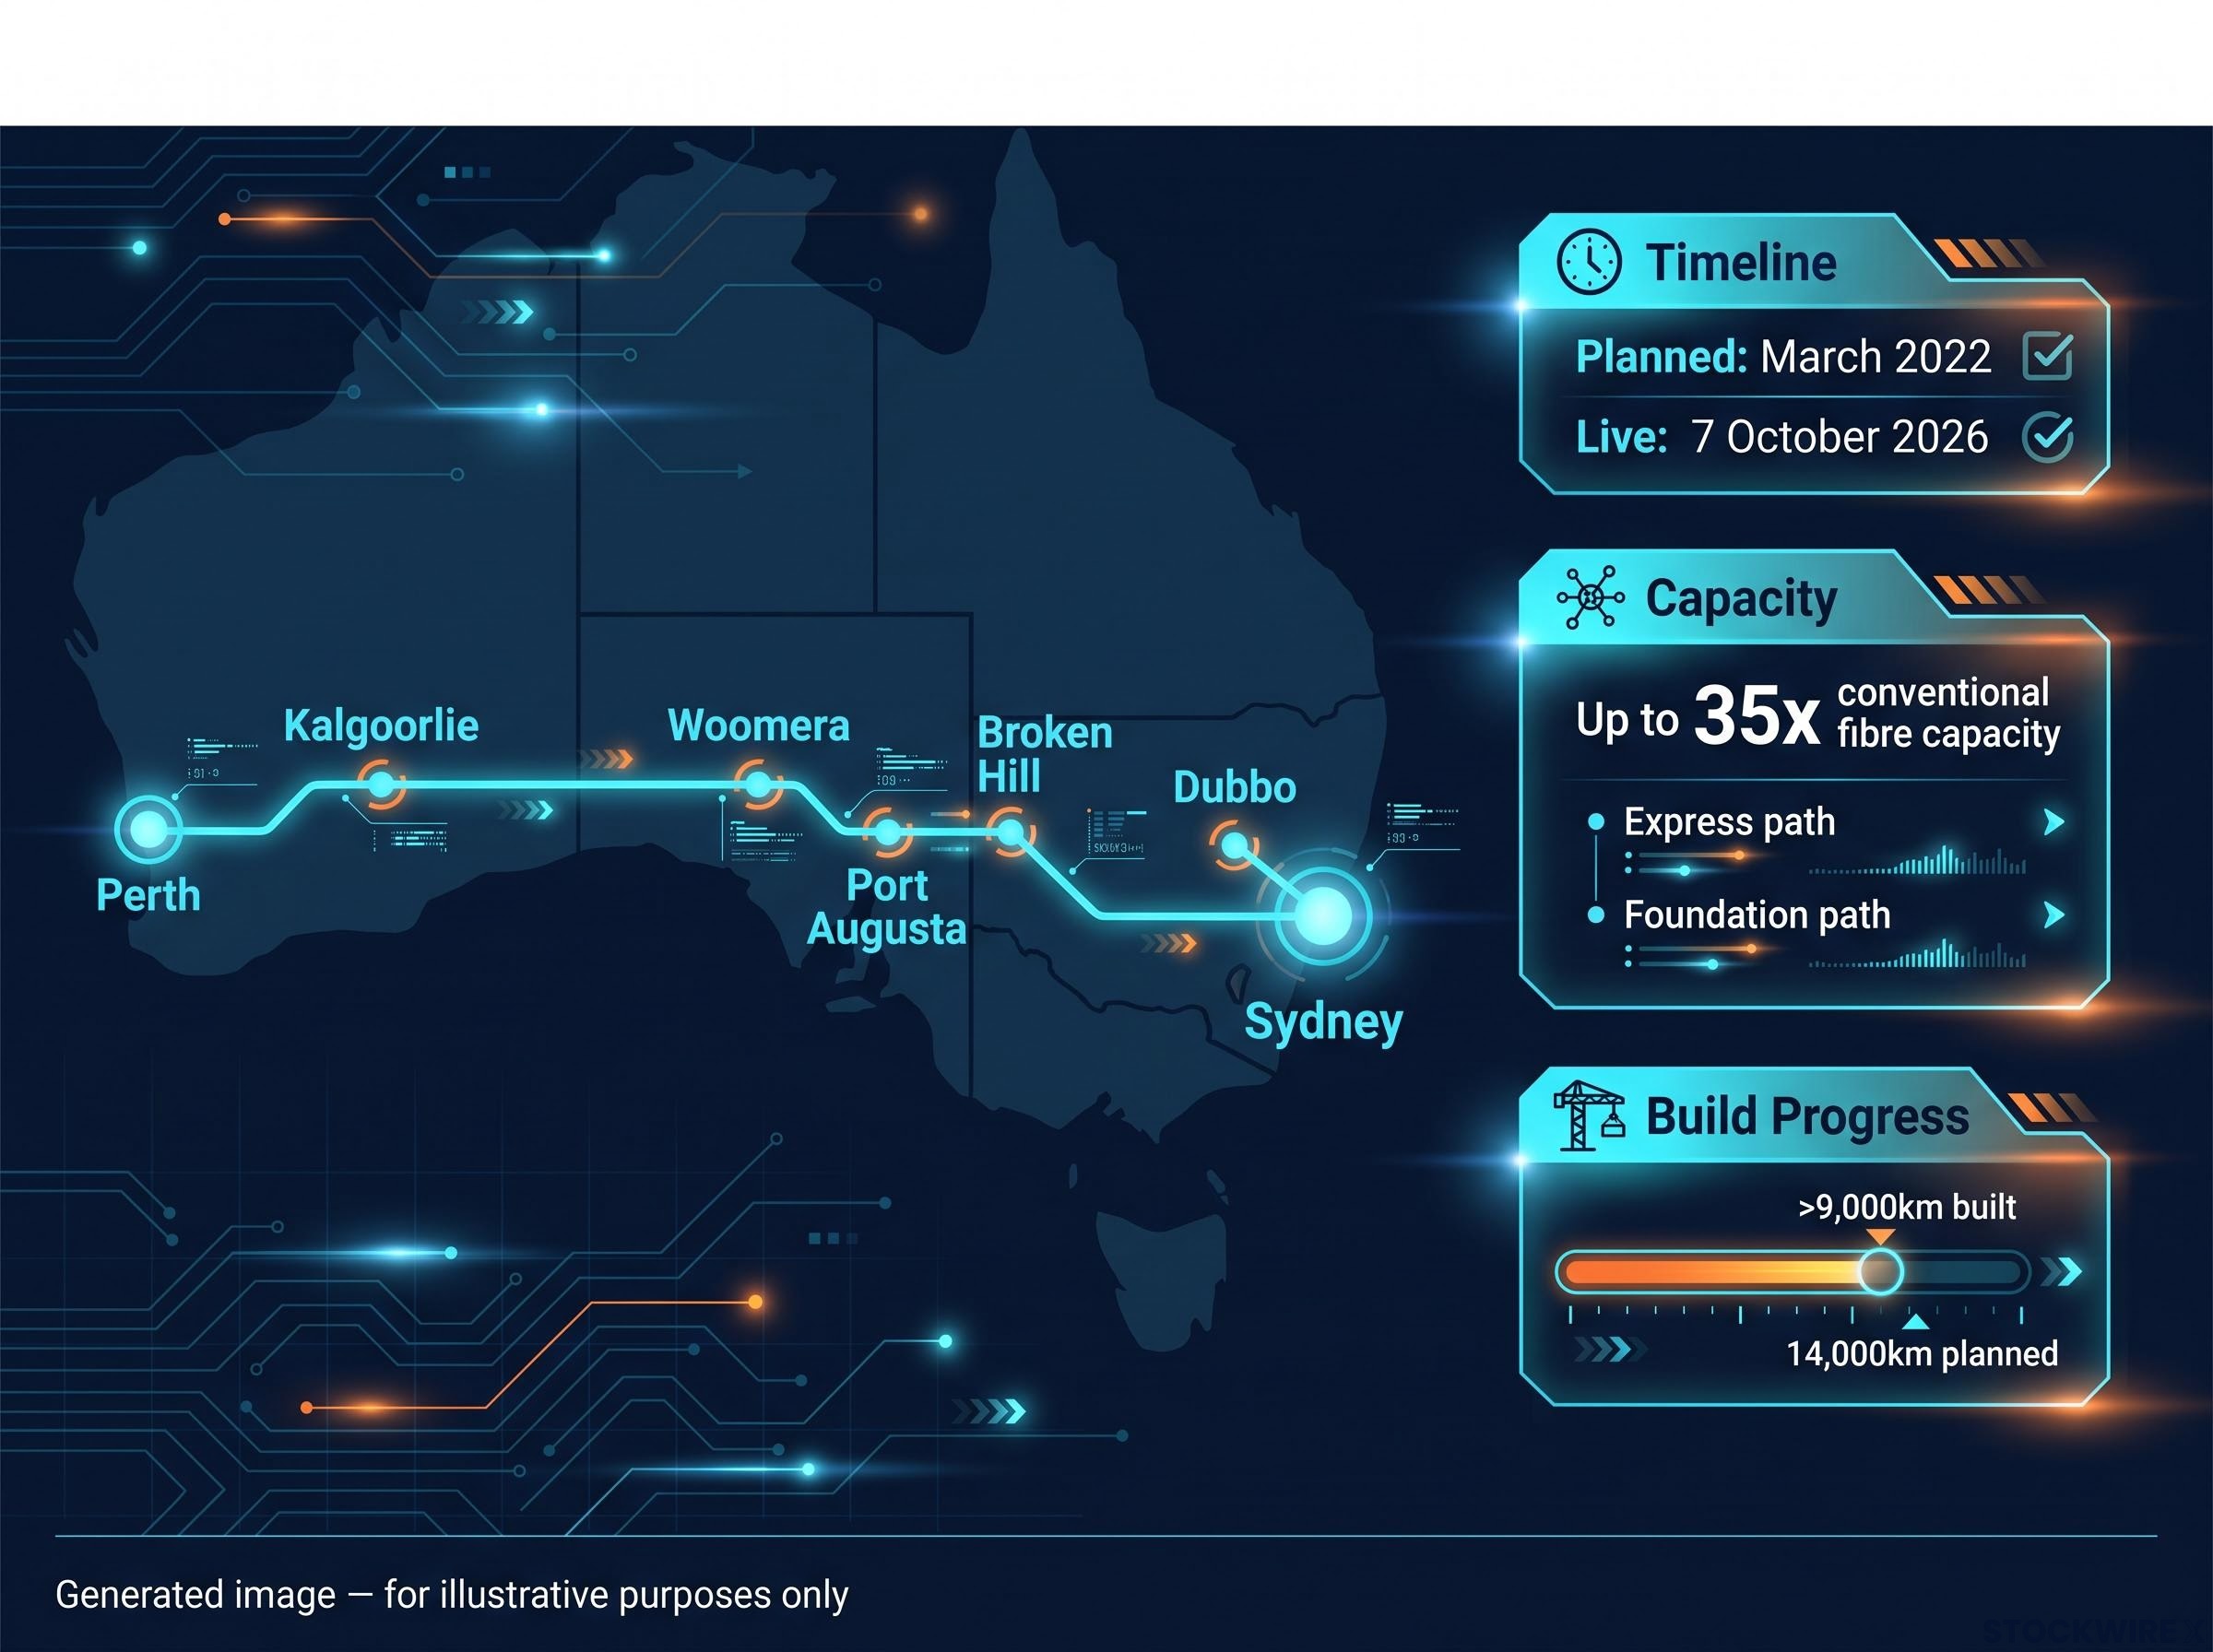
The route went live on 7 October 2026, about four and a half years after planning began in March 2022. It is the longest Aura route Telstra has built so far.
Route and design
The cable runs east from Perth and passes through these regional centres before it reaches Sydney:
- Kalgoorlie, Woomera, Port Augusta, Broken Hill, Dubbo and Orange
- An express path that carries long-haul traffic between capital cities and subsea cable landing stations
- A foundation path with on and off ramps that serve regional locations along the way
At the Perth end, the route connects to the subsea cables that land there. That gives organisations more route diversity, meaning more than one physical path for moving data within Australia and overseas. This is a capacity and resilience product for wholesale and enterprise buyers. Households will not be ordering it.
Capacity claim Each path can carry up to 35 times the capacity of conventional fibre routes, according to Telstra.
Telstra has now built more than 9,000km of a planned 14,000km network. This launch is a milestone, and the build is still well short of finished. The company has not disclosed the exact length of the Perth-Sydney route.
Who is buying capacity
Telstra says Microsoft and Google have both secured capacity on Aura. It also points to demand from mining, defence and financial services, but it has not named any other customers.
The two hyperscaler names tell you there were real buyers on launch day. They are cloud giants that operate data centres at enormous scale. Even so, no contract value or revenue figure was announced alongside them. The engineering is well documented, while the economics remain largely unknown, and that gap shapes how you should value the build.
Microsoft and Google securing capacity makes sense given hyperscaler AI capital expenditure running at roughly $725 billion for 2026, though debt-funded spending raises questions about how durable that demand will prove.
When big ASX news breaks, our subscribers know first
Educational: How an Aura-style fibre network earns money, and why Telstra’s revenue is hard to see
If you open Telstra’s financial reports looking for an Aura line, you will not find one. To work out what the network might earn, you need to understand what it sells.
Aura supports three types of product, and capacity can scale to tens of terabits per second (Tbps). A terabit is one trillion bits of data. Buyers can reserve their own slice of the network outright, expand their capacity over time as demand rises, or hand the whole operation over to Telstra as a managed service.
| Product | What the customer buys | Typical buyer | Revenue visibility |
|---|---|---|---|
| Dark fibre | Unlit fibre strands that the customer lights with its own equipment | Hyperscalers and large carriers (inference) | Not disclosed |
| Wavelength | A dedicated light channel on Telstra-lit fibre | Cloud providers and data centre operators (inference) | Not disclosed |
| Spectrum and managed capacity | A slice of fibre spectrum, or a service run end to end by Telstra | Miners, government and enterprises (inference) | Not disclosed |
The buyer column is an inference drawn from Telstra’s product descriptions. Telstra itself has not published how Aura revenue splits by product or by customer. In general, hyperscalers prefer dark fibre because it gives them control, while smaller buyers usually want Telstra to handle the equipment.
The revenue sits inside Connected Future 30 (CF30), Telstra’s five-year strategy to the end of FY30, which replaced the earlier T25 plan. Investor Day materials refer to a target for revenue enabled by Network-as-a-Platform (NaaP) by FY30. NaaP describes selling network capacity as a flexible, on-demand service. The figure behind that target does not appear in accessible materials.
Earlier intercity and subsea fibre builds tell you where the returns come from. They paid off according to utilisation and pricing power, and finishing construction did not settle the question. So when you assess Aura, watch for signs that capacity is filling up and that prices are holding. Kilometres laid will tell you far less.
Does WA’s projected digital boom support the case, and how far can you trust it?
The demand case Telstra is making rests heavily on one number.
What the forecast says
Western Australia’s digital economy: $16.8 billion in FY25 to about $89.1 billion by FY40, nearly fivefold growth Source: Oxford Economics, “Australia’s Western Gateway: WA’s Digital Opportunity”, commissioned by Telstra
The report names high-capacity connectivity as a key growth enabler for three sectors:
- Mining: iron ore and LNG operations running remote sites, autonomous vehicles and cloud analytics that need fast links back to Perth and to cloud regions
- Defence: naval and air facilities in WA that need resilient, secure fibre backhaul, the links that carry traffic from local sites back to the core network
- Professional and financial services: Perth trading desks that need low-latency links to the Sydney and Melbourne exchanges and to global markets through subsea cables
Each of these use cases makes it plausible that demand for east-west capacity will grow. Hyperscale cloud adds a fourth source of demand, and it already has named buyers.
What it cannot tell you
Telstra paid for this research. The $89.1 billion figure also comes from an accelerated digital adoption scenario, which is an optimistic case and not a central forecast.
Any 15-year projection depends on assumptions about technology adoption, commodity cycles, government policy and competition. A downturn in iron ore prices or a slower take-up of AI could pull the curve well below that figure.
A bigger market also does not guarantee Telstra a bigger share of it. Treat the forecast as evidence that demand is heading in the right direction, and discount the size of the headline number. It is not a revenue forecast for Telstra.
Large headline numbers in this sector deserve the same scepticism, since the A$60 billion Australian data centre figure is a scenario ceiling and not a consensus forecast, much like the accelerated adoption case behind Western Australia’s projection.
What the FY26 numbers and risks say about Telstra’s growth outlook
Whatever Aura eventually earns, it has to fit inside the business Telstra already runs, and that business reported a solid year.
Financial baseline
| Metric | FY26 result | Change | FY27 guidance |
|---|---|---|---|
| Underlying EBITDAaL | $8.3B | +4% | $8.5B-$8.8B |
| NPAT | $2.4B | +2.7% | Not provided |
| EPS | 19.9c | +5.3% | Not provided |
| Cash earnings | ~$2.9B | +11.6% | Not provided |
| Cash EBIT | Not provided | Not provided | $4.75B-$4.95B |
EBITDAaL stands for earnings before interest, tax, depreciation and amortisation, after leases. It measures operating earnings once lease costs are deducted. NPAT is net profit after tax, and EPS is earnings per share.
Telstra paid a final dividend of 10.5 cents, which brought the FY26 total to 21 cents per share. It also announced a new buyback of up to $1 billion after completing its previous $1.25 billion programme.
Those payouts show the core business generates enough cash to fund the build and still reward shareholders.
The FY26 results also showed Telstra revising its total strategic investment up to roughly $1.8 billion, citing inflation and project-specific factors, which is why investors are watching capital discipline as closely as the headline earnings growth.
Risks and unknowns
The market still sold the stock down, and the shares fell about 4% to $4.80. The reasons reported included capital intensity, meaning the heavy and ongoing spending the infrastructure requires, along with mixed operating performance and pressure on branded postpaid mobile customers after price rises. If Aura revenue ramps slowly, that spending could weigh on free cash flow and returns.
Competition adds a second risk. Alternative routes exist, so pricing pressure is possible, yet no recent analyst commentary on Vocus, NBN Co, Optus or the Indigo subsea system turned up in the research. No broker consensus or target prices were found either.
The market is asking whether Aura earns more than its cost of capital, and the disclosures needed to answer that question do not yet exist. Four signals deserve your attention:
- Any separate disclosure of Aura revenue
- Utilisation, meaning how much of the capacity built is actually sold
- Free cash flow after capital spending
- Wholesale pricing on competing east-west routes
Weighing the opportunity against the unknowns
The route is real, and the hyperscaler demand behind it is credible. The WA forecast points in the right direction, but Telstra paid for it, and the link between Aura and Telstra’s earnings remains undisclosed.
Your thesis gets stronger if Telstra reports Aura revenue, names more customers, and keeps free cash flow healthy while the build continues. It gets weaker if capital spending keeps rising while utilisation and pricing stay hidden, or if competitors start undercutting wholesale rates.
The next results and any update on the NaaP target for FY30 are the disclosures most likely to close these gaps.
This article is for informational purposes only and should not be considered financial advice. Investors should conduct their own research and consult with financial professionals before making investment decisions. Past performance does not guarantee future results. Financial projections are subject to market conditions and various risk factors.
—