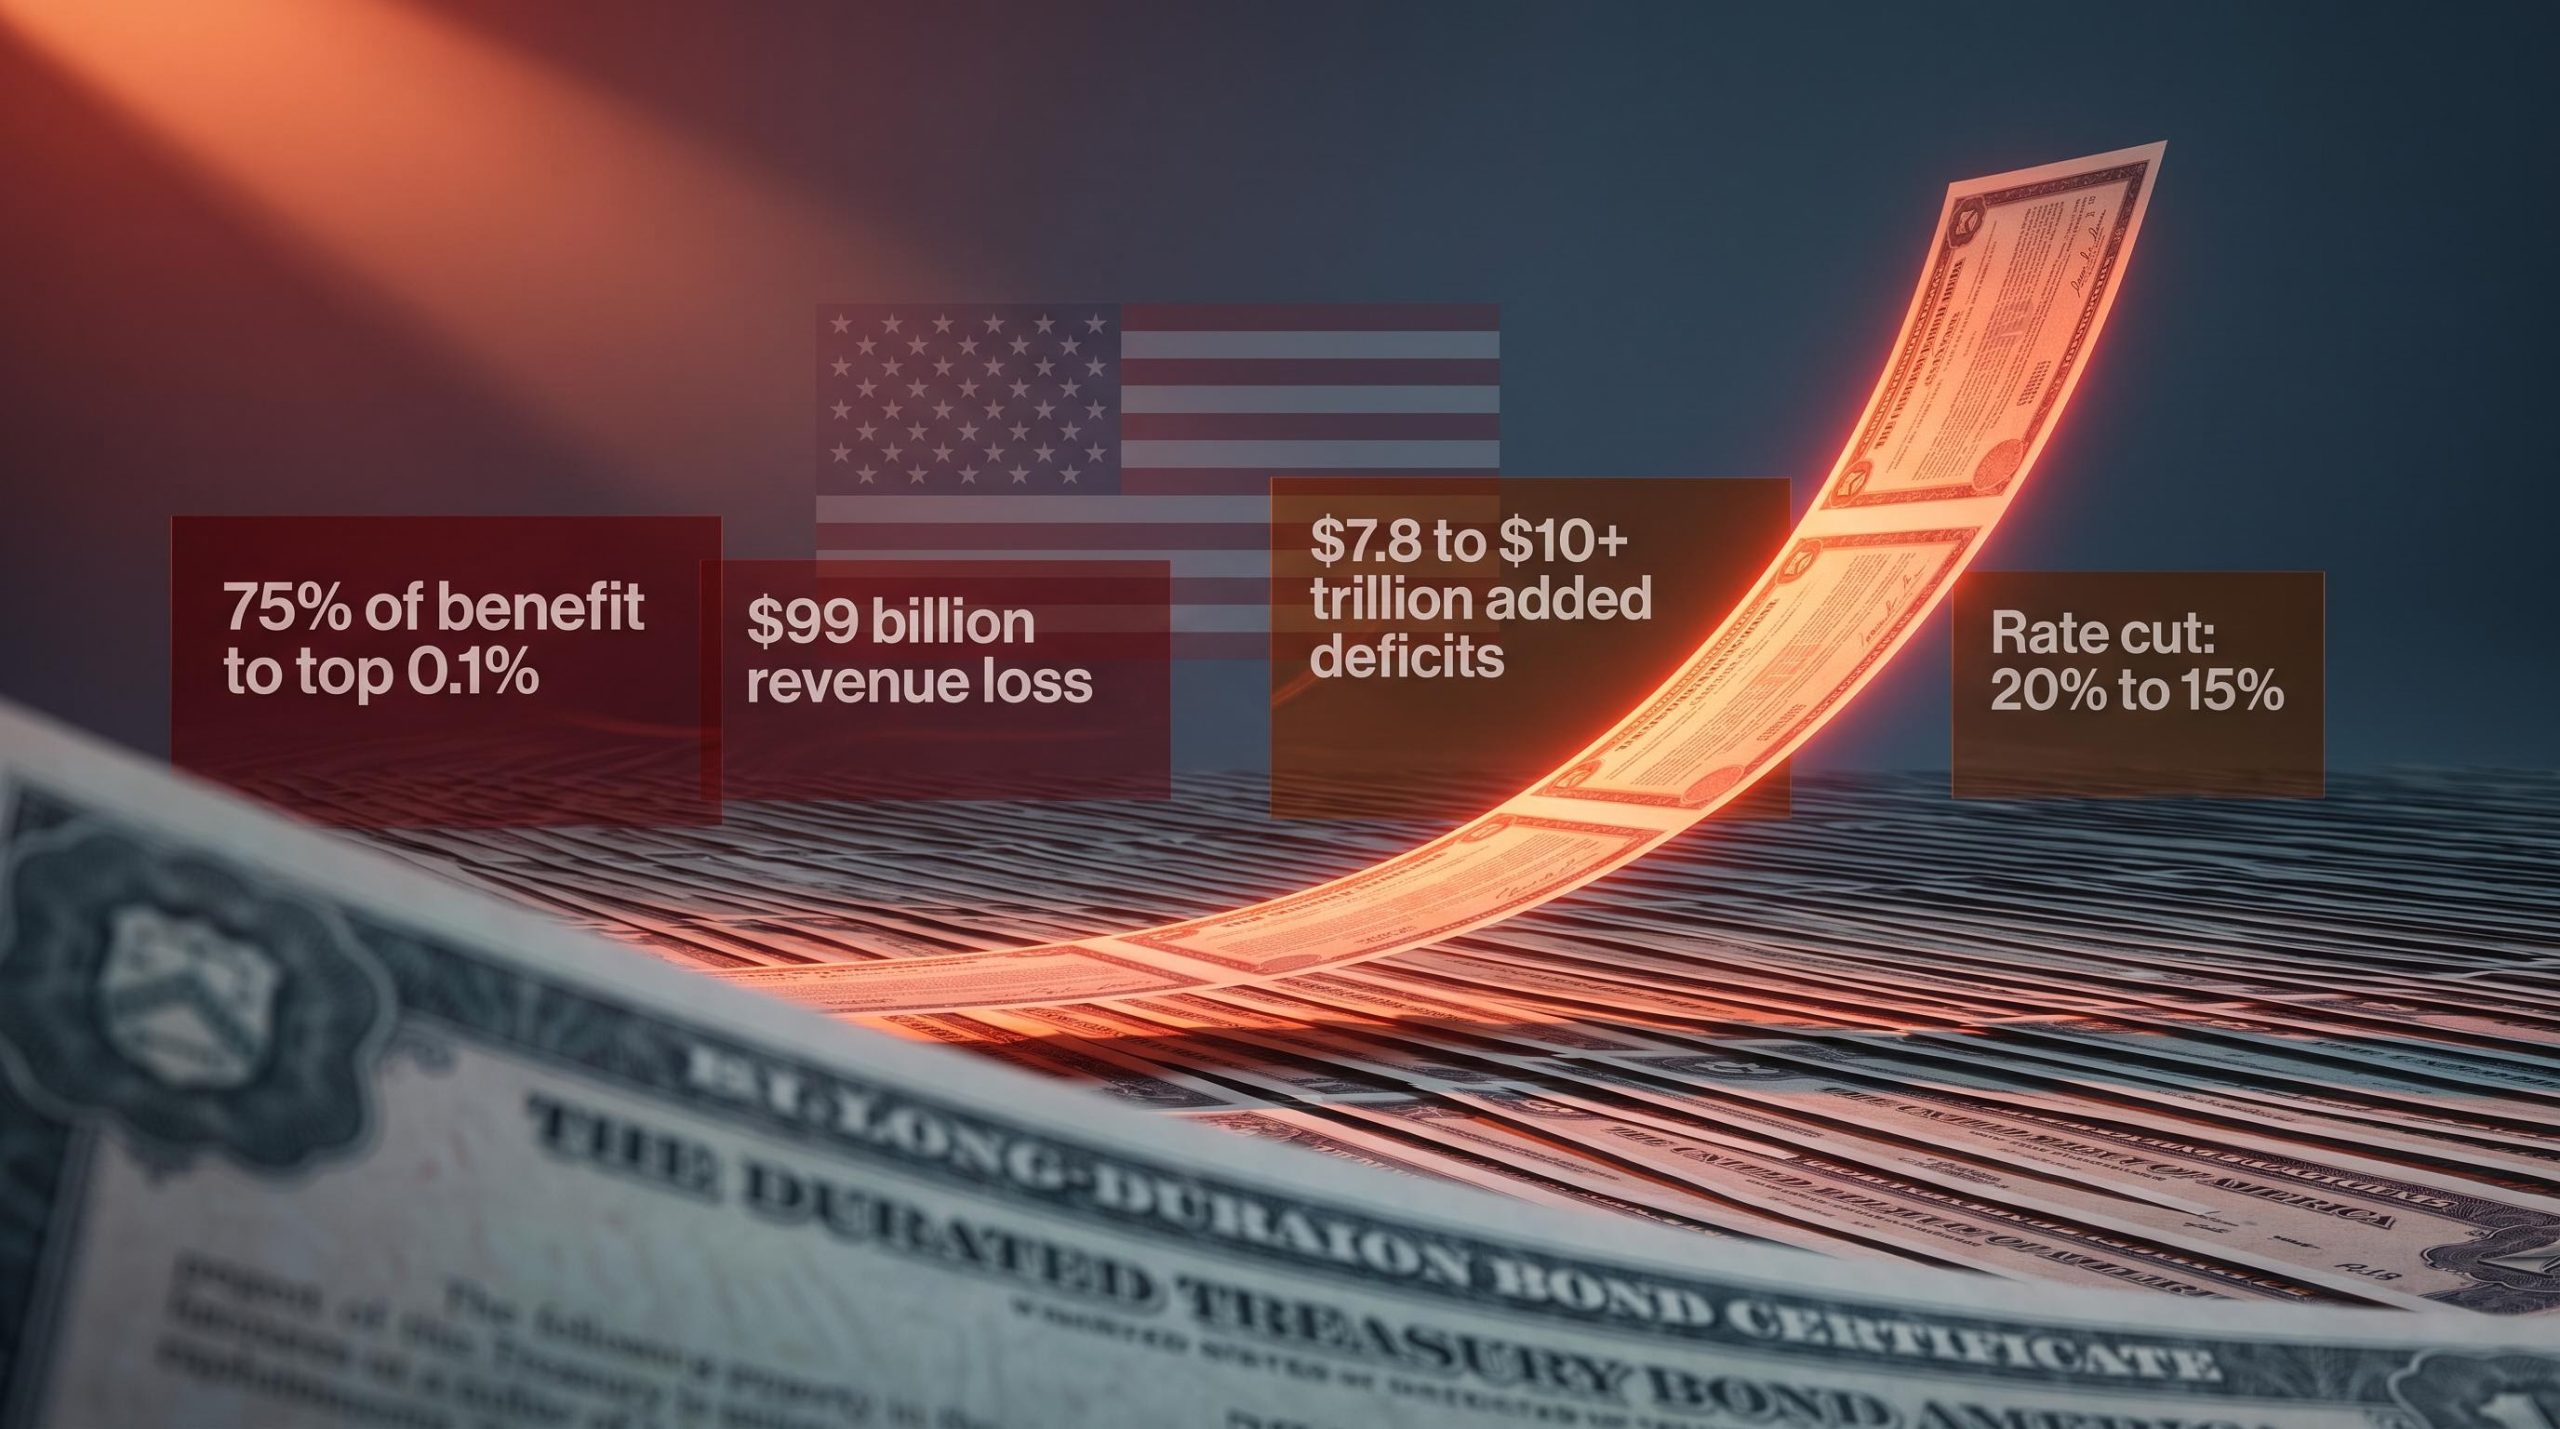
A capital gains tax cut sounds like one of the simplest pro-market moves a president can make. Lower the rate, unlock realisation activity, watch equities climb. That is the political framing, and on the surface it is intuitive.
The market read is more complicated. ING analysts have noted that the proposed cut carries currency headwinds rather than growth-positive implications, given that it would arrive without offsetting revenues or spending reductions. The reason sits in a detail the headline rarely includes: the cut would arrive unfunded, stacking additional fiscal pressure onto a Treasury market already absorbing a historically large deficit trajectory.
What matters here is not whether the policy passes but how it reprices four asset classes if it does. Here is how to trace the transmission from tax cut to Treasury yields, from yields to the dollar, from the dollar to the Fed’s reaction function, and from the Fed’s stance to the cross-asset map that determines where the risk actually lands.
Who actually benefits, and by how much
The political case for a capital gains tax cut leans on broad-growth language: lower barriers to investment, reward risk-taking, let capital flow. The distributional numbers tell a different story.
The political framing of a rate cut from 20% to 15% obscures a critical legislative timeline: no drafted bill exists, no committee has acted, and the $1.8 trillion deficit in the first ten months of fiscal year 2026 makes even sympathetic Republican legislators cautious about adding to that trajectory.
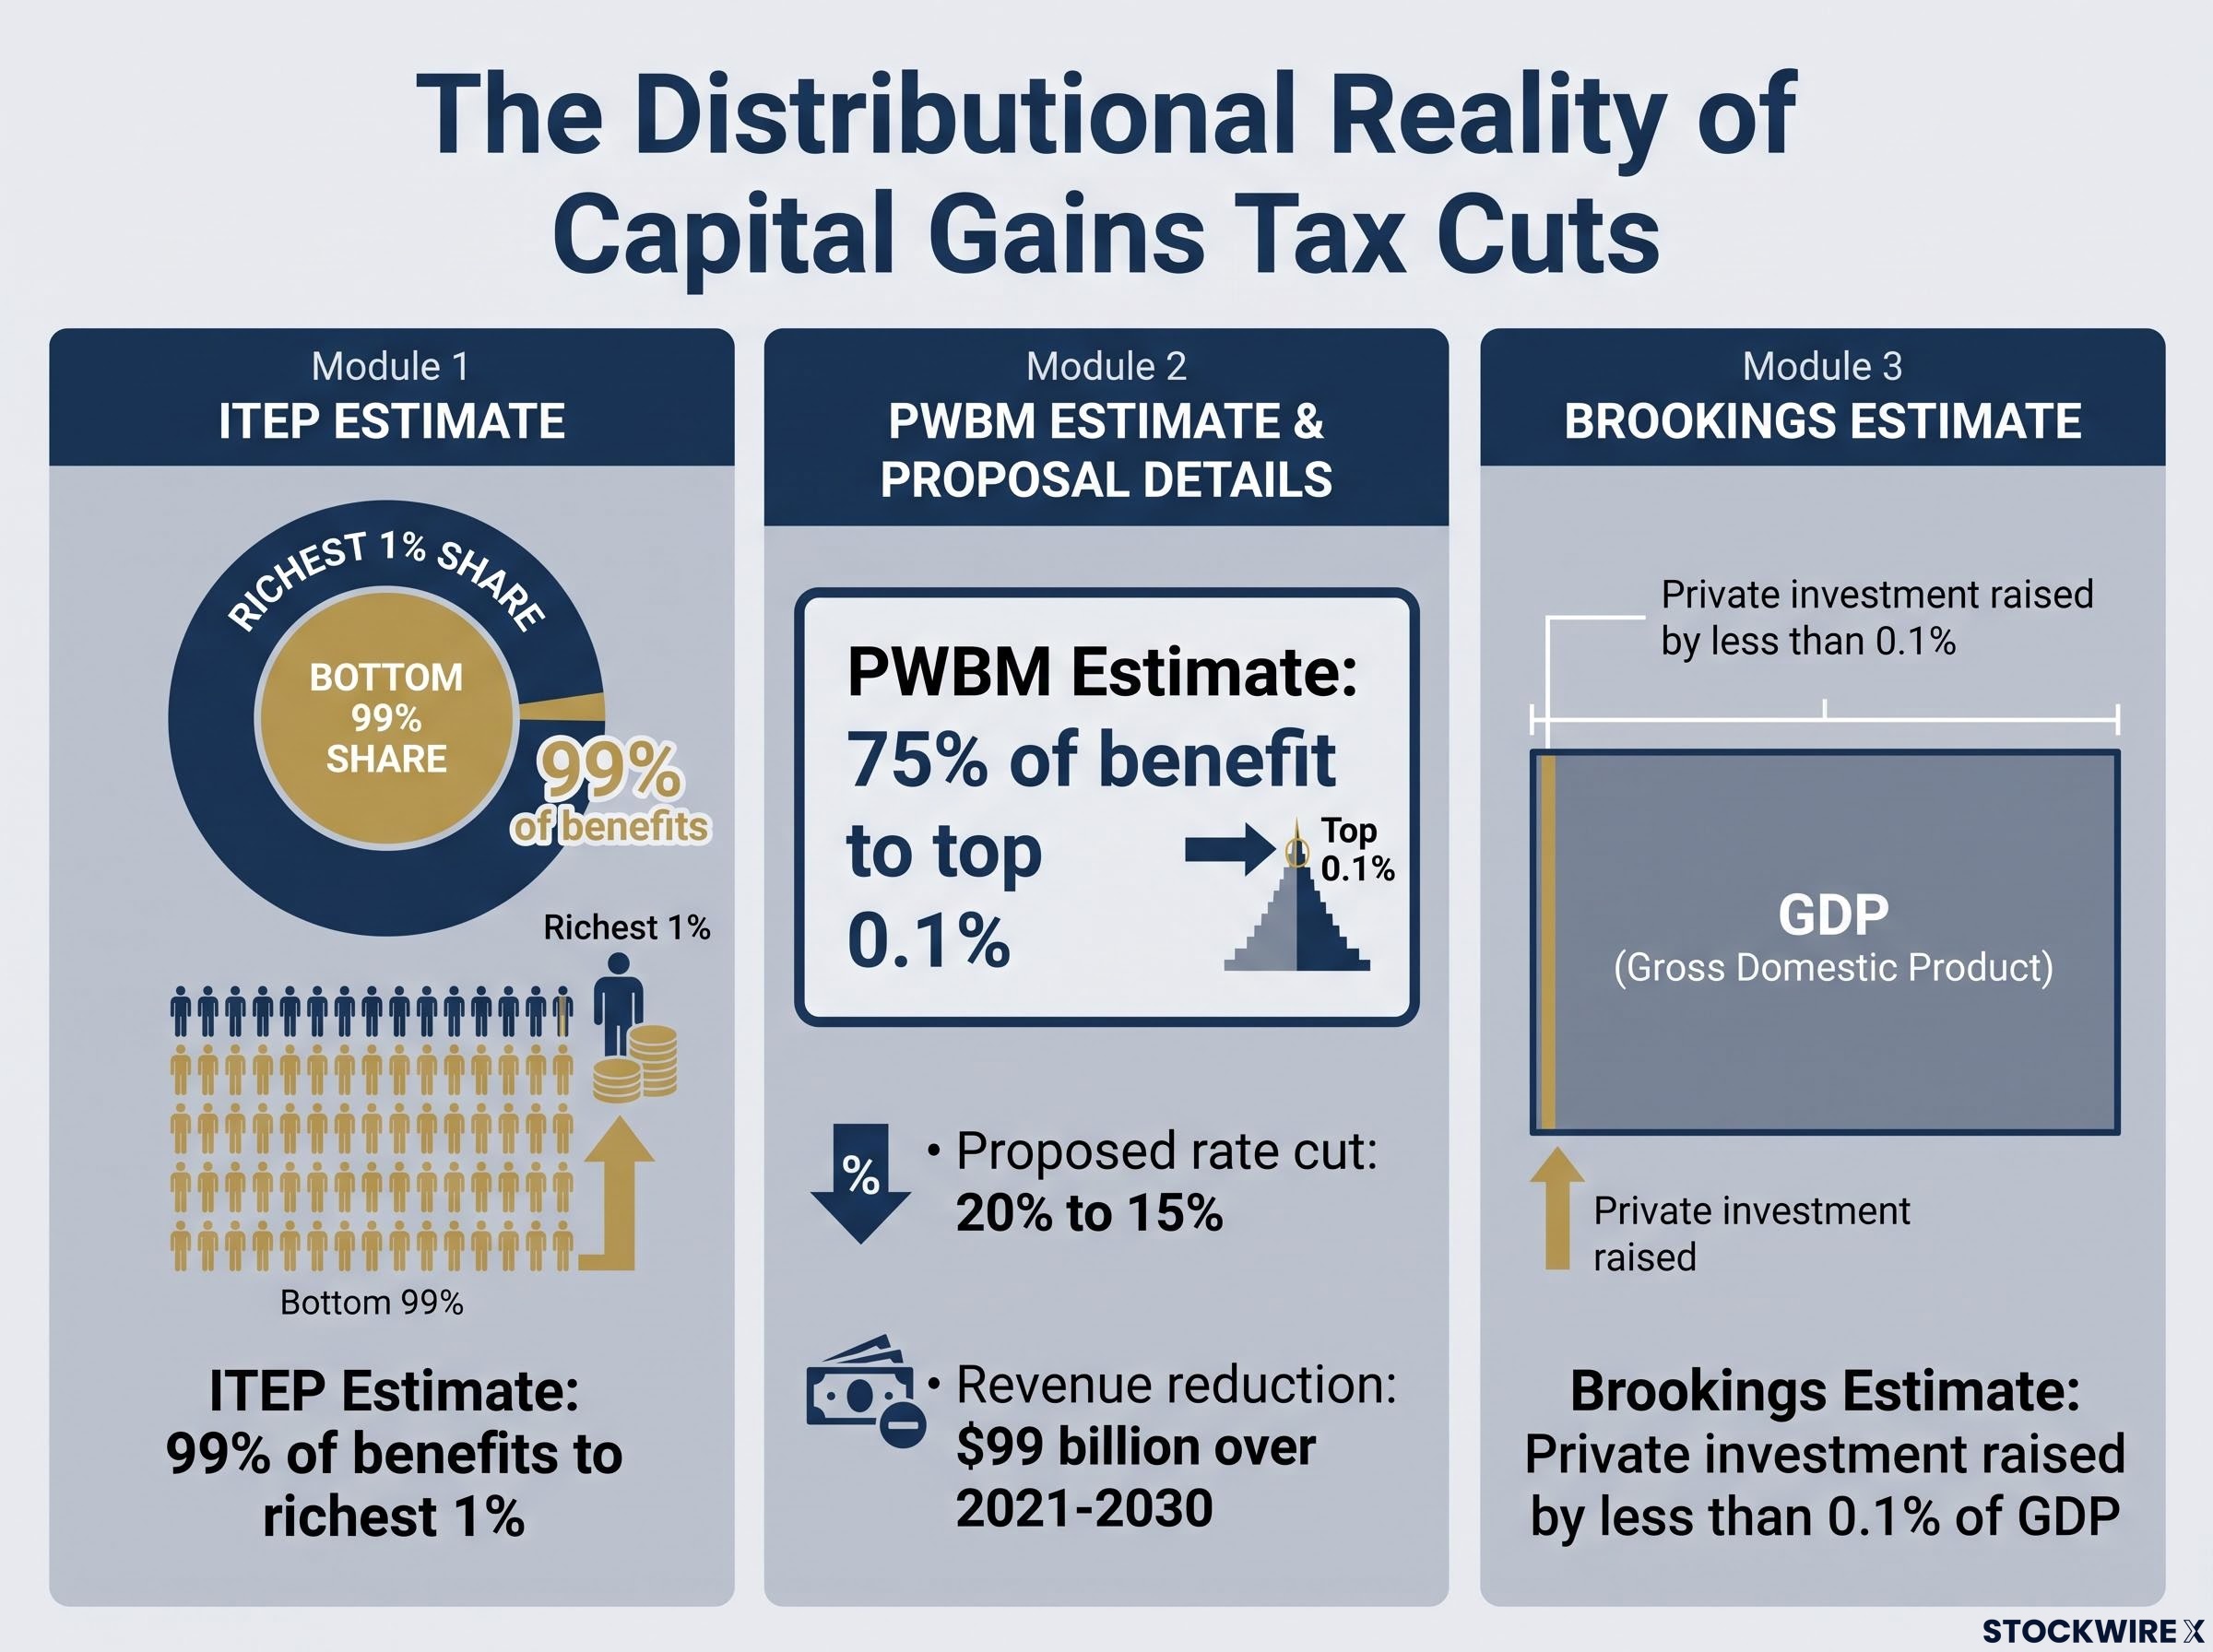
- The Institute on Taxation and Economic Policy (ITEP) estimates 99% of the benefits from the proposed Trump capital gains break would flow to the richest 1% of taxpayers.
- The Penn Wharton Budget Model (PWBM) estimates that cutting the top preferential rate from 20% to 15% would reduce federal revenues by approximately $99 billion over 2021-2030, with 75% of the benefit accruing to the top 0.1%.
- Brookings estimates that cutting the top gains rate to 20% would raise private investment by less than 0.1% of GDP, establishing that the real-economy offset is small relative to the fiscal cost.
The Brookings capital gains investment analysis establishes that cutting the top rate to 20% would raise private investment by less than 0.1% of GDP, a figure small enough to confirm that the deficit cost, not the stimulus story, is the dominant variable in any cross-asset framework.
75% of the benefit accruing to the top 0.1% of taxpayers, according to PWBM estimates, makes this one of the most concentrated tax proposals in recent fiscal history.
That concentration matters for the fiscal arithmetic. The primary beneficiaries are high-net-worth households with high marginal propensities to save rather than spend. The growth multiplier is structurally weak, which means the deficit cost is the dominant variable to price, not the stimulus story. Once that distinction lands, the rest of the analysis follows from it.
When big ASX news breaks, our subscribers know first
The fiscal mechanics: what “unfunded” means for the Treasury market
The chain from policy to market impact runs in three steps, each mechanically linked to the next:
- Without offsetting revenues or spending cuts, the Treasury must issue additional debt to cover the revenue shortfall.
- That additional issuance concentrates at the long end, specifically at 10- and 30-year maturities, where the government funds structural deficits.
- More supply at the long end, absent a proportional increase in demand, pushes bond prices down and yields up.
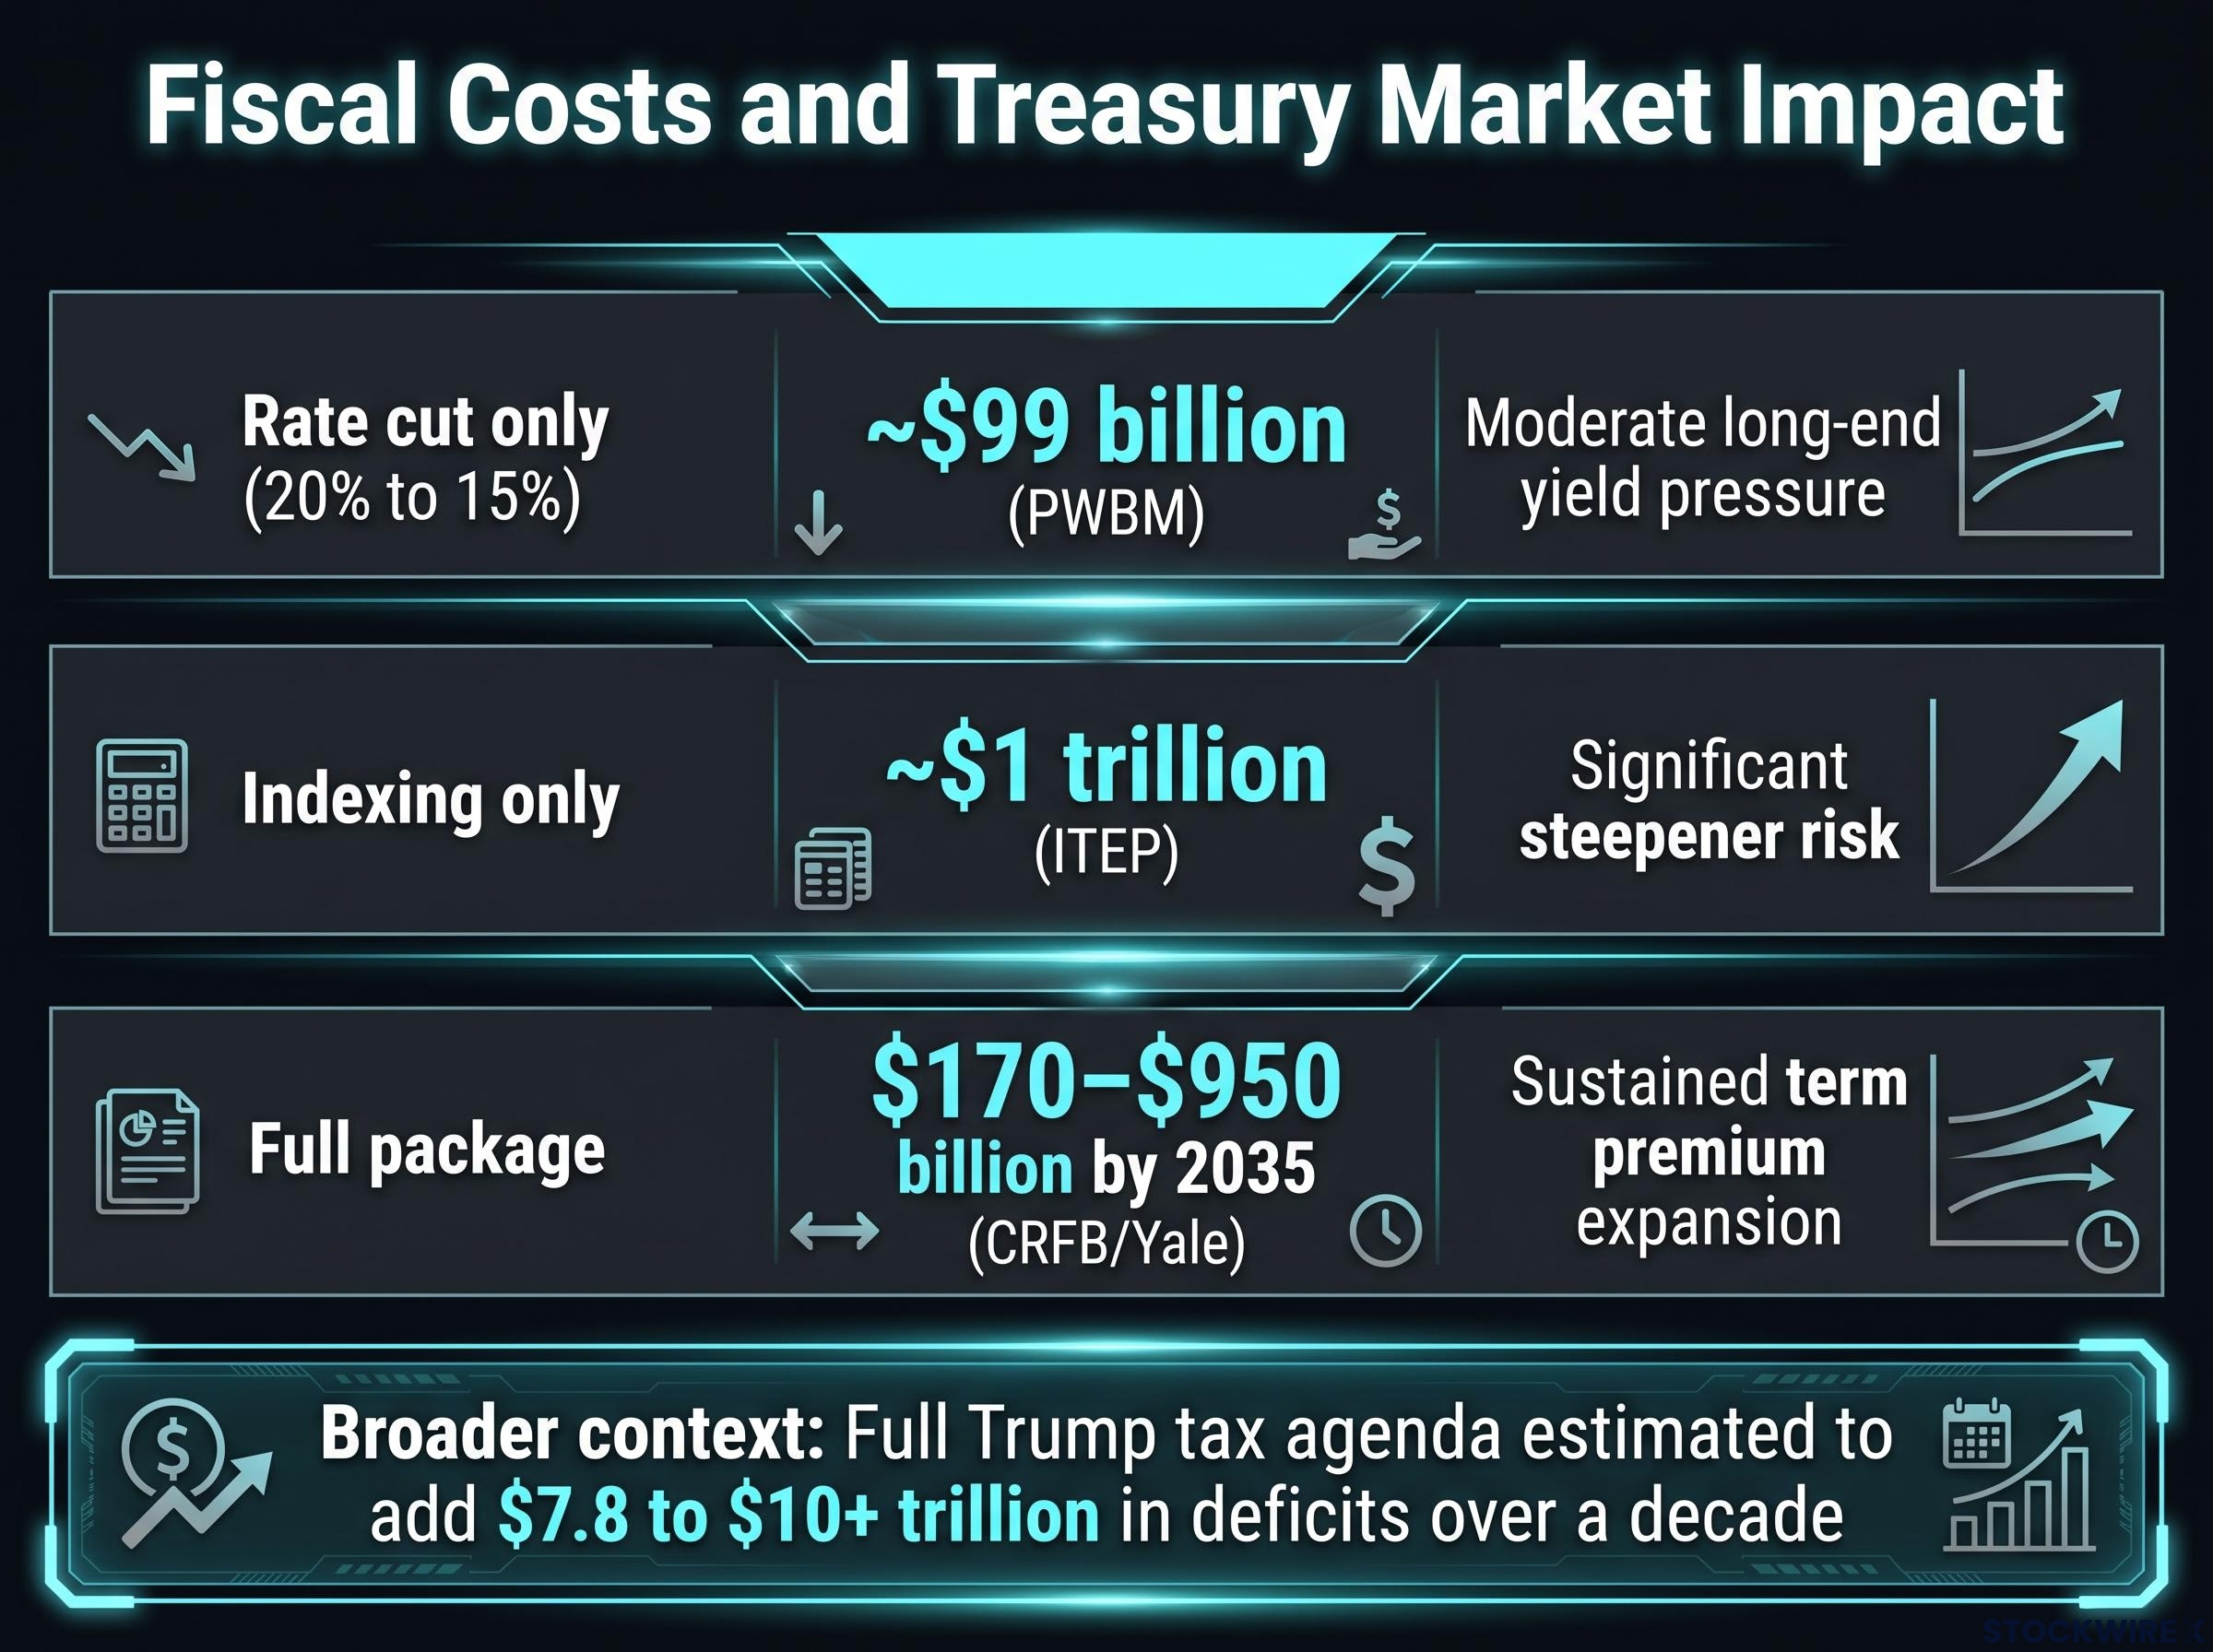
The fiscal cost range is wide but consistently large:
| Policy scope | Estimated 10-year fiscal cost | Primary market impact |
|---|---|---|
| Rate cut only (20% to 15%) | ~$99 billion (PWBM) | Moderate long-end yield pressure |
| Indexing only | ~$1 trillion (ITEP) | Significant steepener risk |
| Full package | $170-$950 billion by 2035 (CRFB/Yale) | Sustained term premium expansion |
The broader fiscal context sharpens the picture further. The Trump administration’s full tax agenda has been estimated to add $7.8 to $10+ trillion in deficits over a decade. The capital gains cut is incremental, but it lands on a trajectory that is already steep.
Why term premium is the pressure point to watch
Term premium is the extra yield investors demand for holding long-dated bonds instead of rolling short-term paper. It reflects fiscal risk, inflation uncertainty, and the sheer duration risk of locking capital into 10- or 30-year instruments.
When the deficit trajectory deteriorates, and when foreign demand for Treasuries is less automatic than it was a decade ago, term premium is the variable most likely to move first and most durably. For anyone holding duration, the practical read is that this is a non-trivial steepener risk event: higher long-end yields driven by supply dynamics, not by an improving growth outlook that would justify the move.
Term premium repricing is already visible in the long end of the curve: the 30-year Treasury briefly exceeded 5.19% intraday in May 2026, its highest level since 2007, driven by a combination of Moody’s sovereign downgrade, sticky inflation expectations, and heavy Treasury supply that mirrors precisely the supply-side pressure an unfunded capital gains cut would amplify.
Three channels through which a tax cut weakens the dollar
The intuition that a pro-growth tax cut should strengthen the dollar is reasonable on the surface. Three specific transmission channels work against it.
- Fiscal credibility: Large, unfunded tax cuts that primarily benefit the wealthy worsen the long-term debt trajectory and signal less willingness to stabilise the fiscal path. For a reserve currency, this raises the risk premium on dollar assets at the margin.
- Risk-on rotation: Pro-equity stimulus encourages global investors to rotate into higher-beta assets (emerging market equities, non-US equities, high-yield credit) rather than park capital in the dollar. In these regimes, the dollar frequently underperforms even when US growth is solid.
- Real yield dynamics: If higher deficits raise inflation expectations but nominal yields do not fully adjust, real yields on dollar assets erode, removing one of the structural supports for dollar strength.
ING’s analysis points to the policy carrying a negative bias for the dollar alongside pro-risk appetite implications, a reading that aligns with the broader analytical view that unfunded fiscal loosening of this kind tends to weigh on the currency while encouraging rotation into higher-beta assets.
The qualification matters. The Fed’s stance is the swing factor. If markets conclude the Fed will lean harder against fiscal looseness, higher real yields could partially offset the fiscal-credibility drag. The exact magnitude of dollar weakness is directionally sound but cannot be precisely quantified in advance, as FX outcomes depend on global risk conditions and the Fed’s reaction function.
For USD-heavy positioning, the practical read is not a dollar collapse but a shift in asymmetry: the currency tailwind that might accompany a genuine growth acceleration is unlikely to materialise from this specific fiscal move.
How this complicates the Fed’s already narrow path
Capital gains cuts have small direct real-economy effects. Brookings’ estimate of less than 0.1% of GDP in additional private investment tells you the macro offset is too thin to change the Fed’s inflation calculus. But even marginal fiscal stimulus in an economy with limited slack tilts the aggregate demand picture toward hotter, not cooler.
The practical monetary policy implications follow:
- The Fed, seeing loose fiscal policy layered onto already-elevated debt and sticky inflation, may lean toward a “higher for longer” rate bias.
- A higher policy rate means a higher discount rate on future cash flows, which directly offsets the equity market benefit the tax cut is designed to deliver.
- The policy may be partially self-defeating: supporting asset prices in design while raising the discount rate applied to those same assets through the Fed’s reaction.
Treasury yields as policy levers have displaced the equity market as Washington’s primary pressure signal, with the 10-year at 4.66%-4.67% and the 30-year approaching 5.18% simultaneously tightening mortgage rates, corporate borrowing costs, and federal debt servicing in ways that make additional unfunded fiscal looseness politically self-limiting.
Capital gains changes alone are unlikely to dominate the Fed’s reaction function. They matter as part of the cumulative fiscal narrative, with the broader agenda estimated at $7.8 to $10+ trillion in added deficits over a decade.
The early contours of a fiscal dominance discussion
Fiscal dominance is the condition where rising government debt and interest costs constrain the central bank’s ability to tighten without triggering a debt-servicing spiral. The Fed loses room to raise rates because doing so makes the government’s own borrowing costs unsustainable.
This is an early-stage risk, not an imminent outcome. The current policy trajectory is moving in the direction of tighter fiscal-monetary constraints, making it a variable to monitor rather than a present crisis. But each unfunded addition to the deficit shortens the distance between where the economy sits and where that constraint begins to bind.
Cross-asset ripple effects: mapping the second-order moves
The policy does not hit one market. It ripples through several, and the direction depends on which transmission channel dominates.
| Asset class | Directional bias | Key condition |
|---|---|---|
| Equities | Bifurcated (direct support, indirect headwind) | Long-duration growth names most exposed to discount rate offset |
| Treasuries (long end) | Headwind | Steepener risk via supply and term premium, regardless of growth outlook |
| US Dollar | Mild headwind | Depends on Fed response; risk-on rotation amplifies softness |
| Emerging Markets | Conditionally supportive | Requires softer dollar plus Fed patience; not a standalone catalyst |
| Commodities | Conditionally supportive | Weaker dollar supportive for pricing, but real-economy demand dominates longer-term |
The cleanest positioning expression of this policy is not a broad “risk-on” trade. The Treasury market absorbs the fiscal cost most directly and most mechanically, which makes a yield curve steepener the most straightforward expression of the analytical thesis. Equities face a more ambiguous picture, where the direct benefit of lower capital gains rates competes with the indirect headwind of a higher discount rate if the Fed leans hawkish.
What the policy uncertainty actually changes for your positioning
Not every element of this analysis carries the same conviction. Distinguishing what is well-supported from what remains speculative is where positioning discipline starts.
The distributional skew, the deficit impact, and the Treasury steepener risk are analytically well-grounded. The exact magnitude of dollar weakness, the Fed’s reaction function, and dynamic behavioural responses in capital gains realisation patterns remain model-sensitive and speculative.
Three variables will resolve the key uncertainties as speculation moves toward legislation:
- The size and scope of any final legislation, which determines whether the fiscal cost sits at the lower end ($170 billion) or the upper end (close to $1 trillion).
- The Fed’s forward guidance in response to fiscal looseness, which determines whether the “higher for longer” bias materialises or stays implicit.
- Global risk appetite at the time of implementation, which determines whether the dollar softness translates into a meaningful EM and commodity bid or dissipates.
The asymmetry in analytical confidence tells you where to act and where to wait. Underweighting long duration in anticipation of steepener risk is well-supported by the mechanical chain from deficit to issuance to yields. Calibrating dollar hedges is a secondary move, better held until the Fed’s stance becomes clearer.
For investors wanting to understand how major allocators are structurally repositioning in response to this fiscal trajectory, our deep-dive into institutional portfolio shifts away from long-duration Treasuries examines how BlackRock, JPMorgan, Goldman Sachs, and Bridgewater have each independently reached the same rotation conclusion.
This article is for informational purposes only and should not be considered financial advice. Investors should conduct their own research and consult with financial professionals before making investment decisions. Financial projections referenced are subject to market conditions and various risk factors. Past performance does not guarantee future results.