Australian households are sending a recession-era signal. Consumer sentiment has dropped to 80.4 and home values have now fallen for six straight months, yet the ASX 200 sits near 8,730 while the Australian 10-year bond yield holds above 5.3%. Only one of those two stories can be right about where the economy is heading.
The squeeze has a clear starting point. Headline inflation jumped to 4.0% in August, and on 29 September the Reserve Bank of Australia (RBA) lifted the cash rate to 4.60%. That was its fourth hike this year and took the rate to its highest level since 2011.
That decision now sits behind every choice about mortgages, savings and portfolios. The impact of this RBA rate hike on Australian households is already visible in the data, even if the sharemarket has not caught up.
Here is how the tightening is reaching your household and portfolio, why shares have held up so far, and which three releases next week could change the picture.
Is inflation really accelerating, or is the 4.0% headline misleading?
On its face, the August figure looks bad. The Australian Bureau of Statistics (ABS) reported annual headline inflation of 4.0%, up from 3.5% in July, with prices rising 0.4% in the month (0.7% seasonally adjusted). Housing costs climbed 5.7% over the year, pushed up by new-build costs, electricity and rents, while petrol has returned to above $2.30 per litre.
The core tells a different story.
The trimmed mean measures underlying inflation by stripping out the most extreme price moves each month. It is the RBA’s preferred gauge, and it held at 3.6% for a third consecutive month. On a monthly basis it slowed to 0.2%, down from 0.5% in July.
| Measure | Annual (August) | Monthly (August) | What it signals |
|---|---|---|---|
| Headline CPI | 4.0% (from 3.5%) | +0.4% original, +0.7% seasonally adjusted | All prices, including fuel and electricity shocks |
| Trimmed mean | 3.6% (flat for three months) | +0.2% (from +0.5%) | Underlying trend with extreme moves removed |
The ABS itself explains the gap. Michelle McCririck, head of prices statistics, pointed to energy as the dividing line.
ABS on the divergence Automotive fuel and electricity are excluded from the trimmed mean and were “key drivers of the difference between headline and trimmed mean inflation,” according to Michelle McCririck.
The experts read the same numbers differently. Rob Wilson, CFA, of Selfwealth argues the data offers little evidence that inflation is under control, which explains why the RBA kept tightening. Commonwealth Bank economists and the ABC see a core that is gradually plateauing, with energy creating noise at the headline level.
Both camps can point to evidence, and the RBA has not said which one it accepts. What this tells you is that the next rate decision depends on whether energy shocks spill into everyday prices. If you hold a mortgage, the trimmed mean, not the headline, is the number to watch.
Energy has been a persistent distortion this year, and the electricity price surge as government rebates expired has kept housing the dominant upward pressure in the CPI basket even when fuel eased.
When big ASX news breaks, our subscribers know first
How does a rate hike reach your mortgage, your rent and your savings?
The cash rate is the interest rate banks charge each other for overnight loans. When the RBA lifts it, banks pass the higher cost on to borrowers and, more slowly, to depositors.
For variable-rate borrowers, repayments rise within weeks. Fixed-rate borrowers feel it later, when their loan resets to a higher rate. Either way, disposable income falls.
The effect then spreads outward. Buyers can borrow less, so they can pay less, which pushes values down. Landlords facing higher costs lift rents where vacancies are tight, and because higher rates also slow construction, rent pressure feeds back into inflation.
Lenders assess buyers at a stress-test rate roughly three percentage points above advertised variable rates, so each RBA hike cuts borrowing capacity by more than the headline increase suggests.
| Group | Channel | Effect | Direction |
|---|---|---|---|
| Mortgage holders | Variable rates and fixed-rate resets | Higher repayments, less disposable income | Hurt |
| Renters | Landlord costs and slower construction | Rising rents where vacancy is tight | Hurt |
| Property buyers | Lower borrowing capacity | Less to spend, downward pressure on values | Hurt |
| Savers | Deposit and term-deposit rates | Better income on cash | Helped |
| Income investors | Higher cash and bond yields | Stronger income, but pressure on equity and REIT valuations | Mixed |
Who gains from higher rates?
Savers are the clear winners, with cash and bond yields at their highest in years. Retirees may shift money from shares into deposits and bonds. Income investors face a trade-off: bonds become more competitive, which can weigh on share, infrastructure and listed property valuations.
Expectations are doing much of the work. More than 80% of respondents to the Westpac-Melbourne Institute survey expect mortgage rates to rise within a year, which encourages precautionary saving and weaker spending. For you, that means the hike is tightening household budgets before many repayments have even changed.
Why are homes and confidence sliding while shares hold firm?
The household squeeze
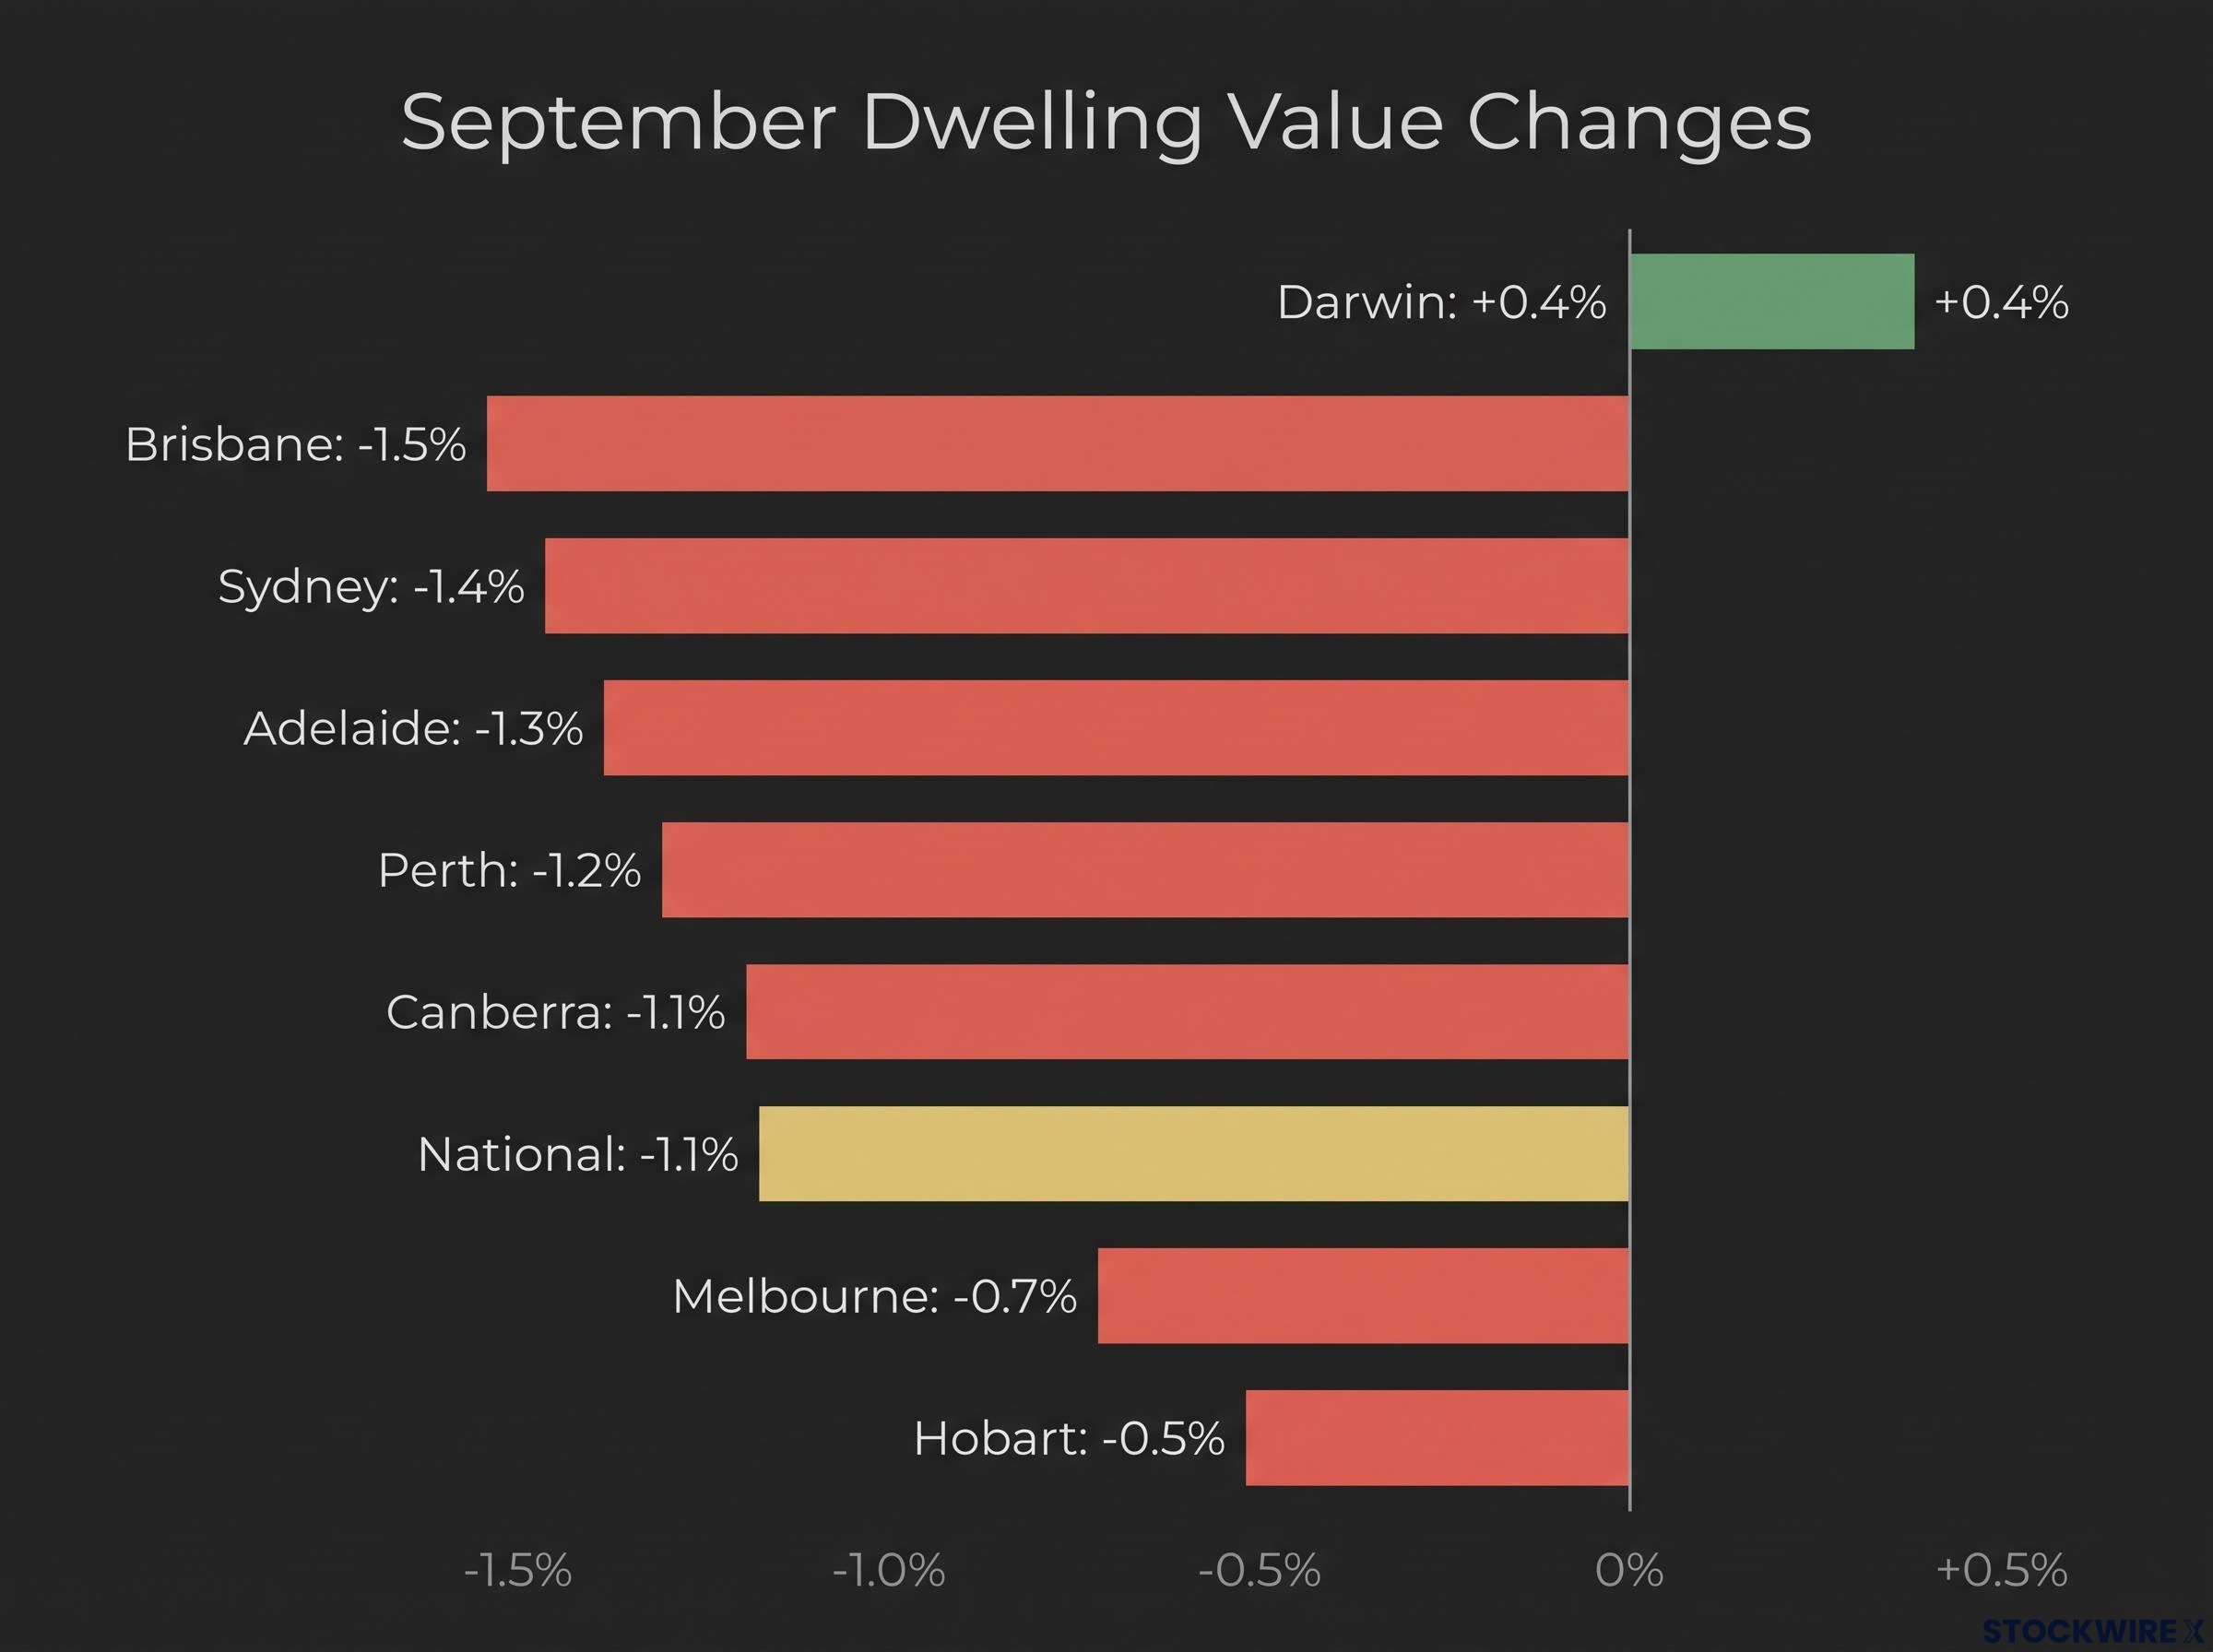
Cotality data shows national dwelling values fell 1.1% in September, the sixth consecutive monthly decline. Values now sit 5.2% below the March 2026 peak, and the annual change has slipped to 0.0%.
| Capital city | September change |
|---|---|
| Brisbane | -1.5% |
| Sydney | -1.4% |
| Adelaide | -1.3% |
| Perth | -1.2% |
| Canberra | -1.1% |
| Melbourne | -0.7% |
| Hobart | -0.5% |
| Darwin | +0.4% |
The weakness is broad. 97% of capital-city suburbs recorded falls over the past three months.
Confidence has fallen even harder. The Westpac-Melbourne Institute index dropped from 84.4 to 80.4, its weakest reading since the early-1990s recession, and respondents surveyed after the RBA decision registered around 67. NAB data shows business conditions have turned negative for the first time in six years.
The market shrug
Investors appear unfazed. The ASX 200 trades near 8,730, the Australian 10-year yield sits around 5.3-5.4%, and the US 10-year yield is near 5.3%, its highest since 2007. Four forces explain the resilience:
- Earnings resilience: large resources and financial companies keep reporting solid earnings and dividends.
- Sector mix: banks gain from wider margins and miners from commodity cycles, cushioning the index.
- Structural flows: super funds and institutions keep allocating to equities.
- Inflation-hedge positioning: some investors hold shares as protection against rising prices.
One camp argues shares are correctly pricing a soft landing, with steady underlying inflation and policy close to peak. The other sees complacency, given how far equities have drifted from housing and sentiment.
A calm index can mask internal market weakness: in July, 216 of 300 stocks fell on a day the ASX 200 slipped under 1%, a reminder that headline levels may overstate how resilient equities really are.
The divergence tells you share prices are betting on rates peaking and earnings holding. If household weakness reaches company profits, or rates stay higher for longer, a portfolio that looks calm today is more exposed than it appears.
Will the RBA hike again in November? Three releases that could decide it
Whether the soft-landing bet pays off depends largely on the RBA’s next move, and the experts disagree. The ABC and others expect a pause, citing the steady trimmed mean, an energy-driven headline and the risk of deepening the housing downturn. Westpac takes the opposite view.
Westpac Economics, 6 October 2026 “On balance, we think that a follow-up rate hike is likely at the RBA’s November meeting.”
Westpac argues inflation remains above the 2-3% target and the RBA needs to reinforce its commitment. Both sides acknowledge long policy lags, global growth and commodity risks, and the trade-off between credibility and growth. Low unemployment gives the RBA room to keep raising.
Markets had priced the September move at 93-95% probability, so the more consequential debate is where the rate peak sits, with ANZ forecasting 4.85% by November and the RBA itself describing a higher-for-longer path.
Consensus forecasts for next week’s releases were not available, so the useful question is what a hawkish or dovish result would look like.
| Date | Release | What to watch | Hawkish vs dovish reading |
|---|---|---|---|
| 13 October, 11:30am AEDT | RBA minutes | Language on further hikes | Explicit upside risk language is hawkish; emphasis on lags is dovish |
| 13 October | NAB Business Survey | Whether conditions stay negative | A rebound is hawkish; further weakness is dovish |
| 15 October, 11:30am AEDT | ABS Labour Force (September) | Unemployment rate | Low or falling unemployment is hawkish; a rise is dovish |
Beyond next week, keep an eye on:
- Australian and US bond yields
- Global equity markets
- Oil prices and Middle East developments affecting fuel
A firm jobs market and hawkish minutes would suggest planning for a higher mortgage rate through year-end. Softer jobs and a weaker NAB reading would suggest the peak is close.
What the squeeze means for your next decision, and what it does not
The pieces now fit together: a steady core, an energy-inflated headline, a weakening household sector and a sharemarket pricing a soft landing. All of it hinges on whether the RBA believes the core is cooling.
That points to three practical checks:
- Borrowers: stress-test repayments against at least one further rise.
- Savers and income investors: weigh the highest cash and bond yields in years against your risk appetite.
- Equity holders: check how exposed your holdings are if household weakness spreads into earnings.
The minutes and NAB survey on 13 October, followed by the jobs data on 15 October, will offer the clearest read yet on November.
This article is for informational purposes only and should not be considered financial advice. Investors should conduct their own research and consult with financial professionals before making investment decisions. Forecasts and forward-looking views are speculative and subject to change based on market developments.