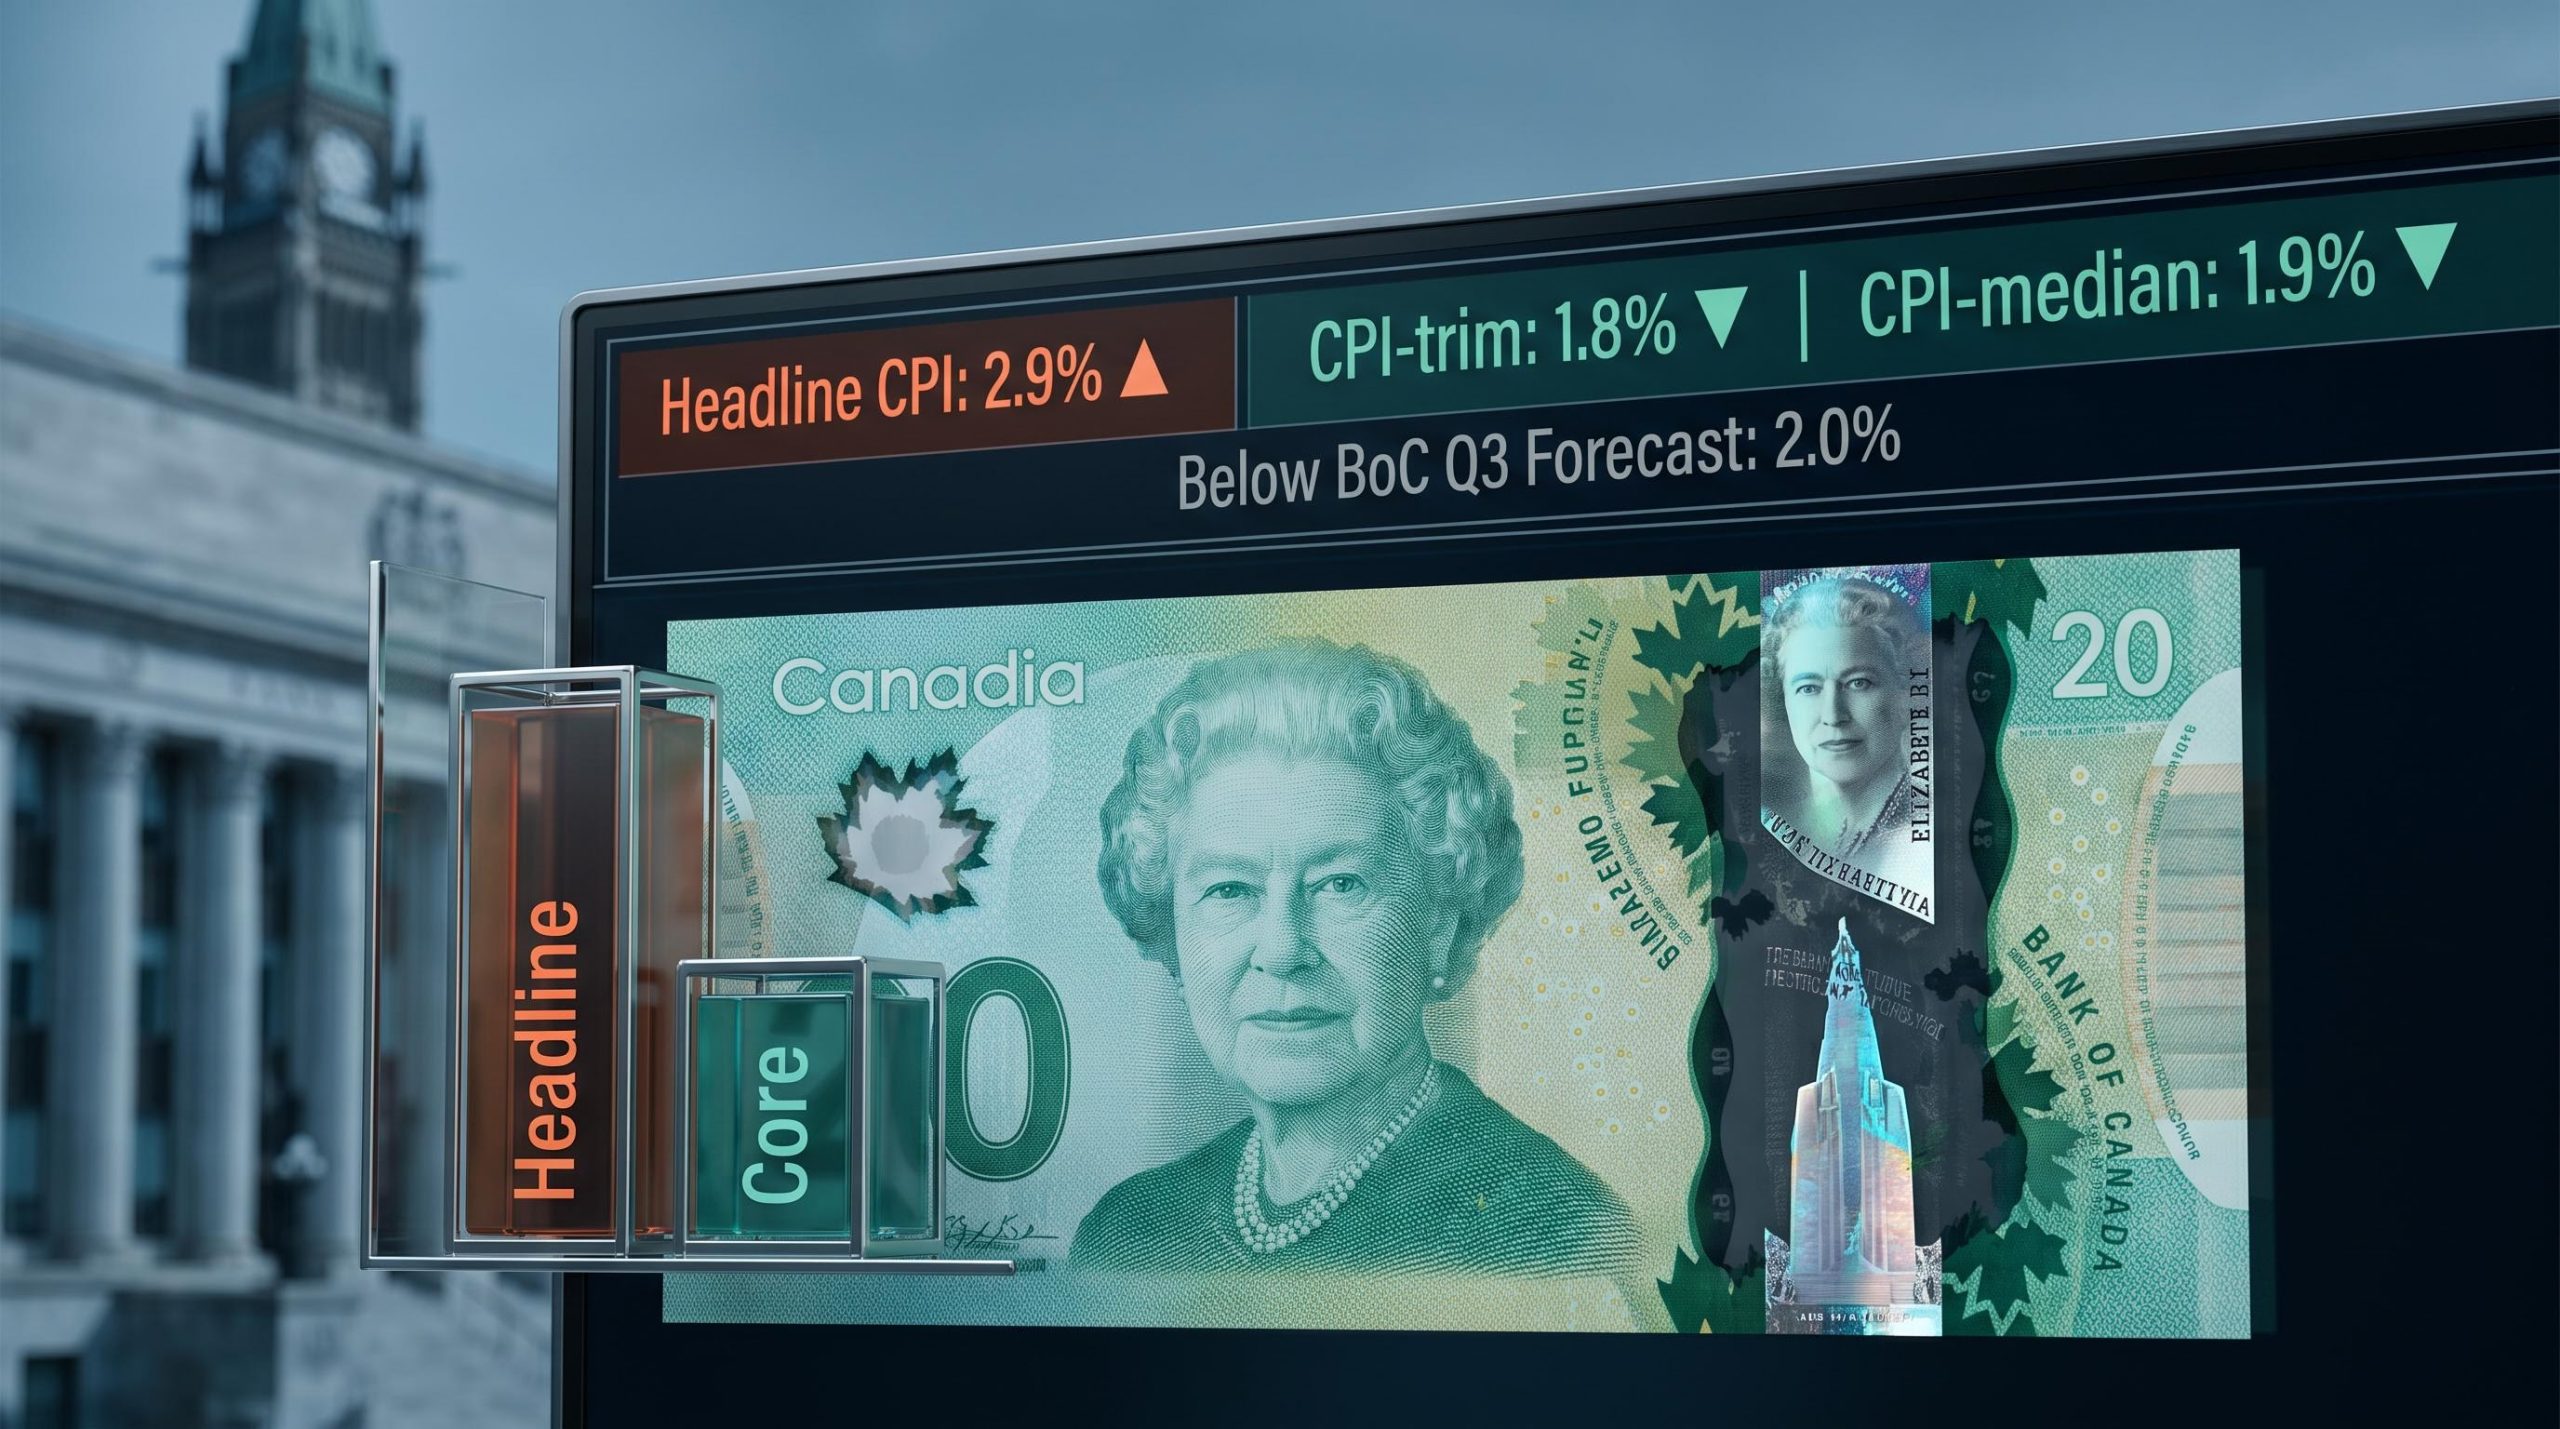
Canada’s headline consumer price inflation is projected to land near 2.9% year-over-year for July 2026. That number looks hot. It is not. The gap between what the headline says and what it actually signals about the Bank of Canada’s next move is one of the most persistent traps in macro investing, and the July data is a clean illustration of how it works.
The source of the disconnect sits in two places: the composition of the headline number (gasoline and food doing most of the lifting) and the Bank of Canada’s own preferred core measures, which are projected to print below 2% and below the Bank’s quarterly forecasts. When those two readings diverge this sharply, the headline is measuring weather and oil; the core is measuring the economy.
Here is what you need to understand to read this release correctly: which numbers the Bank actually watches, how to benchmark them against its published projections, and what the current configuration tells you about where Canadian rates are heading from here.
What the July headline CPI figure is actually measuring
The headline number carries weight because it is the one most widely reported. TD Securities analyst Robert Both, as reported by FXStreet, forecasts that Canadian CPI will come in at approximately 2.9% year-over-year in July, a 0.1 percentage point increase relative to the June reading, with a month-over-month price gain of around 0.4%.
That 2.9% figure is a composite of every category in the consumer basket, and the composition tells you more than the aggregate. Three categories are doing most of the work:
- Gasoline: Recovering from a notable decline in June, providing the largest upward contribution
- Food: Adding further positive pressure on the headline reading
- Travel services: Partially offsetting the energy and food contributions, pulling in the opposite direction
“Headline CPI is projected to track approximately 0.4 percentage points above the Bank of Canada’s Q3 forecast of 2.5%, yet the composition of that overshoot is almost entirely energy and food.”
That gap between the actual print and the Bank’s forecast sounds hawkish on the surface. But the headline number running above the Bank’s own projection tells you almost nothing about persistent price pressure until you strip out the energy and food contributions that monetary policy cannot directly control. Those are the categories interest rates do not reach.
The headline versus core divergence is not unique to Canada: the US May 2026 CPI report showed an identical diagnostic split, with a 4.2% headline driven by a 40.5% gasoline surge while core held at 2.9%, confirming that energy shocks can make headline readings actively misleading across multiple economies simultaneously.
When big ASX news breaks, our subscribers know first
How the Bank of Canada reads inflation differently from the headline number
The Bank of Canada’s formal inflation target is 2%, defined in terms of headline CPI, within a 1-3% control band. The current inflation-control agreement runs to the end of 2026. That is the mandate.
The operational reality is different. Day-to-day policy decisions are guided by core inflation measures, not the headline figure. The reason is straightforward: interest rates cannot suppress global oil prices or offset weather-driven food costs. Reacting to those moves risks inflicting unnecessary economic damage on sectors that monetary policy can actually influence. So the Bank separates the signal from the noise institutionally.
When headline and core diverge sharply, the Bank’s next rate decision is far more likely to track the core reading than the number reported in most financial headlines. For you, that means anchoring your rate expectations to the wrong number leads to the wrong positioning.
The formal target vs. the operational guide
Since January 2017, the Bank has used three core measures as its operational gauges, replacing the older CPIX definition:
- CPI-trim: Removes the top 20% and bottom 20% of weighted price changes, leaving the central 60% of the basket to represent underlying inflation
- CPI-median: Identifies the price change at the exact midpoint of the weighted distribution, representing the typical movement unaffected by outliers in either direction
- CPI-common: Estimates the inflation component shared across all categories, filtering out sector-specific shocks to reveal the broadest common trend
CPI-trim and CPI-median are the primary operational pair. CPI-common adds a cross-category perspective. Together, they give policymakers a cleaner read on the inflation that rate changes can actually affect.
Where core measures are sitting and what the undershoot means
The projected July readings for the Bank’s preferred measures sit below both the 2% target and the Bank’s own forecasts, and the gap is consistent across every angle.
| Measure | July Projection | BoC Q3 Forecast | Gap | Signal |
|---|---|---|---|---|
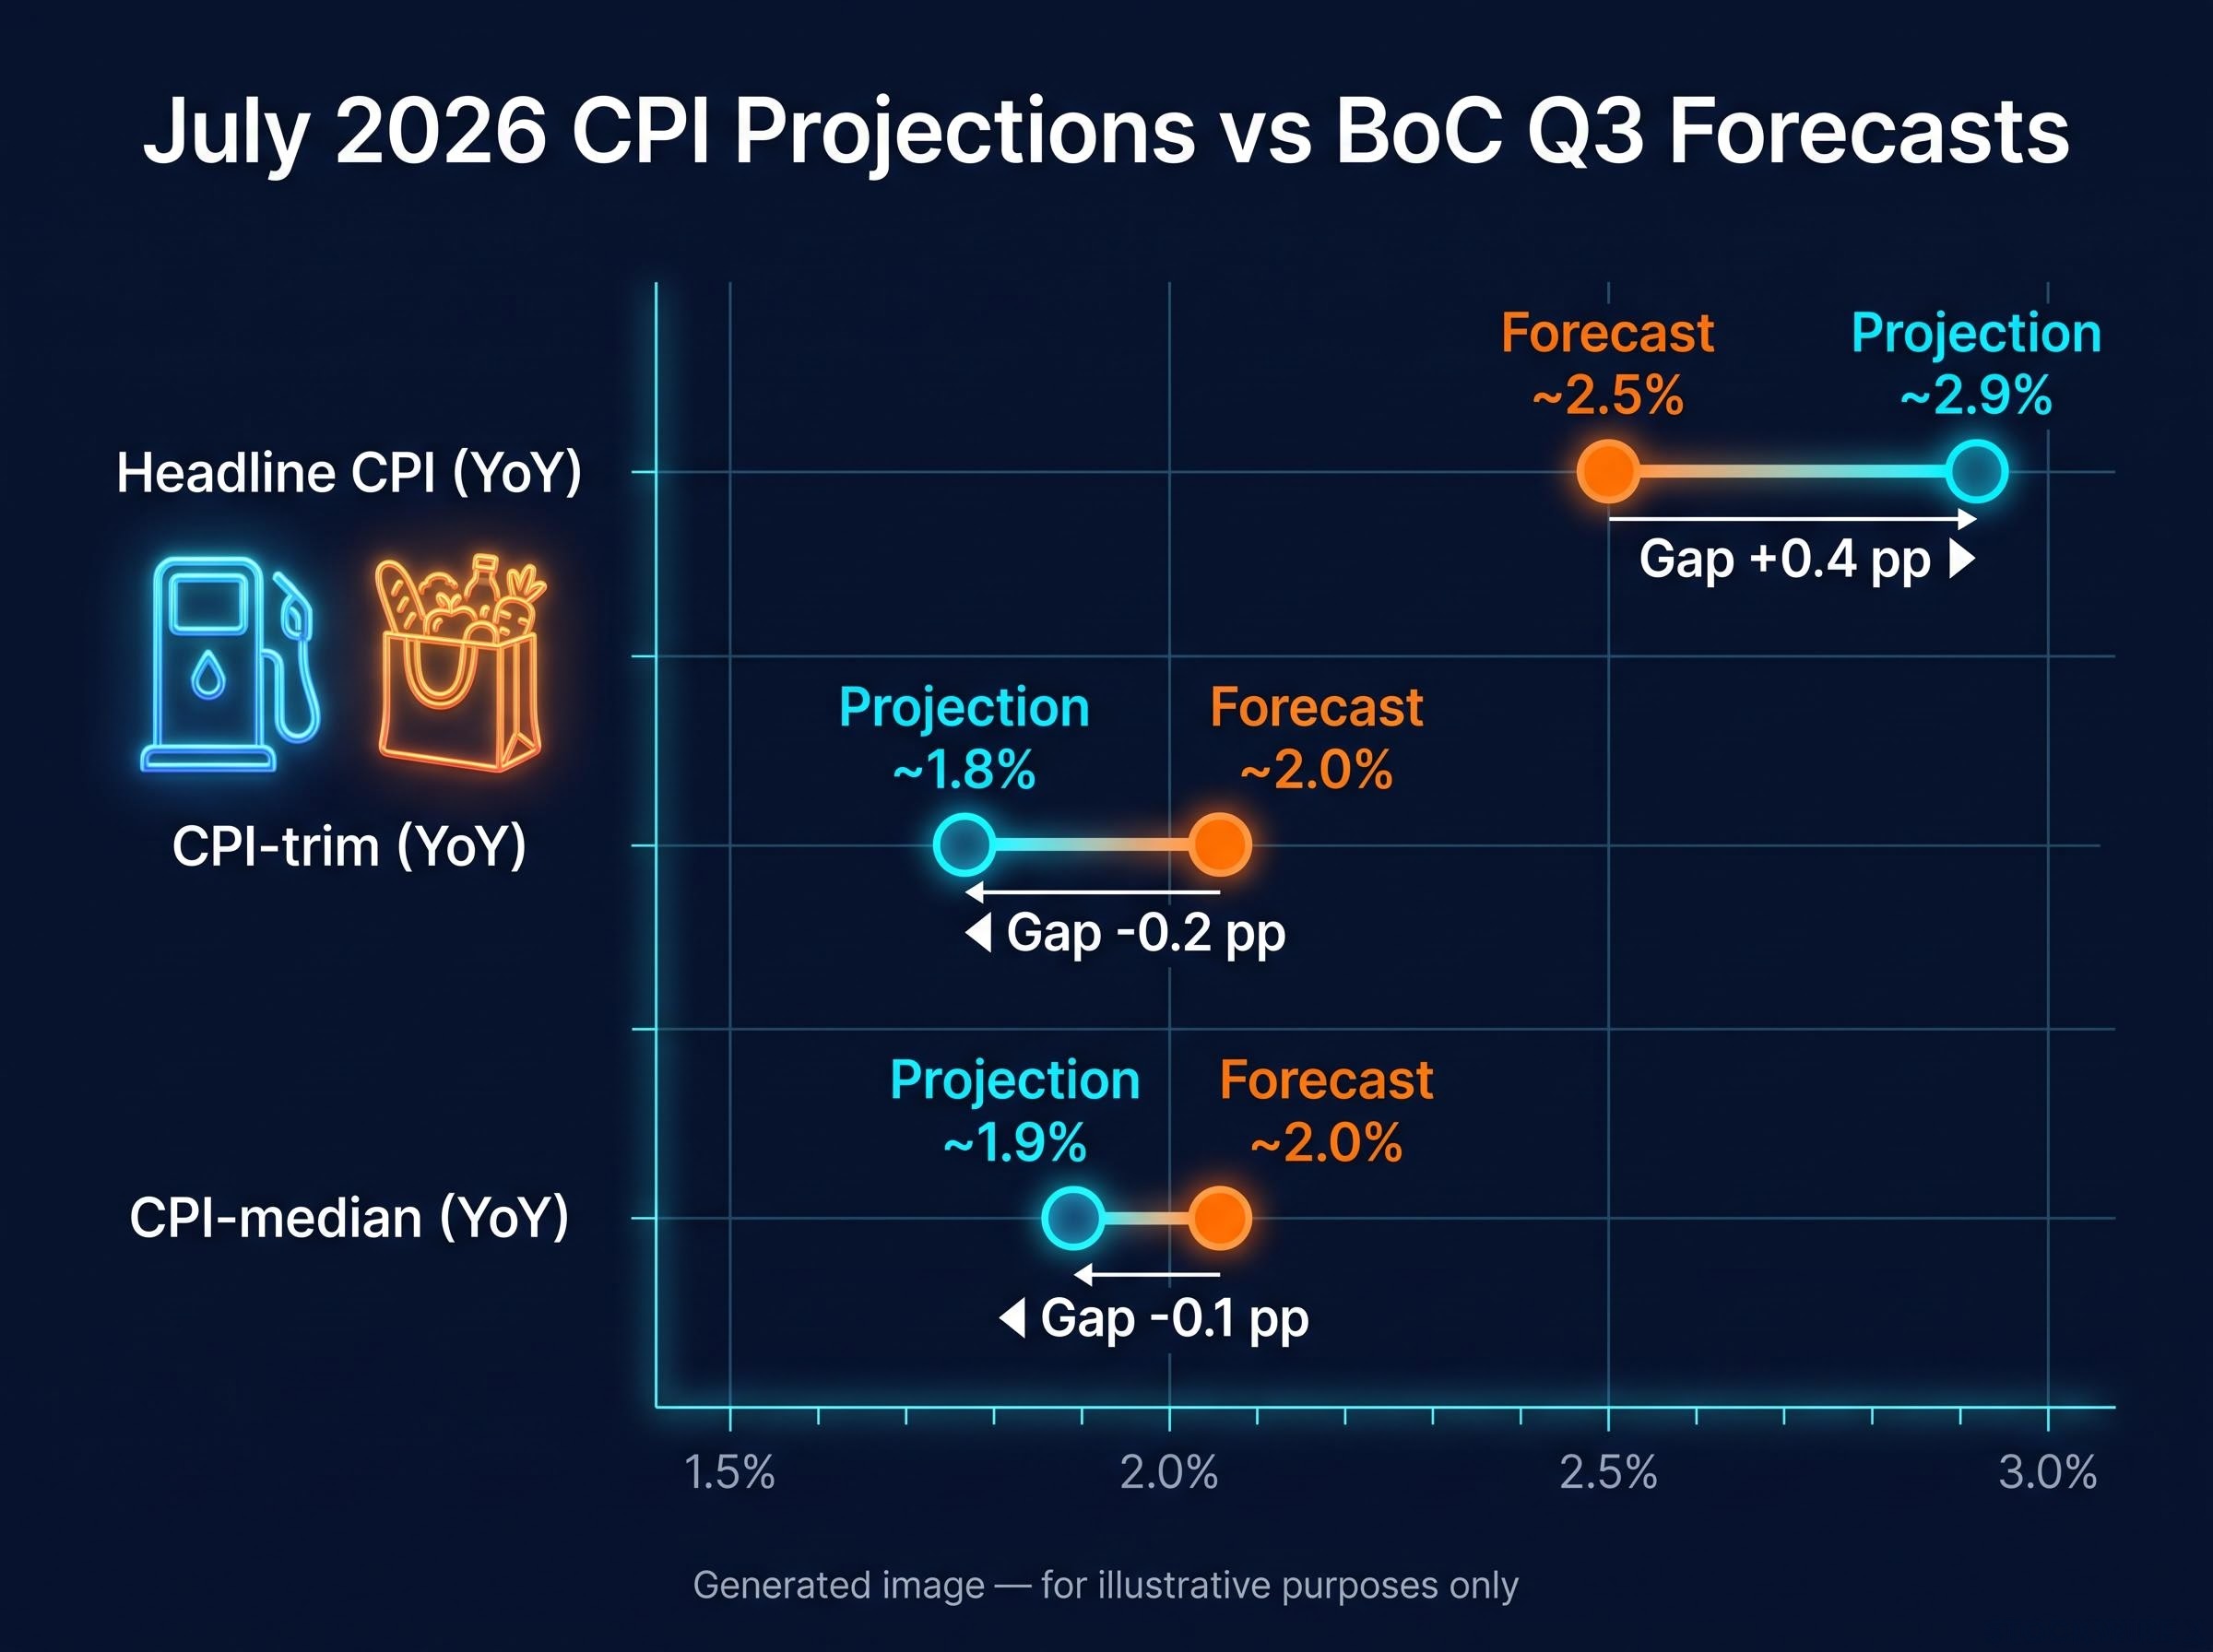
| Headline CPI (YoY) | ~2.9% | ~2.5% | +0.4 pp | Above forecast; energy/food driven |
| CPI-trim (YoY) | ~1.8% | ~2.0% | -0.2 pp | Below projection; dovish |
| CPI-median (YoY) | ~1.9% | ~2.0% | -0.1 pp | Below projection; dovish |
| Ex-food and energy CPI (YoY) | ~1.7% | N/A | N/A | Subdued |
| Core (3-month annualised) | ~1.6% | N/A | N/A | Well below target |
TD Securities analyst Robert Both, as cited by FXStreet, projects CPI-trim at approximately 1.8% and CPI-median at approximately 1.9%, both sitting modestly beneath the 2.0% Q3 target set out in the Bank of Canada’s July Monetary Policy Report (MPR). The ex-food-and-energy measure at 1.7% arrives at the same conclusion via a separate calculation.
The higher-frequency signal sharpens the point further.
“On a three-month annualised basis, core inflation is tracking around 1.6%, a reading that falls well short of both the 2% target and the Bank’s own quarterly projection.”
An undershoot of the Bank’s own core projections is not a neutral data point. It signals that monetary policy is exerting more restraint than the Bank intended at its last forecast round, making a continued easing path the mechanically consistent response. The gap between the Bank’s forecast and the incoming data is the single most actionable number in any CPI release.
Why the breadth of price increases matters as much as the level
Headline and core are two dimensions. Breadth is the third, and it is the one most commonly overlooked.
Diffusion indicators measure the share of CPI categories registering price increases above a threshold (such as 3%), revealing whether inflation is concentrated in a handful of sectors or broadly distributed across the economy. The distinction matters because concentrated inflation is less likely to become self-sustaining than broad-based inflation; it reflects specific supply shocks rather than generalised demand pressure.
A two-step check tells you what you need to know:
- How many categories are rising above the threshold? A high share means broad price pressure; a low share means the inflation is concentrated in a few sectors, which is less concerning for policy.
- Is that share increasing or holding stable? A widening share signals inflation is becoming entrenched; a flat or narrowing share signals it is contained.
Diffusion indicators for July are not forecast to reveal any meaningful expansion in the share of categories experiencing elevated price growth. Energy and food are doing the lifting while most other categories remain subdued.
Concentrated vs. broad-based: why the distinction shapes rate decisions
The contrast with 2021-2022 makes the current situation clearer. During that period, diffusion was unusually wide: goods, services, and shelter were all rising simultaneously, with price increases distributed across the majority of CPI categories. That breadth was one of the signals that pushed the Bank toward aggressive tightening.
The structural conditions for sustained inflation require more than a single headline spike: June 2026 data showed that the energy-driven rise toward 4.2% was already partially reversing by month end, with gasoline prices falling roughly 11.5% from their peak and core PCE components remaining contained, reinforcing the distinction between transitory supply shocks and durable demand-driven pressure.
The current configuration is the opposite. Energy rebounds are lifting headline CPI while three-month annualised core measures continued to ease, a pattern of concentrated pressure rather than broad-based inflation. Narrow diffusion means you are looking at a supply shock to a few categories, not a demand-driven acceleration across the economy. That distinction is central to whether rate cuts are appropriate or risky.
What the current configuration signals for Bank of Canada policy
Three conditions, when present simultaneously, shift the policy balance toward continued easing:
- Headline CPI is elevated but the elevation is attributable to energy and food, categories that monetary policy does not directly influence
- CPI-trim and CPI-median are below 2% and below the Bank’s own quarterly projections, signalling underlying price pressure is weaker than the Bank expected
- Diffusion indicators show no broadening of price increases, confirming that inflation is concentrated rather than entrenched
All three are present in the July data. The combination removes the threshold that would justify a pause and leaves the path of least resistance as continued rate cuts, consistent with steering inflation upward toward 2% over time rather than fighting an overheating economy.
“The risk in this configuration is not that inflation will accelerate: it is that rates remain too high for too long relative to where underlying price pressure actually sits.”
The counterargument exists: some researchers have argued that over-reliance on core can occasionally mislead policymakers if the divergence between headline and core persists for an extended period. The Bank’s stated position, however, is that core measures remain the primary guide when headline moves are clearly attributable to identifiable, transitory shocks such as energy price swings.
Energy cost pass-through into core categories complicates the clean headline-core separation that the Bank of Canada relies on: Dallas Fed estimates suggest the 2026 Iran conflict has raised US headline PCE by approximately 0.6 percentage points, with war-driven fuel costs routed through airfares and delivery charges appearing in core figures rather than the energy line.
For you, a Bank of Canada easing bias in this data environment means the burden of proof has shifted. The next data point that would change the calculus is a core overshoot, not a headline spike. The asset classes most directly affected by a continued easing path are longer-duration bonds, interest-sensitive equities, and borrowers exposed to Canadian rates.
Reading the next Canadian CPI release: a practical framework
The analytical hierarchy described in this piece is not specific to the July release. It is a repeatable framework you can apply to every Canadian CPI print going forward, and the sequence matters because it mirrors the Bank’s own analytical process.
- Prioritise core over headline. Look first at CPI-trim and CPI-median, then at headline CPI. These are the numbers most closely aligned with the Bank’s operational reaction function, and they strip out the noise that makes headline readings misleading.
- Benchmark against the Bank’s published MPR projections. Compare the latest core readings to the projections in the Monetary Policy Report. Core consistently below forecast is a dovish signal; core above forecast is a hawkish signal. The gap is the actionable metric.
- Assess breadth via diffusion commentary. Check whether the share of CPI categories with above-threshold price increases is widening or stable. Narrow breadth supports the view that price pressure is concentrated and transitory.
- Treat energy and food moves as noise unless corroborated by core. Large swings in gasoline and grocery prices shift the headline mechanically. Unless they are accompanied by broad, sustained rises in core measures, they do not change the policy outlook.
Applying the framework to the July 2026 data
Step 1 directs your attention to 1.8% and 1.9% core readings rather than the 2.9% headline. Step 2 compares those to the Bank’s 2.0% MPR projection, revealing an undershoot that signals policy is tighter than intended. Step 3 notes flat diffusion indicators with no broadening of price increases. Step 4 identifies gasoline as the energy noise factor and confirms it is not corroborated by core.
The framework resolves what looks like a contradictory data set into a coherent, dovish signal. That puts you on the same analytical footing as the Bank’s own economists, which means you will rarely be wrong-footed by the gap between a headline print and the subsequent policy decision.
For investors wanting to extend this framework into live central bank meeting analysis, our dedicated guide to reading Bank of Canada rate decisions covers how CPI data sequencing within a 48-hour multi-central-bank window reshapes rate pricing before the Bank of Canada speaks, including the specific mechanics of how a prior CPI print resets risk appetite.
When a 2.9% headline is the least important number in the release
The principle is durable: when headline and core diverge, the Bank’s policy path tracks core. Investors who internalise that will consistently read policy signals more accurately than those anchoring on the aggregate CPI print.
In the current easing cycle, core measures running below the Bank’s own projections remove the data threshold that would justify a pause. The path of least resistance remains continued rate cuts until the evidence changes.
The condition that would change it is specific. A sustained rise in CPI-trim and CPI-median back toward or above the Bank’s quarterly 2.0% MPR projection would be the signal that underlying price pressure has returned. A temporary spike in headline CPI driven by energy is not that signal. It never has been.
That is your monitoring trigger going forward: not the next headline number, but the next core reading benchmarked against the Bank’s quarterly forecast.
This article is for informational purposes only and should not be considered financial advice. Investors should conduct their own research and consult with financial professionals before making investment decisions. Past performance does not guarantee future results. Financial projections are subject to market conditions and various risk factors.