
USD/CAD is trading near 1.4215 this morning, days after touching an 18-month high around 1.4295 on 5 October 2026. On the screen, the Canadian dollar’s slide looks like a trend. Rabobank’s strategists read it as an overshoot, and the yield spread that pushed the pair higher has already started to narrow this week.
That gap between the chart and the fundamentals is the signal many traders may be misreading. The near-term USD/CAD outlook now depends on whether that spread keeps compressing or snaps wider again.
Canada’s September jobs report lands today, Friday 9 October 2026, and the result could shift expectations for the Bank of Canada (BoC) decision on 28 October. If you are planning a currency conversion, hedging Canadian assets or holding loonie exposure, reading this pair correctly over the next three weeks has real dollar consequences.
Here is a framework for judging whether this move extends or fades, along with the specific levels and data points that will decide it.
What is driving USD/CAD near 1.42, and is the move an overshoot?
The climb started quietly. On 1 October, the pair touched an 18-month high of 1.4263, and by 2 October, Reuters had it at 1.4257. Five days later it broke higher again.
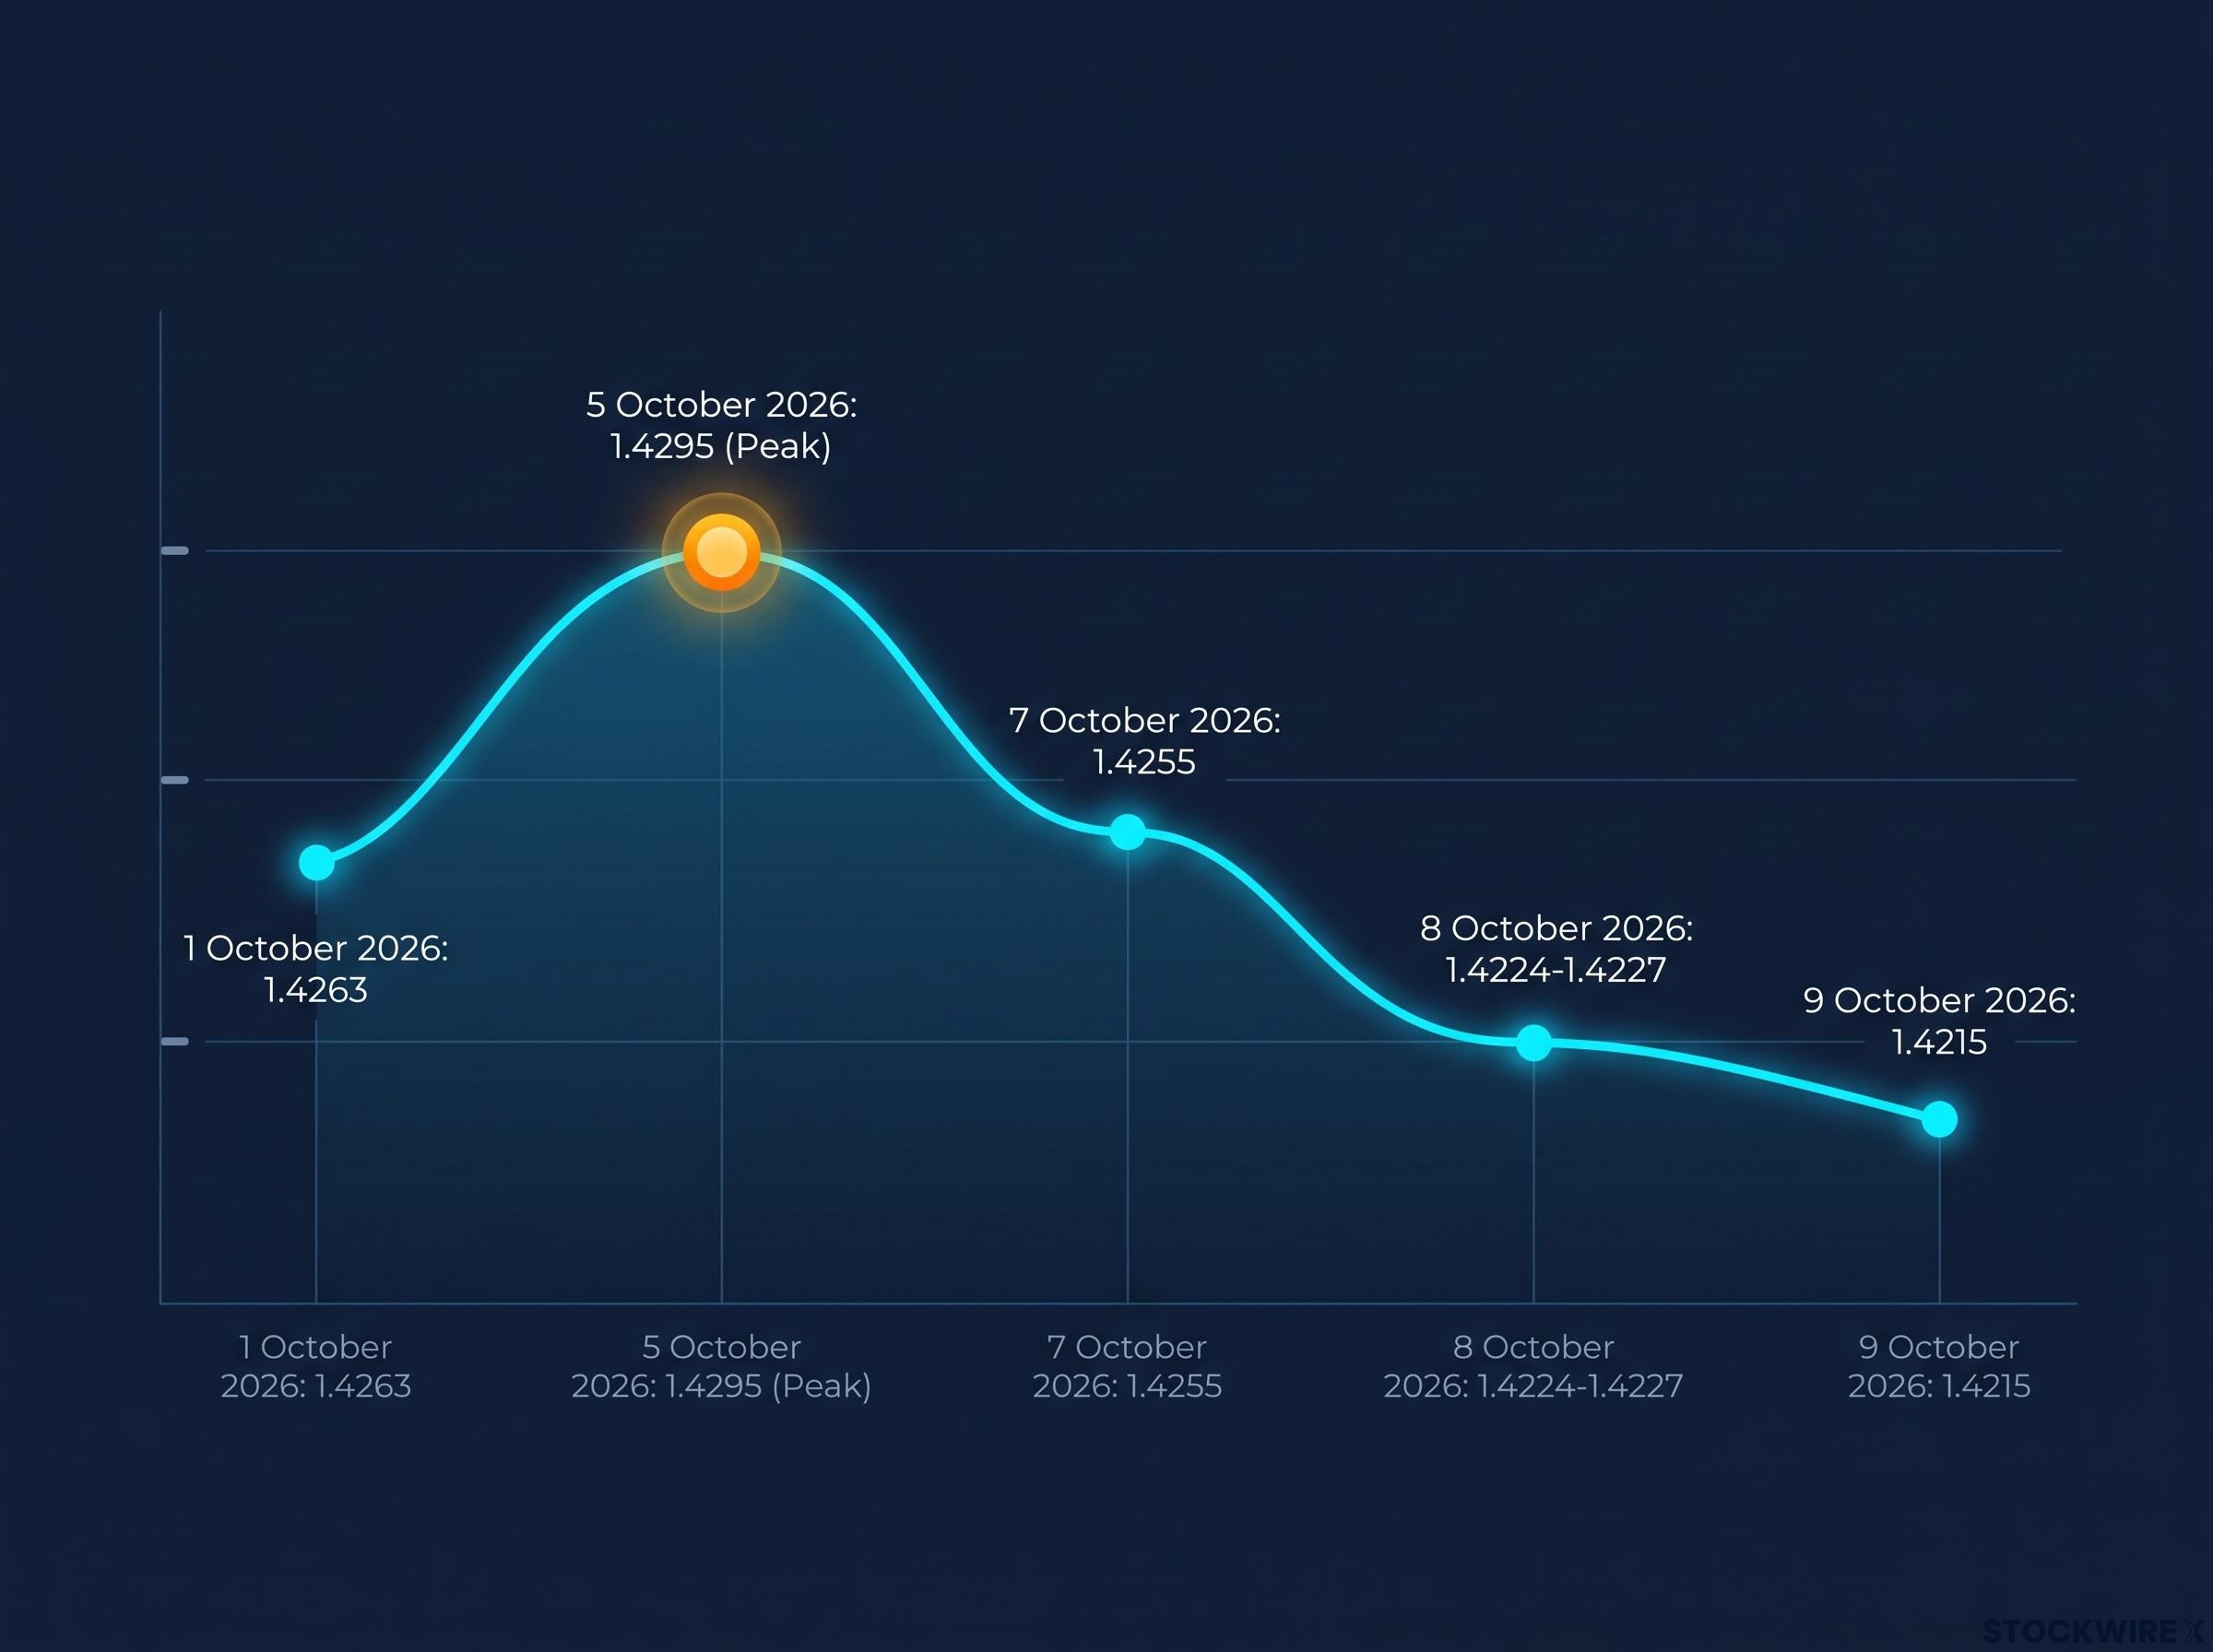
| Date | USD/CAD level | Context |
|---|---|---|
| 1 October 2026 | 1.4263 | 18-month high at the time |
| 5 October 2026 | 1.4295 | Peak; weakest CAD since April 2025 |
| 7 October 2026 | 1.4255 | CAD down 0.3%; range 1.4207-1.4280 (Reuters) |
| 8 October 2026 | 1.4224-1.4227 | Close as spread compressed |
| 9 October 2026 | 1.4215 | Early European trading |
The 5 October peak marked the weakest Canadian dollar since April 2025 and sits at the top of a 52-week range running from roughly 1.348 in January 2026. Where the pair began this leg is less clear. Rabobank puts an early-September trough near 1.376, while other price reviews show the pair trading between 1.414 and 1.424 in late September, so the Rabobank figure is best treated as an early-month low that still needs verification.
The domestic backdrop gave the move fuel. The Globe and Mail reported Canada’s services sector contracted for a fourth straight month, and the August jobs data was weak:
- August: employment down 42,000 (-0.2%), employment rate 60.8%, unemployment 6.4%
- September consensus: employment up roughly 5,000-9,000, unemployment 6.4%-6.5%
What the September jobs report could change
Today’s release covers the survey week of 13-19 September, and results were not available at the time of writing. A beat would ease pressure on the BoC to stay cautious. A miss would reinforce it.
Canadian core inflation measures such as CPI-trim and CPI-median have tracked below the 2% target, so the Bank of Canada may read soft jobs data against a benign inflation backdrop rather than as a trigger for tightening.
The asymmetry matters more than the headline. A pair that climbed this far on soft Canadian data tells you the market has already priced a weak report, so a modest beat could move USD/CAD more than another miss.
When big ASX news breaks, our subscribers know first
Why the US-Canada yield gap matters, and what Waller’s hawkishness adds
The number that matters most this week fell by six points.
Spread watch The US-Canada two-year yield gap narrowed from 158 bps on 5 October, its widest since February 2025, to about 152 bps on 9 October.
A two-year yield spread is the difference between what US and Canadian two-year government bonds pay. A basis point (bp) is one hundredth of a percentage point. When US yields sit well above Canadian ones, global capital earns more by holding US dollars, which pushes USD/CAD higher. Reuters tied CAD losses on 2 October directly to spreads that kept widening.
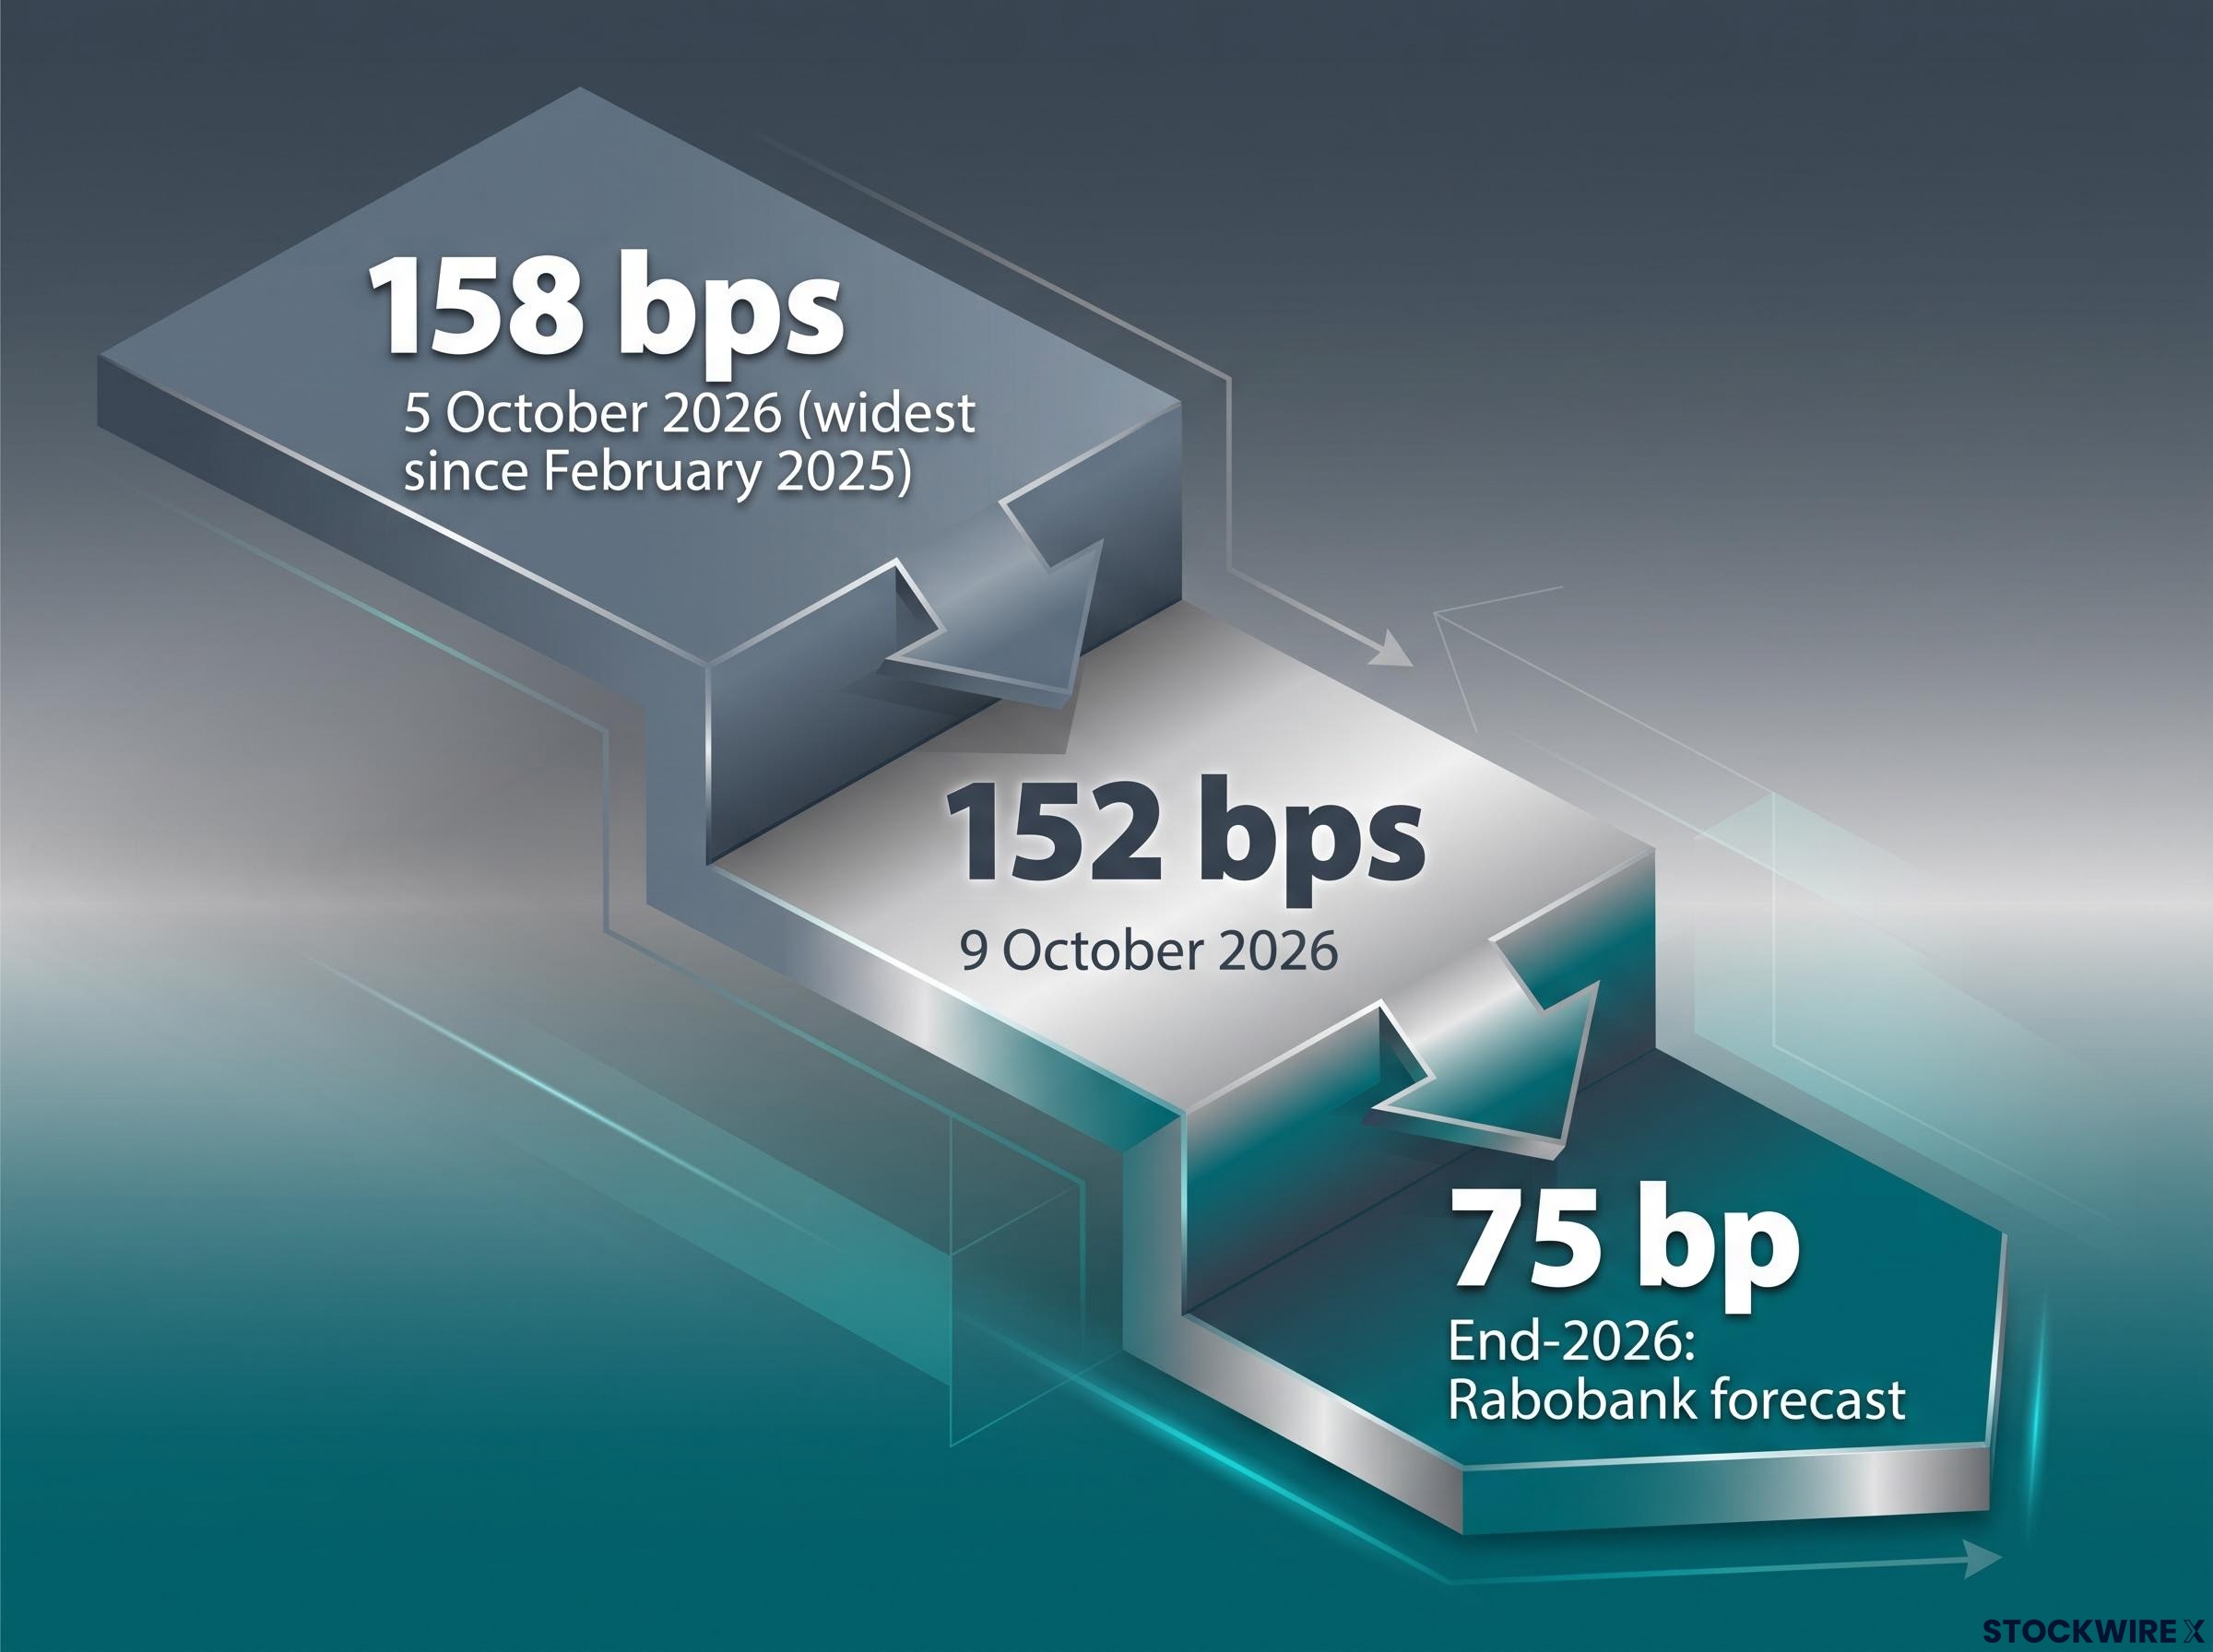
The spread has ranged between roughly 148 and 158 bps in recent months, so the October peak sat at the very top. The compression on 8 October coincided with the pair easing off its high, which is the link you would expect if rate differentials are doing the driving.
Historically, a one-percentage-point widening in Canada-US rate differentials in favour of the US corresponds to roughly 1% depreciation in the Canadian dollar, which is why even a six-point spread compression is worth tracking daily.
What keeps the spread wide is the policy gap between the two central banks:
- Federal Reserve: target range near 3.75-4.00%; Governor Christopher Waller is openly hawkish
- Bank of Canada: overnight rate held at 2.25% on 2 September; the Canadian overnight index swap (OIS) curve, which reflects market bets on future rate moves, still prices further BoC action, according to Rabobank
Waller is the force that could stall compression. He backed further rate increases at a flexible, non-consecutive pace, linked inflation pressure to AI investment and energy shocks, and warned that nearly 5.5 years of above-target inflation risks unanchoring expectations. FXStreet’s Speechtracker scored the speech 8/10 against a 7.2 average, and its Fed Sentiment Index rose 0.42 to 138.34. Given the current range, his stance is best read as hawkish rather than a guide to a specific rate path.
Rabobank expects the differential to narrow from about 150 bp toward roughly 75 bp by end-2026. If you hold CAD exposure, the spread is the single number to track daily, because compression is the most credible route to the pullback Rabobank expects. A Fed that keeps sounding like Waller is what would break that thesis.
How do the Canadian dollar’s core drivers fit together?
When the loonie moves on your screen, it is usually responding to one of four forces. Sorting them is the skill that lets you read the next move without waiting for a headline.
Policy and data
The BoC targets inflation between 1% and 3%. When Canadian rates rise relative to US rates, CAD tends to strengthen; when the BoC eases or uses quantitative easing (buying bonds to push borrowing costs down), CAD tends to weaken. That explains why the current spread weighs so heavily on the pair.
Economic data feeds directly into rate expectations. Strong employment, GDP and business surveys support CAD, while the weak August jobs figures and services contraction helped drag it to its 18-month low.
Oil, trade and sentiment
Oil is Canada’s largest export, so rising crude generally lifts CAD. Reuters cited falling crude alongside wider spreads in CAD losses on 2 October, though no specific WTI price was available in the research.
The US is Canada’s largest trading partner, which ties CAD to global risk appetite. When Donald Trump said on 8 October that the US would not strike Iran before the midterms, it eased one source of safe-haven demand for the US dollar.
| Driver | Direction of effect on CAD | Type | Current status |
|---|---|---|---|
| Tariff premium / USMCA review risk | Negative | Structural | Persistent drag, per Rabobank |
| Fed vs BoC rate gap | Wider gap is negative | Cyclical | Narrowed to 152 bps |
| Oil prices | Higher oil is positive | Cyclical | Recent falls weighed on CAD |
| Risk sentiment | Risk-off is negative | Cyclical | Iran comments eased tension |
The pair also has a quirk. Rabobank describes CAD as the lowest-volatility G10 US dollar cross: it tends to lag the US dollar during safe-haven rushes yet beat most other currencies. Sorting each headline into structural or cyclical tells you whether a move is likely to persist or fade, and the recent spike was driven mostly by cyclical forces.
Where do the technical levels and institutional forecasts point next?
The chart and the strategists disagree, and that disagreement is the most useful thing on the table.
FXStreet’s AI-assisted technical read is bullish while price holds above the 100-day moving average and the middle Bollinger band (the average line inside a volatility envelope). The relative strength index, or RSI(14), sits near 65, close to but below the 70 level often treated as overbought. Key levels, from highest to lowest:
- 1.4355: upper Bollinger band resistance
- 1.4125: Bollinger middle band support
- 1.4015: 100-day moving average support
- 1.3895: lower Bollinger band support
Rabobank, through strategists Molly Schwartz and Christian Lawrence, has taken the other side. Its September update calls the pair overbought on short-term measures and expects a short-lived pullback, then sideways trading between 1.41 and 1.42 through year-end. Its earlier 1.36-1.41 range, set in February and March, has already been outrun, which is a reminder that range calls can be overtaken.
Spot sits above Scotiabank’s fair-value model, which pins equilibrium near 1.4055, so overbought momentum and stretched valuation are arriving together and narrowing the margin of safety for bulls.
| Scenario | Trigger | Level in focus | Likelihood framing |
|---|---|---|---|
| Base case | Spread drifts lower; data mixed | 1.41-1.42 range | Rabobank’s central view |
| Upside USD/CAD | Hawkish Fed surprise, labour weakness, weaker oil, tariff or USMCA shock | Break above 1.4355 | Possible if spread re-widens |
| Downside USD/CAD | Spread compression, Iran de-escalation, strong jobs beat | 1.4125, then 1.4015 | Consistent with an overshoot unwinding |
The next fixed catalyst is the BoC decision and Monetary Policy Report on 28 October 2026. No standalone USD/CAD outlooks from RBC, TD, BMO, CIBC or ING were found, so Rabobank’s view carries outsized weight here. A pair that is technically bullish but fundamentally stretched means you should plan around the 1.4125 and 1.4355 levels rather than bet on a single direction.
Past performance does not guarantee future results. Financial projections are subject to market conditions and various risk factors.
What the spike changes, and the three variables that decide the next leg
The weight of evidence suggests the 1.4295 peak was a stretch inside a sideways range rather than a new regime. The counter-evidence is real, though: soft Canadian data, a hawkish Waller and the pair’s habit of outrunning forecasts.
Three variables will settle it:
- The two-year spread: continued compression from 152 bps supports the pullback case
- Canadian jobs and the BoC on 28 October: today’s report sets the tone for that decision
- Fed rhetoric alongside oil: more Waller-style messaging or weaker crude would push the other way
If those three line up behind compression, the overshoot reading holds. If they split, the levels matter more than the forecast.
Investors weighing the 28 October decision will find our full explainer on the Bank of Canada rate outlook useful, including why TD sees the first move as a January 2027 hike.
This article is for informational purposes only and should not be considered financial advice. Investors should conduct their own research and consult with financial professionals before making investment decisions. These statements are speculative and subject to change based on market developments.