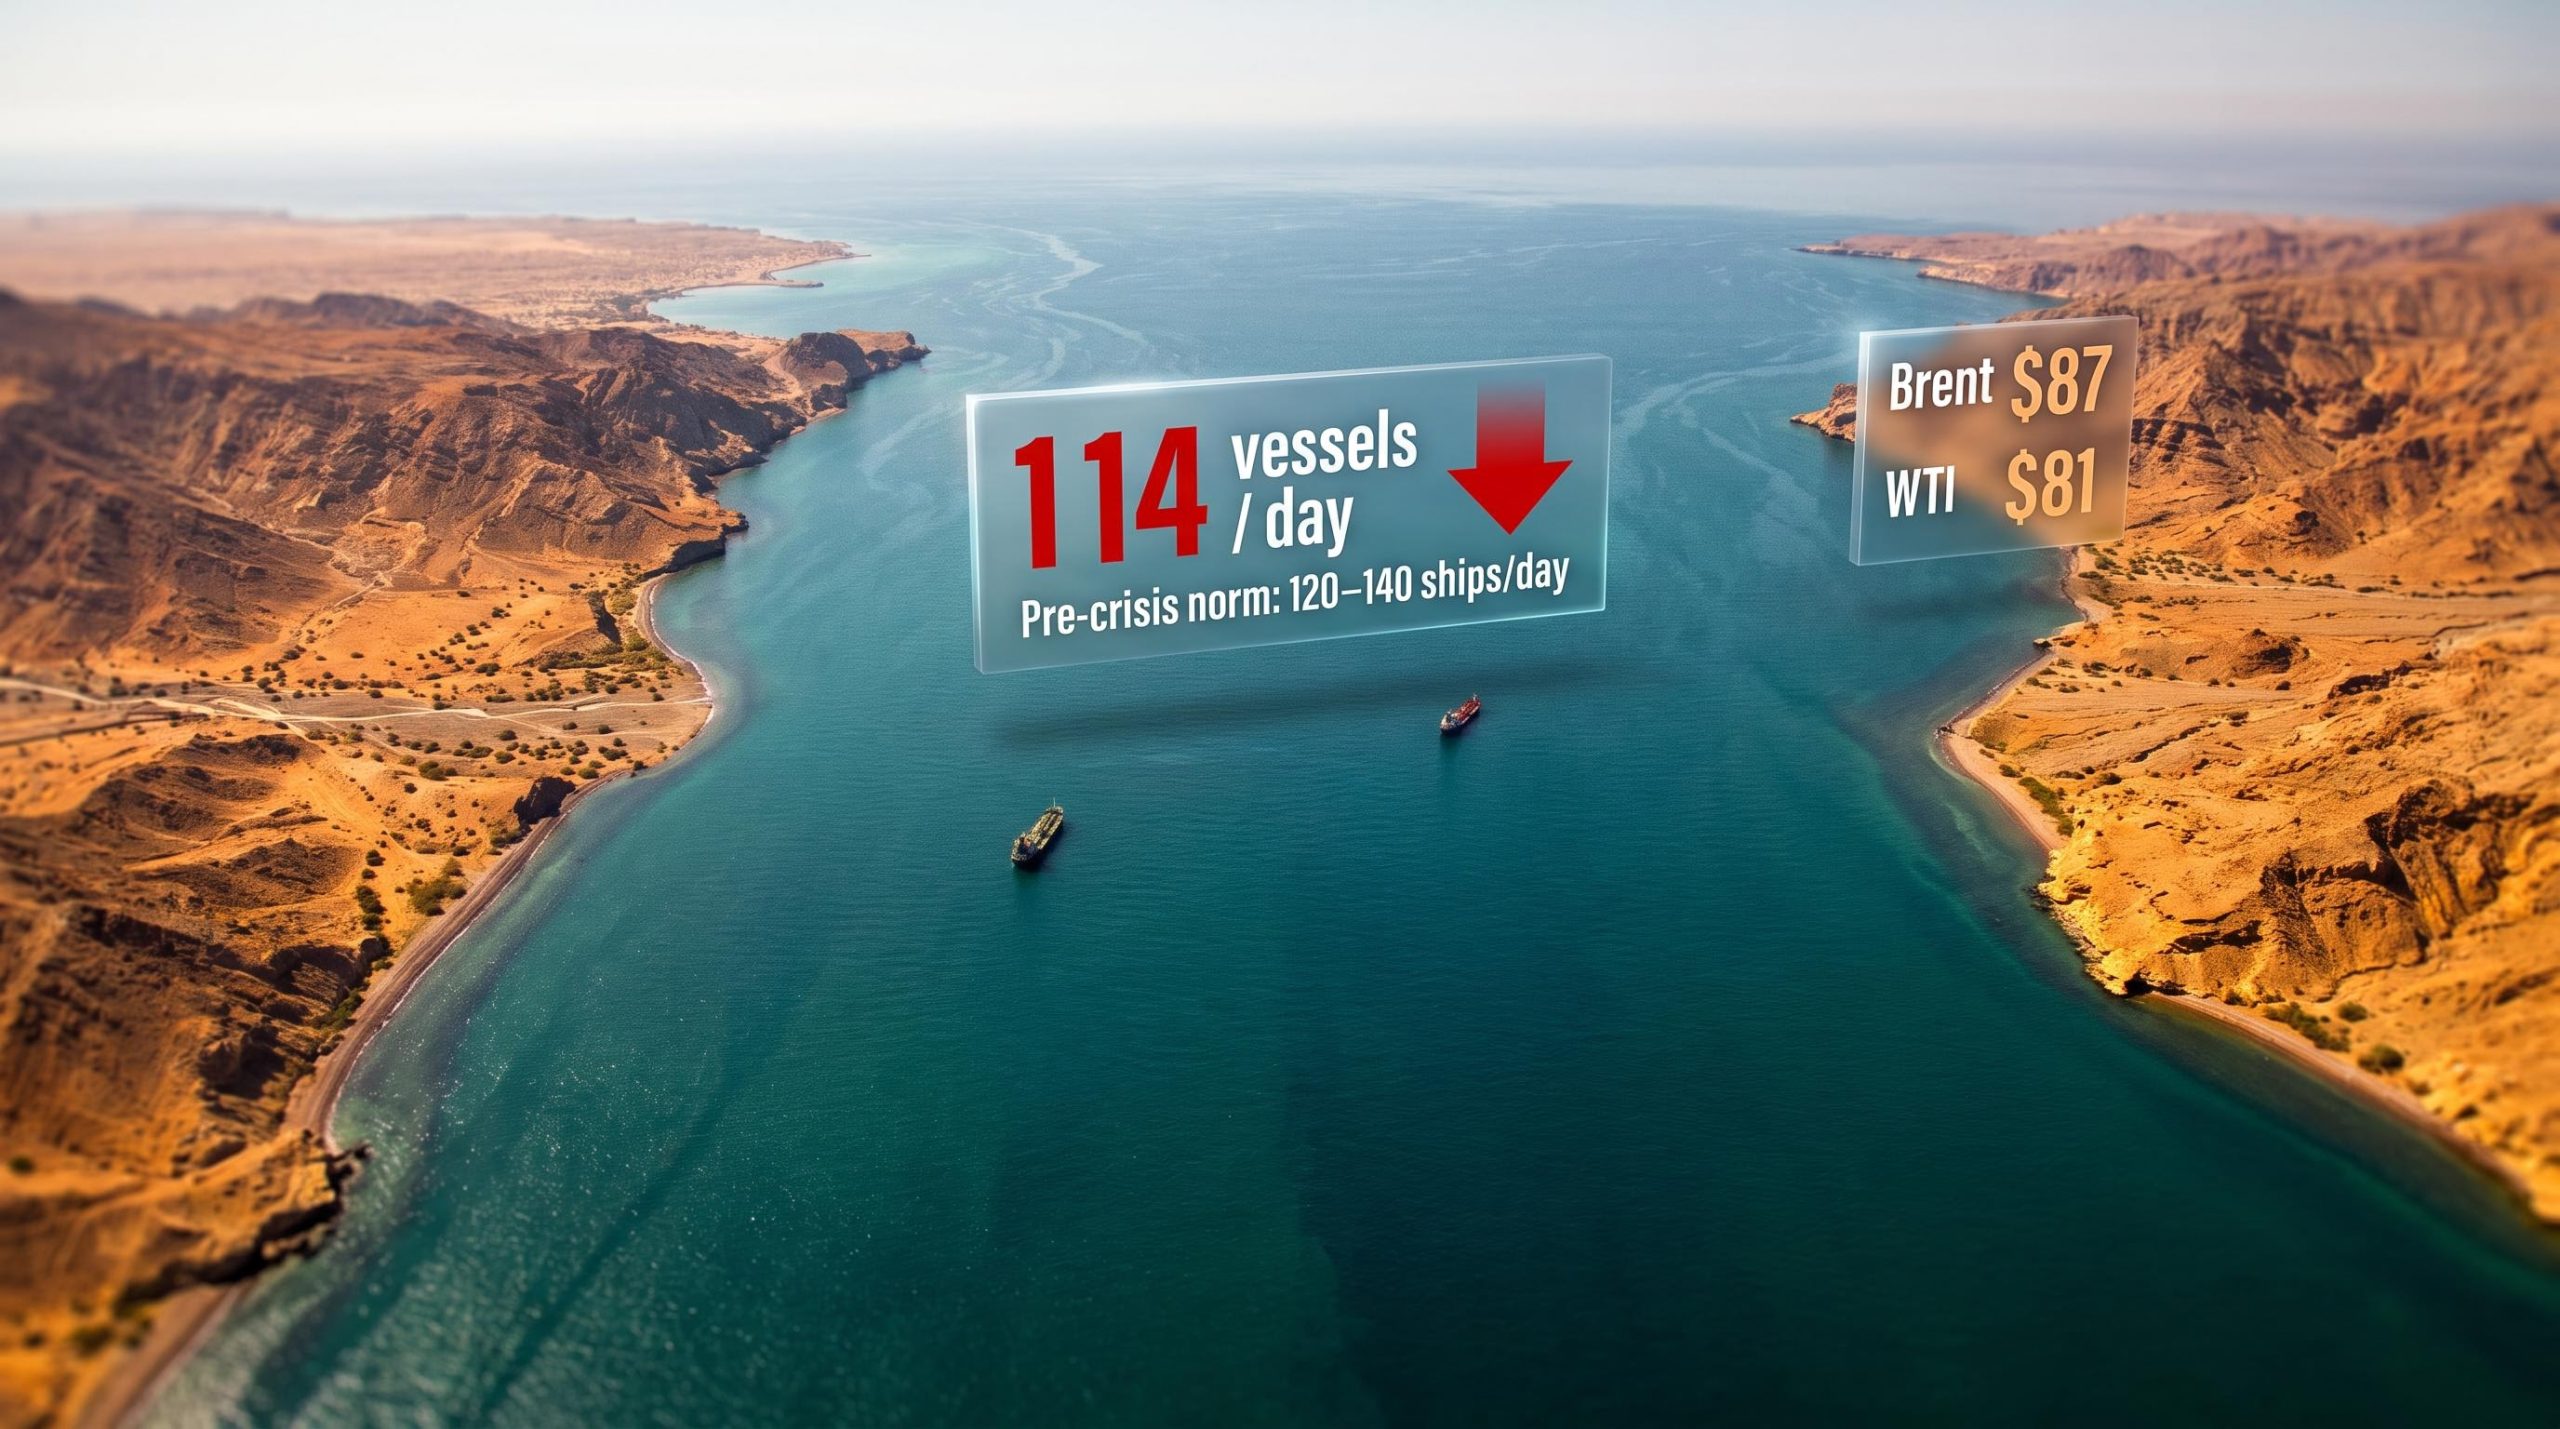
The Strait of Hormuz has been officially declared open. Iran and Oman have agreed on new transit route coordinates, and diplomatic statements describe the waterway as fully accessible. Yet the most recent daily count from mid-August 2026 recorded just 14 vessels making the crossing. The pre-war norm ran at 120-140 ships per day. The headline says resolved. The tanker count says otherwise.
That gap is where the real story lives. Markets do not price diplomatic communiques. They price barrels, and the barrels are not moving. For anyone in the United States paying attention to petrol prices, equity valuations, or what the Federal Reserve does next, misreading this reopening as a resolved situation carries real financial cost.
Here is a framework for understanding exactly how a half-open waterway keeps energy prices elevated, how the cost of that disruption travels from a tanker in the Persian Gulf to a box of cereal in a US supermarket, and why the Federal Reserve’s options for responding are more constrained than most coverage suggests.
The difference between “open” and operational
The diplomatic reopening declaration signals one thing: that parties have agreed on transit coordinates. It does not signal restored commercial traffic, eliminated security risk, or normalised insurance costs. Iran and Oman coordinating on a shipping route is a political achievement. It is not the same as commercial viability.
The distinction matters because three separate groups each apply their own standard for what “open” means, and none of them defer to the diplomatic definition:
- Shipping companies require sustained evidence of safe passage and economically viable charter rates before committing vessels to the route.
- Insurers maintain war-risk premiums based on their own loss models, not on ceasefire announcements, and those premiums remain elevated.
- Maritime security bodies currently rate the strait at SEVERE risk, a designation that directly shapes shipowner decisions regardless of what any government declares.
Analysts note that any agreement on a new route “does not necessarily mean the end of the crisis,” because attacks, blockades, and warnings to avoid the area continue to affect shipowner decisions.
The result is a waterway where 14 vessels transited on the most recent reported day versus a pre-war norm of 120-140. That is roughly 10% of normal commercial throughput. The gap between what officials have announced and what the tanker data show tells you that any crude price relief tied to the reopening declaration is, at best, fragile and premature.
When big ASX news breaks, our subscribers know first
Why the Strait of Hormuz shapes global energy supply unlike any other waterway
Before the 2026 conflict, roughly one-fifth of the world’s oil and gas flowed through this single chokepoint. That concentration is not an accident of geography; it is the product of where the largest hydrocarbon reserves sit and how those reserves reach global markets.
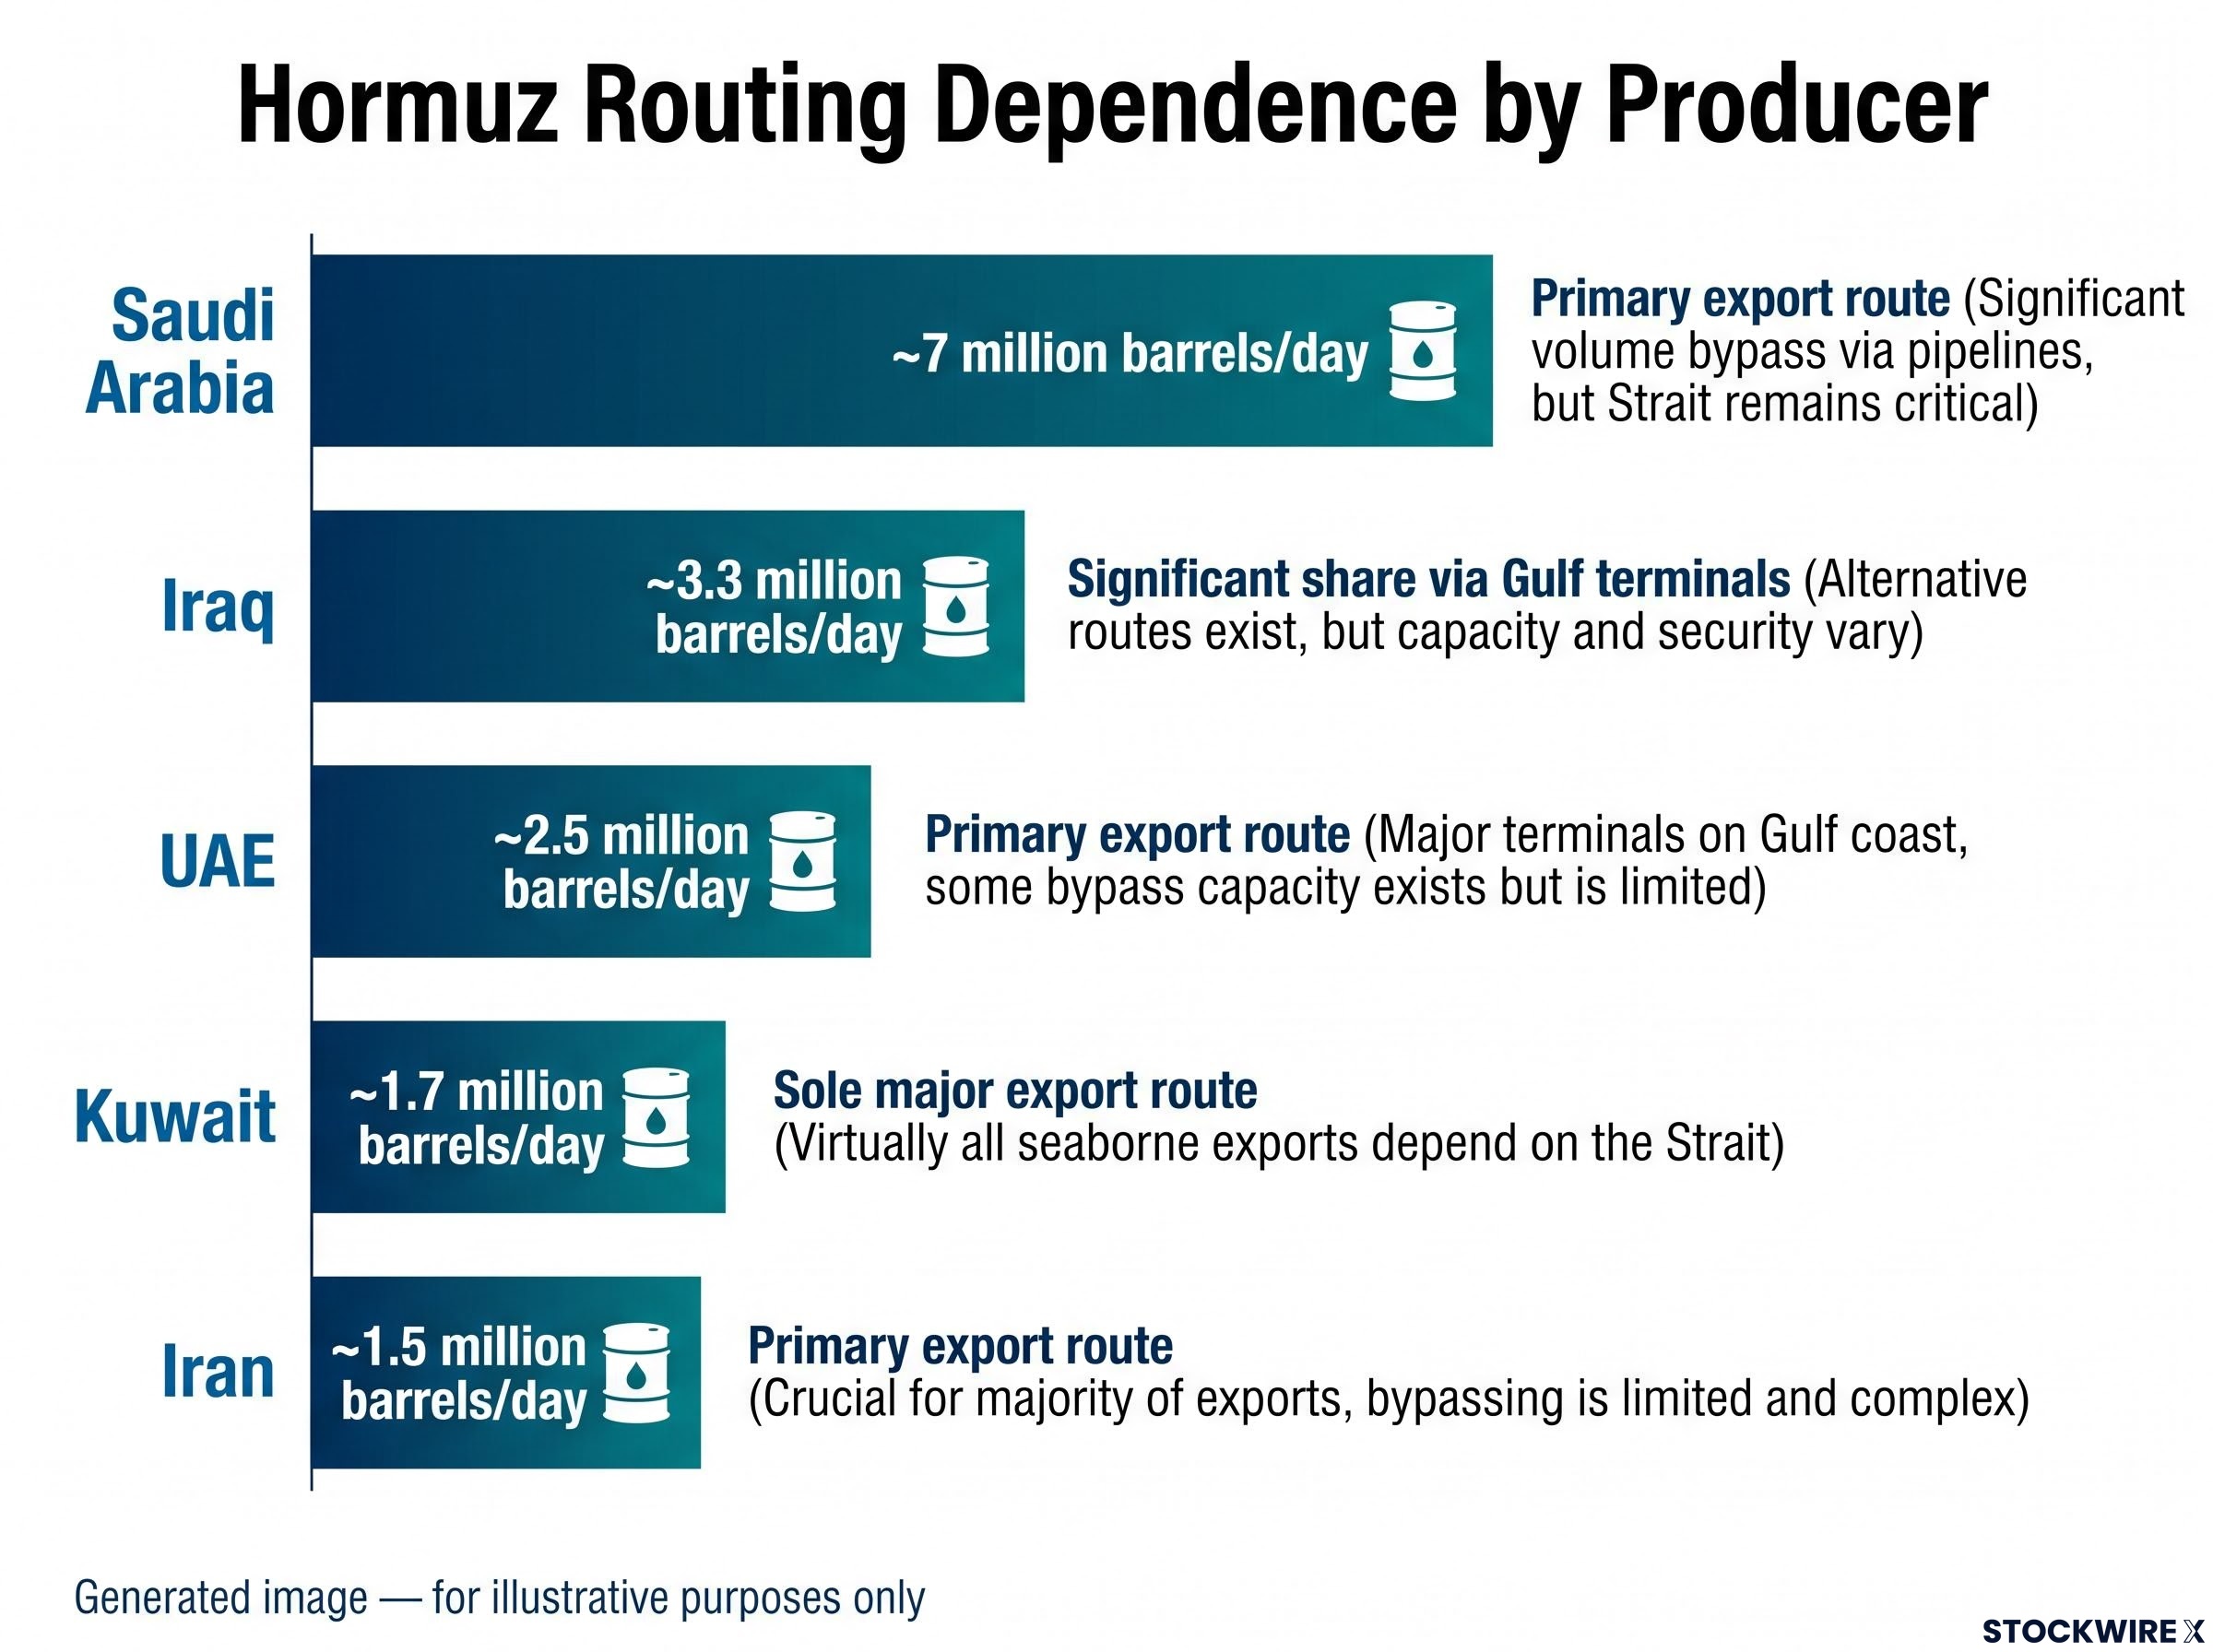
| Producer | Approximate daily oil exports | Hormuz routing dependence |
|---|---|---|
| Saudi Arabia | ~7 million barrels/day | Primary export route |
| UAE | ~2.5 million barrels/day | Primary export route |
| Kuwait | ~1.7 million barrels/day | Sole major export route |
| Iraq | ~3.3 million barrels/day | Significant share via Gulf terminals |
| Iran | ~1.5 million barrels/day | Primary export route |
At the worst points of the crisis, approximately 10 million barrels per day of oil-related flows were affected, representing a more than 90% restriction of normal throughput. No other waterway on earth carries this volume of energy. That is the structural reason why even partial Hormuz disruption registers as a global price event.
Why alternative routes cannot fill the gap
Alternative routing does exist. Pipelines connecting Gulf producers to Red Sea terminals and Mediterranean ports offer some bypass capacity. Overland trucking and strategic reserve drawdowns provide additional, if limited, relief.
But none of these alternatives were designed to absorb a 10-million-barrel-per-day shortfall. Their combined capacity is meaningful in normal conditions and wholly insufficient under crisis conditions. For you as a US reader, this means disruptions to a waterway on the other side of the world translate directly into supply tightness that pushes up the cost of every barrel refined into gasoline, diesel, and jet fuel domestically.
Bypass pipeline capacity through Saudi Arabia’s East-West Pipeline and the UAE’s Habshan-Fujairah route has absorbed a portion of diverted volumes, but both are running at or near full capacity, confirming that the infrastructure workarounds provide a supply floor rather than a replacement for Hormuz throughput.
Three mechanisms keeping crude prices elevated after the reopening
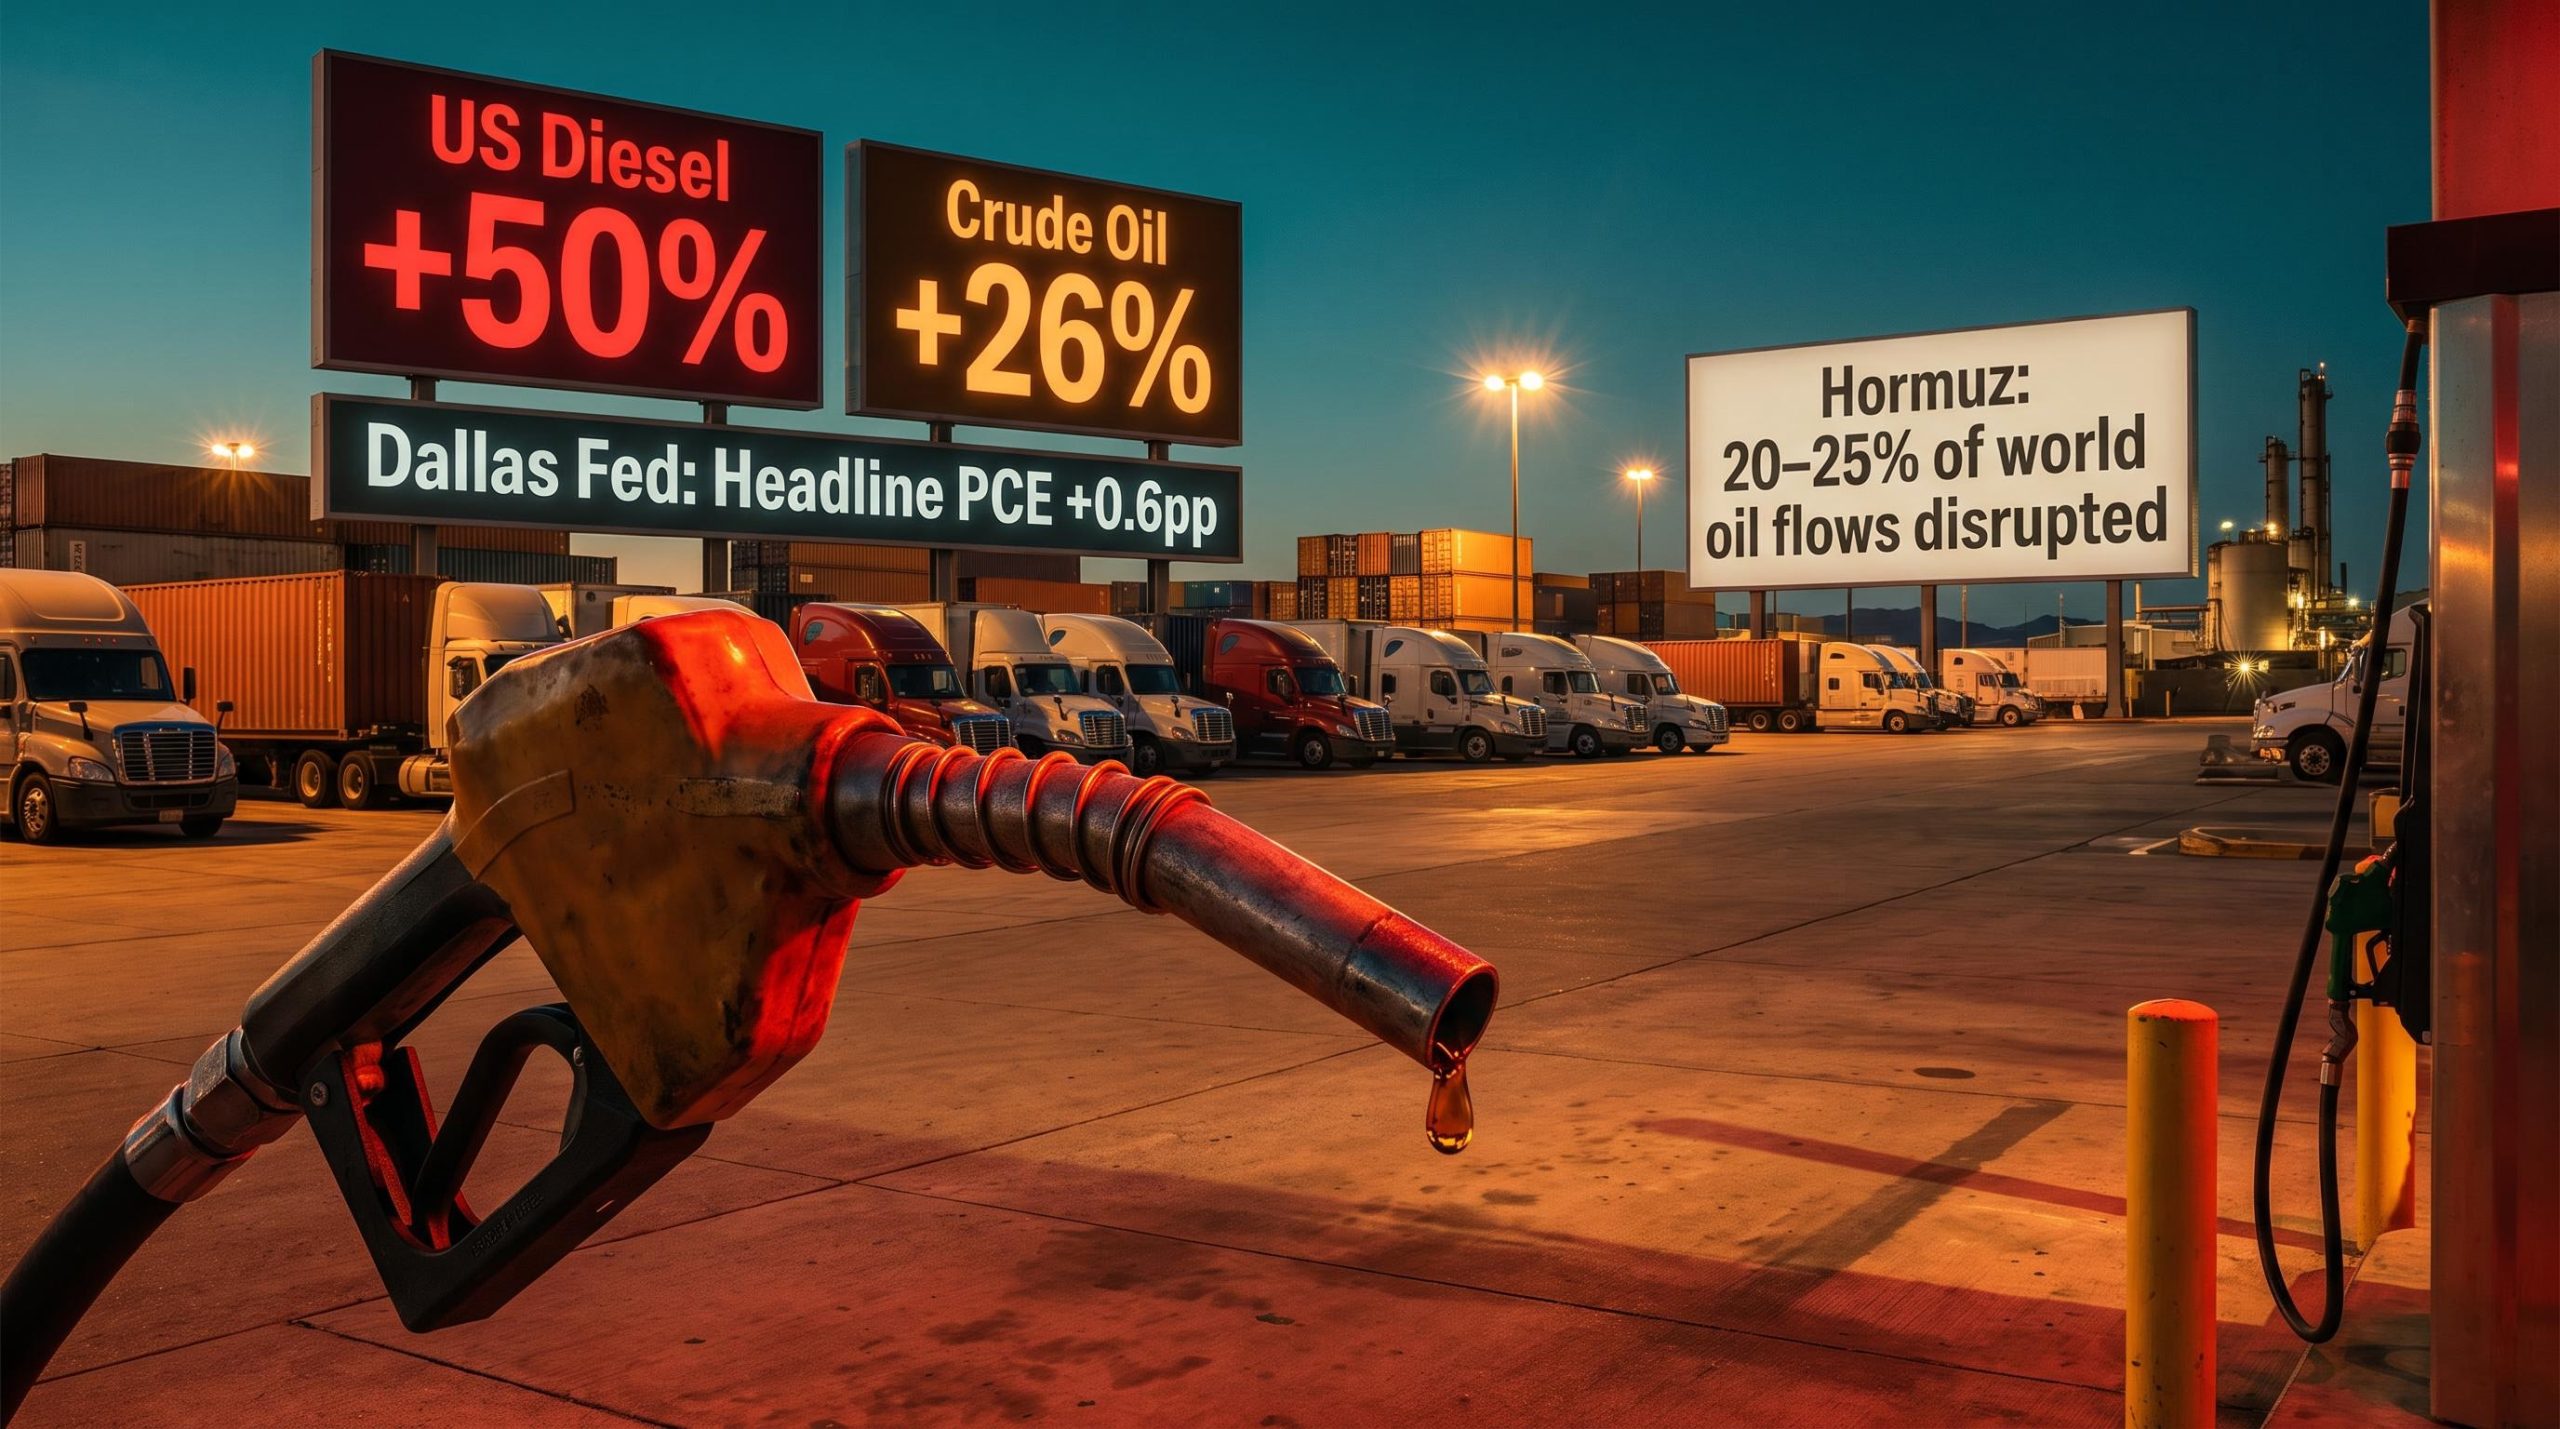
Crude prices have eased from their peaks following the reopening announcement, but they have not returned to pre-crisis levels.
The crude price surge from approximately $70 to above $110 per barrel between late February and mid-May 2026 established the pricing baseline from which current Brent levels represent only a partial retreat, not a resolution.
Brent crude currently sits at approximately $87 per barrel. West Texas Intermediate (WTI) trades at approximately $81 per barrel. Both remain elevated relative to pre-crisis pricing.
Three reinforcing mechanisms explain why, and understanding them as a connected chain rather than separate factors is the key to reading future price moves accurately.
- Physical supply loss. The most direct mechanism. A 10-day average of approximately 11 vessels per day (based on Kpler data cited by Reuters and Al Jazeera) means the physical shortfall is ongoing. Fewer ships means fewer barrels reaching global markets. Diplomatic status is irrelevant to this count.
- Geopolitical risk premium. Traders price the probability of future disruption, not just today’s flow levels. Iran has periodically halted most traffic and threatened non-compliant ships. International agencies have warned operators to avoid Hormuz until safety conditions are established. That uncertainty stays embedded in futures curves as a risk premium over and above what supply-demand fundamentals alone would justify. The SEVERE maritime risk rating sustains this premium regardless of ceasefire language.
- Logistics and insurance recovery lag. Tanker schedules and charter contracts are planned weeks in advance. Once operators reroute ships or suspend voyages, the commercial infrastructure does not snap back when a ceasefire is announced. War-risk insurance premiums in conflict zones rise sharply and take months to fall even after hostilities ease. Elevated premiums can make certain voyages uneconomic, prolonging depressed traffic volumes well after the security situation improves.
The combination of these three mechanisms means that even if tomorrow’s transit count jumped to 50 ships, crude prices would not immediately normalise. The insurance market and the futures risk premium both operate on their own slower timelines. A sustained crude price decline requires progress across all three dimensions simultaneously, not just one diplomatic headline.
How an energy shock travels from the strait to your grocery bill
This is where the Hormuz crisis stops being an oil story and becomes a cost-of-living story. The transmission from a disrupted waterway to higher prices on your supermarket shelf runs through four distinct channels, and each operates on a different timeline.
- Fuel costs: The most visible and immediate channel. Higher crude prices raise gasoline, diesel, and jet fuel costs, which feed directly into headline Consumer Price Index (CPI) readings, the main measure of inflation that tracks what households actually pay.
- Freight and logistics: Most goods in the US move by truck, rail, ship, or air. Costlier diesel and bunker fuel raise freight rates, which appear in producer prices before reaching consumer shelves with a lag.
- Industrial and agricultural inputs: Petrochemicals serve as feedstocks for plastics, fertilisers, and manufacturing materials. Even goods with no obvious energy content carry embedded oil costs that rise when crude does.
- Inflation expectations: If businesses and households anticipate sustained higher energy costs, they pre-emptively raise prices and wages. This risks a self-reinforcing dynamic, which is the scenario central banks are most keen to prevent.
As of August 2026, US headline inflation has not yet returned to the Federal Reserve’s 2% target, and the inflationary effects of the Hormuz-linked energy shock continue to work through the broader economy.
The embedded costs that take longest to show up
The first two channels (fuel and freight) are relatively quick. You notice petrol prices within days. The third channel, petrochemical feedstock transmission, operates with a much longer lag. Plastics, fertilisers, and manufacturing materials carry crude oil cost increases that appear in producer prices before consumers see them, and the delay can be three to six months.
This is the reason energy-driven inflation can persist in core goods categories well after headline crude prices stop rising. Even if crude stabilises at current levels, the price effects from Hormuz are still working through freight costs, manufacturing inputs, and agricultural supply chains. You are not yet seeing the full inflationary impact of this crisis.
Why the Federal Reserve cannot simply fix this with interest rates
The Federal Reserve operates under a dual mandate: achieve 2% inflation and maximise employment. Its primary tool, the federal funds rate (the interest rate at which banks lend to each other overnight, which flows through to mortgage rates, business lending, and broader financial conditions), operates on demand. It cannot reopen a maritime chokepoint or rebuild tanker confidence.
The Fed’s stated inflation target is 2%. Inflation remains above that threshold as of August 2026.
That mismatch creates a genuine policy dilemma, and the two available options each carry distinct risks:
| Scenario | Risk |
|---|---|
| Tighten further (raise rates to counter energy-driven inflation) | Slows an economy whose underlying demand may already be cooling. Risks over-tightening in response to a supply shock the Fed cannot directly fix. |
| Look through the shock (hold rates steady or signal cuts while inflation is above target) | Risks allowing inflation expectations to drift higher, especially if the Hormuz disruption proves persistent rather than temporary. |
Markets are already pricing this tension. Longer-dated US Treasury yields remain elevated, reflecting ongoing inflation risk and keeping the possibility of future rate increases alive. Those higher yields feed directly into equity valuations through higher discount rates on future earnings. They raise mortgage rates and housing affordability costs. They increase government borrowing costs. And they limit the upside potential of non-yielding assets like gold, since elevated yields make interest-bearing alternatives more attractive by comparison.
The Fed’s dilemma is real and unresolved. The tools designed to fight inflation can cause economic damage when the inflation source is a supply disruption abroad rather than domestic demand overheating. For you, whether you hold a mortgage, an equity portfolio, or savings in bonds, this is the mechanism by which a tanker count in the Persian Gulf translates into higher borrowing costs and lower equity valuations at home.
The FOMC dissent recorded at the April 2026 meeting, four members publicly splitting over whether to hold or tighten, is the clearest institutional signal that the Fed’s internal framework for distinguishing a supply shock from demand overheating has not produced consensus.
What sustained normalisation actually looks like from here
No single headline or announcement will confirm the crisis has genuinely eased in economic terms. Normalisation is a multi-indicator problem, and the indicators operate on different timescales from leading to lagging:
- Daily vessel transit counts. The most direct leading indicator. A sustained move toward dozens of ships per day, and ultimately toward the 120-140 historical baseline, would be the clearest signal of real recovery. A brief improvement to 25-40 ships per day during one week in July showed partial recovery is possible, but it was not sustained.
- War-risk insurance and maritime security ratings. A lagging but credible confirmation signal. A downgrade from SEVERE at Lloyd’s or the Joint Maritime Information Centre (JMIC), the body that coordinates maritime threat assessments, toward moderate risk would meaningfully shift shipowner economics and encourage commercial traffic to return.
- Strategic petroleum reserve (SPR) decisions. Whether the US and other major consumers continue drawing on or replenishing their reserves signals how seriously governments view the ongoing supply risk. Active drawdowns indicate the disruption is treated as a live economic threat, not a resolved one.
- Federal Reserve and central bank communication. Whether officials characterise the energy shock as temporary and exogenous versus persistent and inflation-relevant will shift rate expectations across bonds, equities, and currencies. The framing matters as much as the decision itself.
A return toward 120-140 daily transits would signal the commercial market has genuinely recovered, not just that a ceasefire is holding. Current counts of 2-14 vessels per day remain nowhere near that threshold.
Until daily transits move consistently above several dozen per day and war-risk ratings begin to fall from SEVERE, any crude price decline should be read as a temporary relief rally rather than evidence that the supply shock has resolved. Brent at $87 and WTI at $81 are the price levels you would expect to ease as genuine normalisation progresses.
For readers wanting to track exactly when a diplomatic announcement crosses into confirmed market normalisation, our full explainer on Hormuz deal verification signals details the five observable conditions, including mine-clearance timelines and insurance underwriting resumption, that analysts treat as genuine confirmation rather than political signalling.
Watching the right metrics as this story develops through late 2026
The core argument of this article is straightforward: the gap between diplomatic language and commercial reality is where the oil price story, the inflation story, and the Federal Reserve policy story all live simultaneously. Understanding that gap is now a useful financial literacy skill, not just a geopolitical curiosity.
Genuine resolution would require sustained daily transits moving toward the 120-140 baseline, a downgrade in maritime risk ratings from SEVERE, and central bank communication that treats the energy shock as resolved rather than ongoing. As of August 2026, none of those conditions have been met. The 14-versus-120-140 transit contrast tells you where the situation actually stands, regardless of what any diplomatic statement declares.
The Hormuz situation should be treated as a persistent macro input through at least the remainder of 2026, affecting energy costs, inflation dynamics, and Federal Reserve decisions in ways that will not resolve in weeks. The next time a headline announces the strait is open, check the tanker count. That is where the truth of the market sits.
This article is for informational purposes only and should not be considered financial advice. Investors should conduct their own research and consult with financial professionals before making investment decisions. Past performance does not guarantee future results, and forward-looking statements regarding oil prices, inflation, and Federal Reserve policy are subject to change based on market developments and geopolitical conditions.