Fed rate hike odds posted their sharpest single-session dovish move of 2026 on Thursday, and the catalyst was a flat Producer Price Index (PPI) print driven almost entirely by crude oil retreating from conflict-related highs. Whether that repricing reflects genuine macro progress or a misread of the signal is the question markets will spend Friday answering.
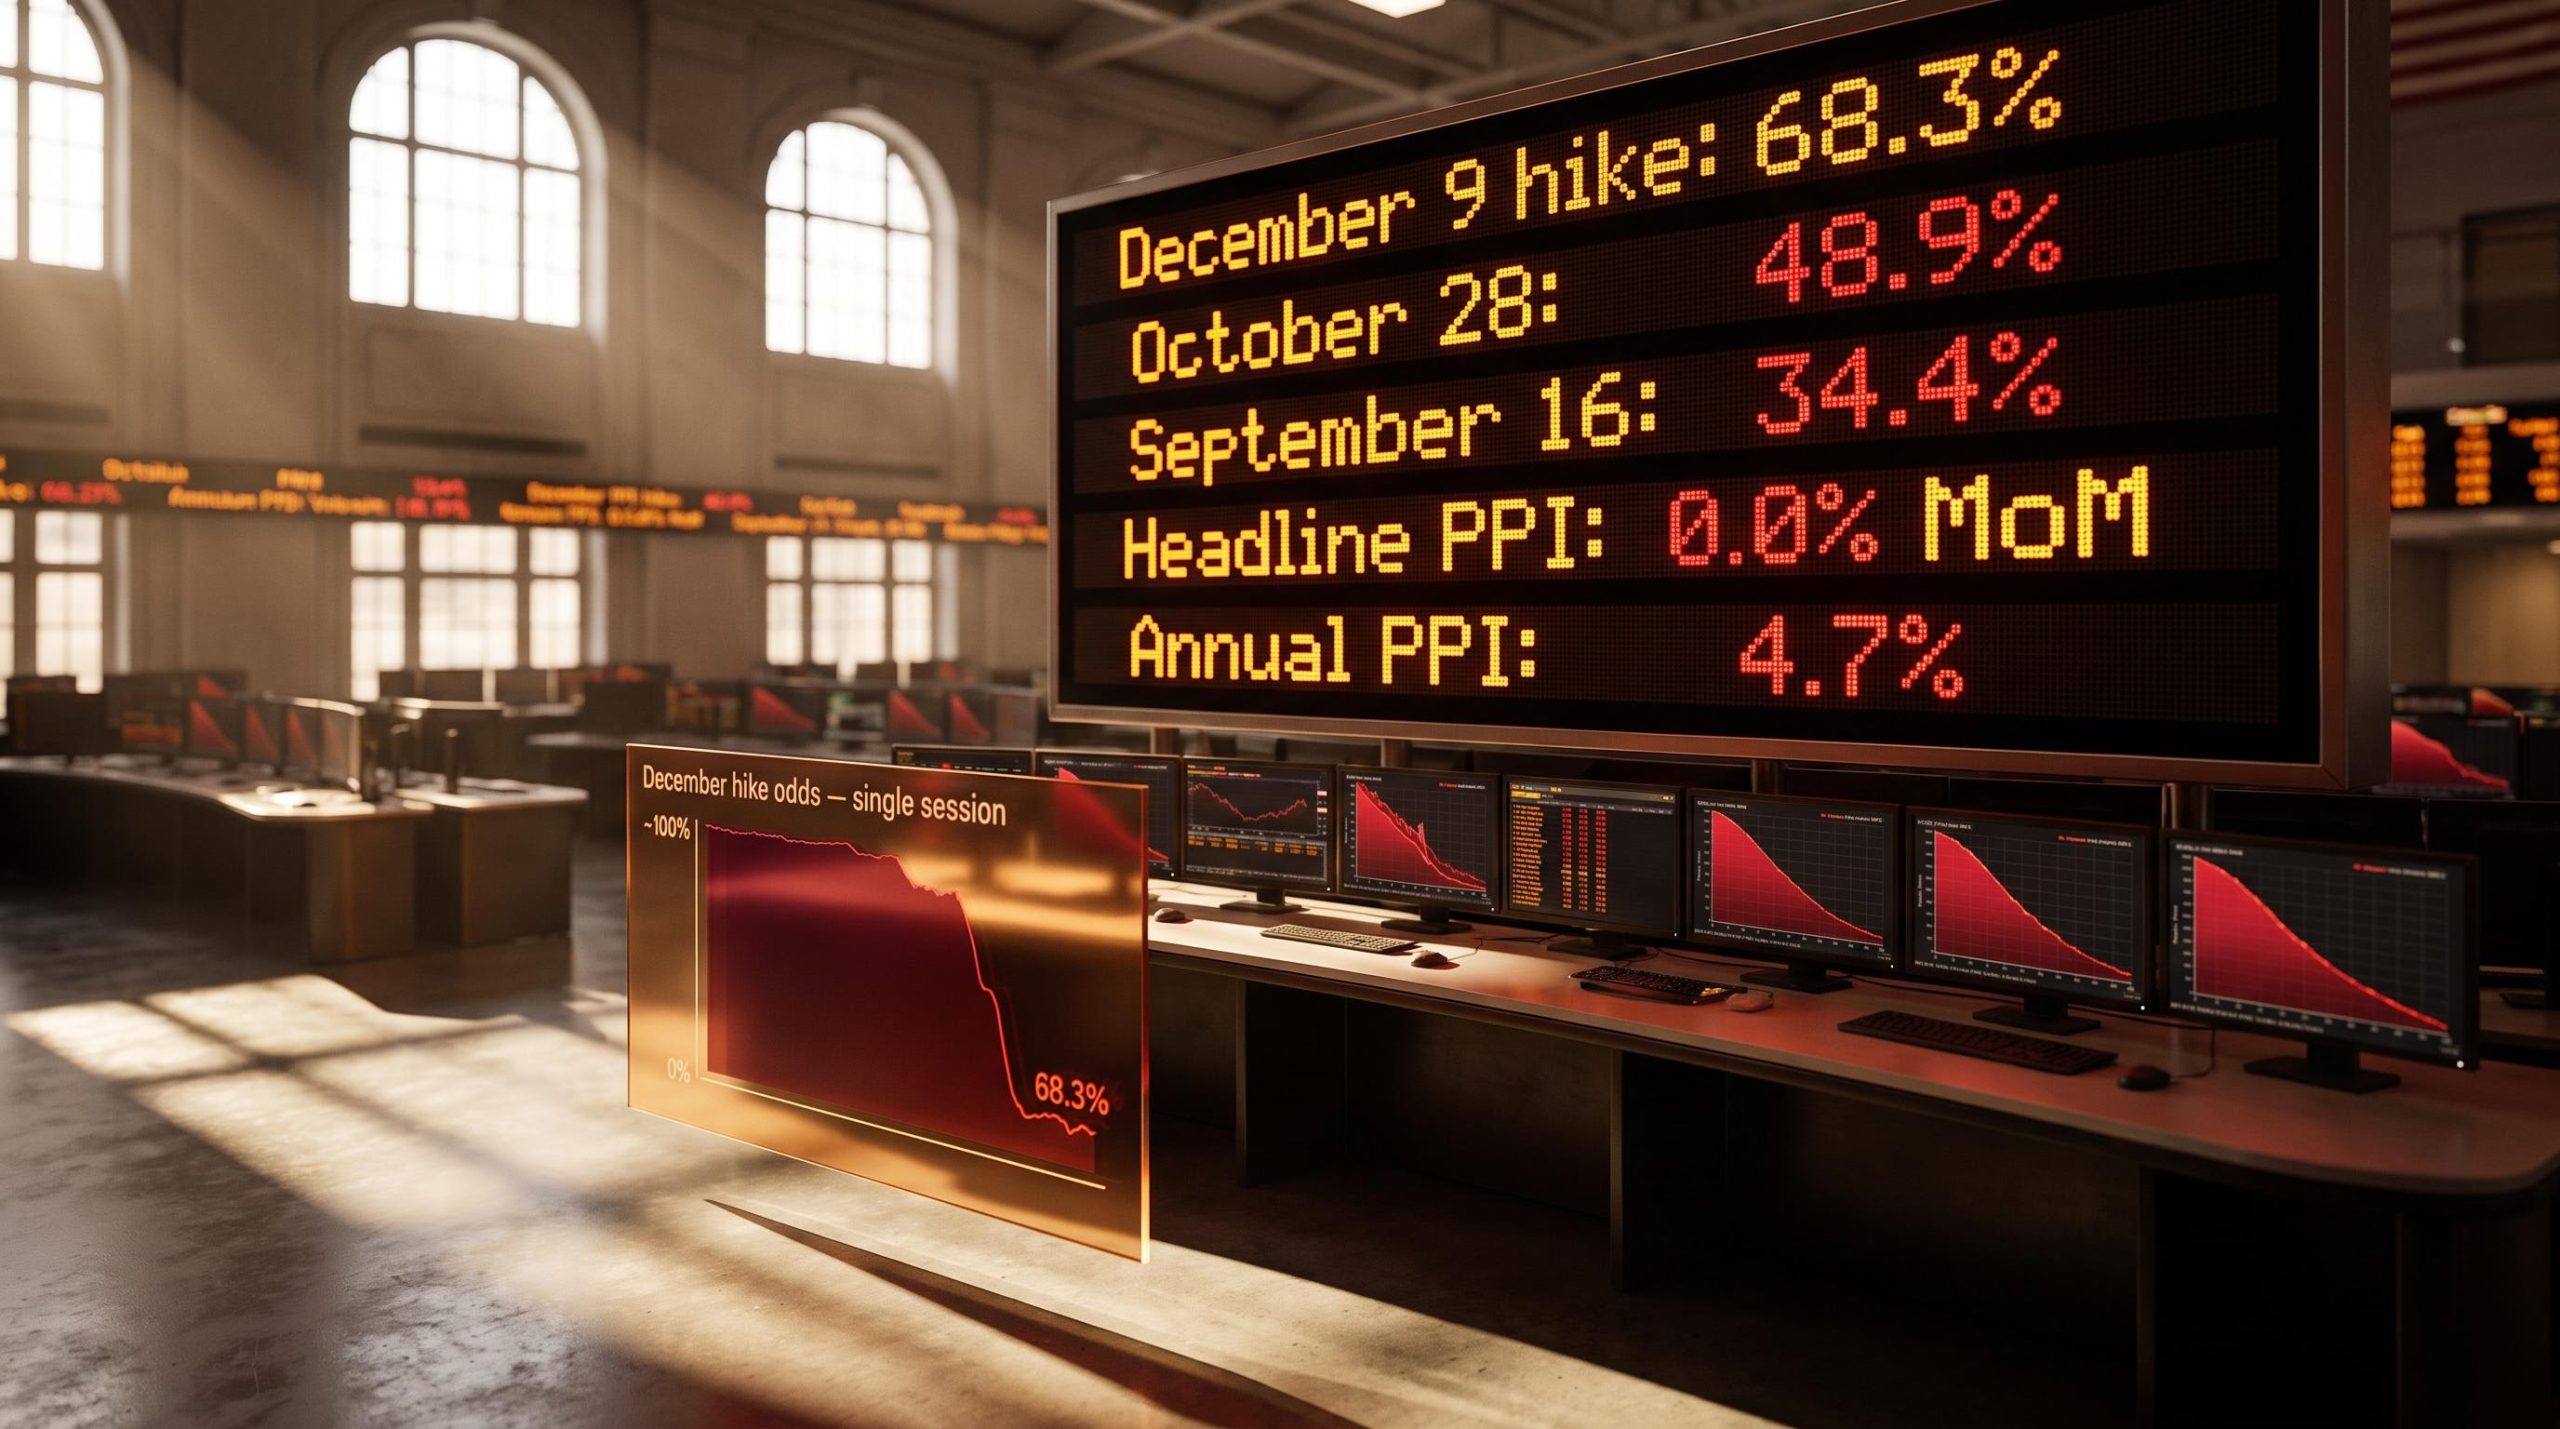
Two inflation releases in three sessions shifted December hike odds from fully priced to 68.3%, dragged September odds from roughly 50% down to 34.4%, and compressed October odds from better than 75% to 48.9%. But annual producer prices still sit at 4.7%, nine of nineteen FOMC members still project at least one additional hike, and Bank of America is calling for three. The market moved fast. The fundamentals did not.
Here is what actually moved in Thursday’s data, why the repricing logic carries a structural flaw, where the Fed’s own signals point, and which of Friday’s two releases carries more weight for the rate path than most traders are giving it credit for.
The dovish repricing in numbers: what futures and prediction markets moved to
The scale of the shift was real. Across a single session, the December 9 hike probability collapsed from fully priced to 68.3%, while September 16 odds were cut to 34.4% and October 28 fell to 48.9% after previously sitting above three-in-four.
But one number barely moved at all. The two-hike probability by December edged from 24.1% to 23.3%, a change so small it barely registers against the scale of the single-meeting moves. That gap tells you the market is not abandoning the hike thesis. It is redistributing timing risk, pushing the expected first move later without materially reducing the odds of a second.
Prediction markets confirmed the directional repricing without contradicting the year-end picture. Kalshi traders pushed hike odds to 57%, up from 35% earlier in the week. Polymarket showed 54.5% implied odds of at least one hike this year.
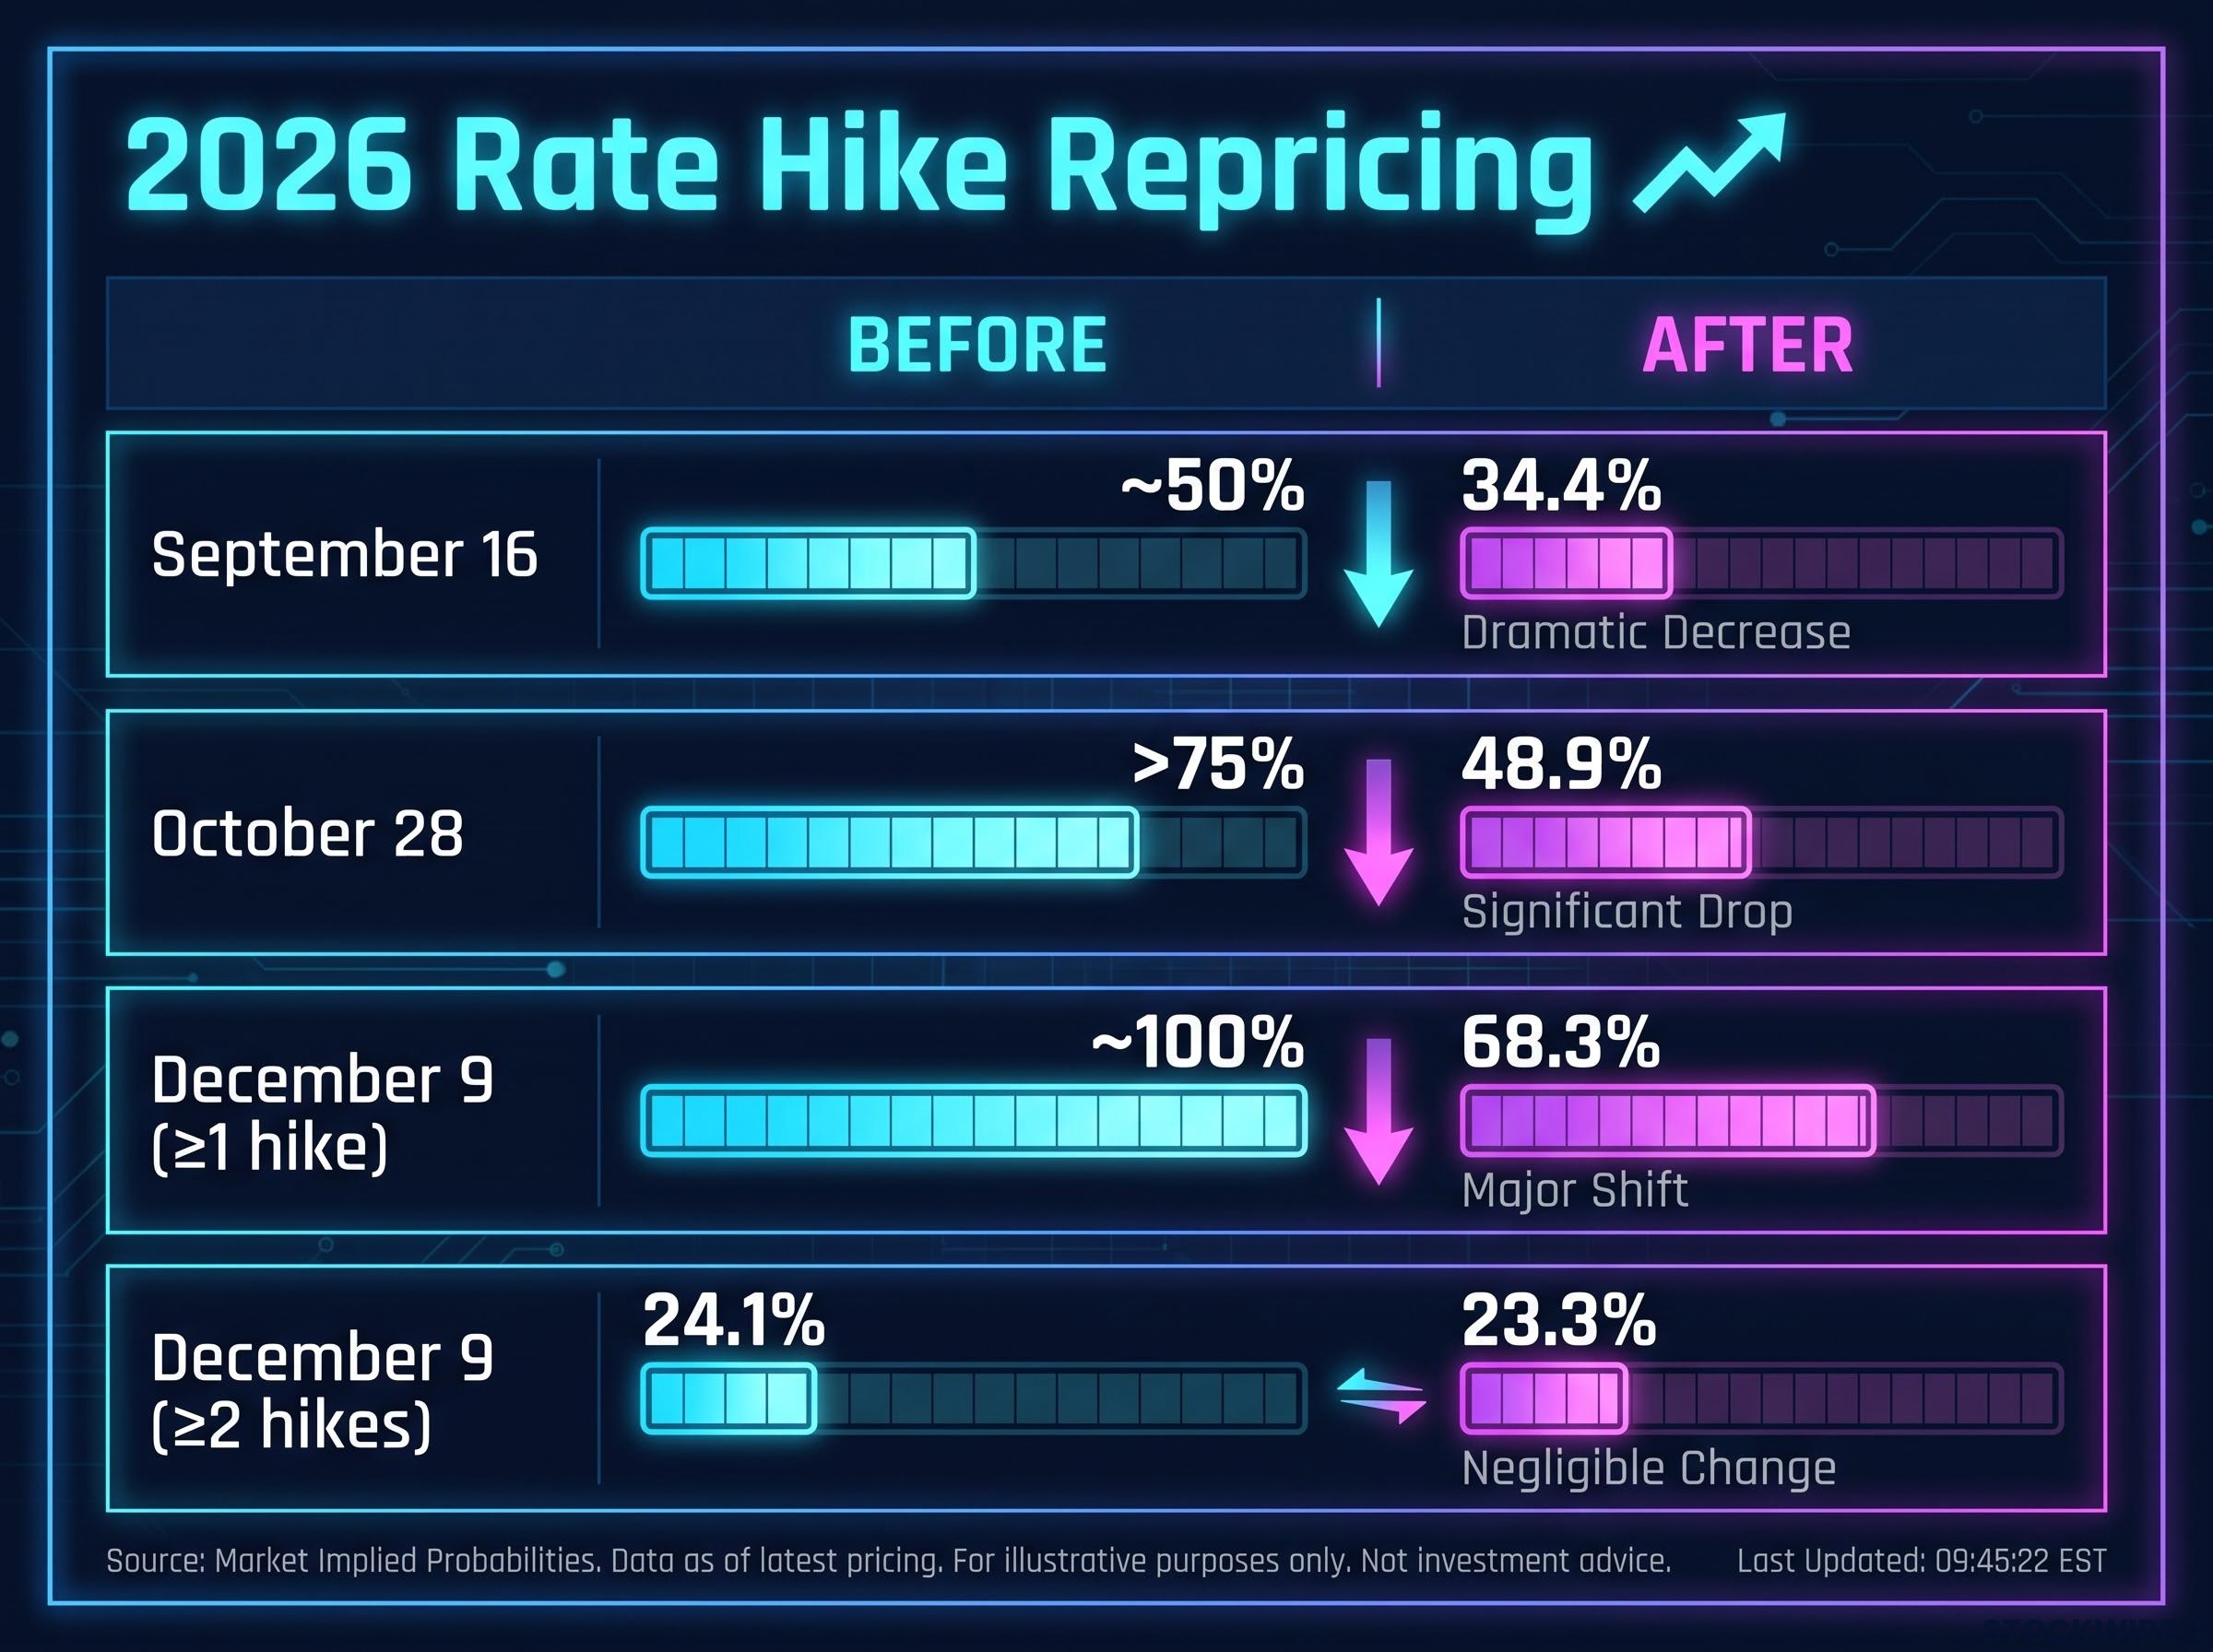
| Meeting / Horizon | Hike Probability Before | Hike Probability After | Change |
|---|---|---|---|
| September 16 | ~50% | 34.4% | -15.6pp |
| October 28 | >75% | 48.9% | -26.1pp+ |
| December 9 (≥1 hike) | ~100% | 68.3% | -31.7pp |
| December 9 (≥2 hikes) | 24.1% | 23.3% | -0.8pp |
Rate cut odds at every 2026 Federal Reserve meeting remained pinned at effectively zero, with the implied probability failing to breach even 1% before the second half of 2027.
If you are reading individual meeting odds in isolation, Thursday looked like a dramatic dovish turn. Read them together, and the signal is timing redistribution, not conviction change.
When big ASX news breaks, our subscribers know first
What the July PPI actually showed, and what it did not
The headline numbers came in soft:
- Headline PPI: 0.0% month-over-month versus +0.2% consensus
- Core PPI: +0.2% month-over-month versus +0.3% consensus
- Headline PPI year-over-year: 4.7%
- Core PPI year-over-year: 4.2%
The sequential miss was clear. The year-over-year context told a different story. Both annual readings remain well above the Fed’s policy target and incompatible with any meaningful pause narrative.
The July print follows a pattern already visible in June wholesale price data, where a headline monthly decline coexisted with core PPI holding at 4.7% year-over-year, reinforcing the recurring interpretive problem of reading monthly PPI moves without anchoring them to the annual trend.
Why crude oil retreating is not the same as disinflation
The weakness in July producer prices had a single identifiable driver: oil prices giving back the premium they had accumulated on conflict risk. Brent was trading near $87 per barrel, approximately 2% lower than the prior month when it had been printing above $100. WTI sat just above $81.
This is a pattern markets have seen before in this cycle. When crude spiked on geopolitical risk earlier, September hike odds surged to approximately 82%. When crude pulled back, odds eased. Energy-driven PPI softness is transient by nature unless accompanied by broader goods and services price moderation, and the July data showed no evidence of that broader shift.
The Fed historically looks through energy-driven PPI swings, and for good reason. When a soft PPI print can be traced directly to falling crude prices, the inflation signal belongs to the geopolitics, not the macro backdrop. Accepting it as genuine disinflation also requires a view that oil prices remain suppressed, and forecasting that is a Strait of Hormuz judgement call, not a monetary policy one.
How producer prices work and why the year-over-year figure is the one that matters
The PPI measures upstream price pressures across final demand goods, services, and construction. These are the prices producers pay before they reach you as a consumer, and they tend to feed into consumer-level inflation over a lag of weeks to months.
Reading it correctly means understanding a hierarchy:
- What PPI measures: Input costs across the economy’s production chain, from raw materials to finished goods at the wholesale level.
- Why monthly figures carry more noise: A single month’s reading is heavily influenced by energy swings, seasonal effects, and commodity volatility, exactly the kind of distortion the July print demonstrated.
- How annual figures reflect the trend the Fed is tracking: Year-over-year readings smooth those monthly distortions and reveal the persistent inflation trajectory that drives policy decisions.
- What 4.7% annual implies for the current stance: With the federal funds rate target at 3.50%-3.75% and headline PPI running at 4.7%, the committee is confronting what Reuters has characterised as a “five-year-long inflation problem.”
When headline PPI sits 4.7% above year-ago levels, the Fed is not looking at a flat monthly print and concluding the work is done. You should apply the same interpretive discipline before treating Thursday’s release as a turning point.
What the Fed is actually signalling versus what markets are pricing
At 12:15 GMT, roughly quarter of an hour before the PPI release, a voting regional Fed president delivered public remarks advocating for rate rises now rather than at a later date. Those comments scored 8.2 on the hawkish scale, above the 7.3 average for that speaker’s slot. The data landed at 12:30 GMT, meaning the dovish repricing was running directly against live Fed communication.
The June dot plot reinforced the committee’s internal lean. Nine of 19 FOMC members projected at least one hike, with six of those expecting more than one 25 basis point increase. A single month of softer PPI, especially an energy-driven one, is unlikely to shift a committee that has already signalled willingness to tighten further.
The June dot plot split exactly nine to nine between officials favouring further hikes and those favouring no change, a division that a single month of energy-driven PPI softness is structurally unlikely to resolve.
The institutional forecast landscape remains genuinely split:
- Bank of America: three hikes in 2026, the most hawkish institutional call currently on the table
- Reuters baseline: no change, but 66% of respondents describe hike risk as “high”
- Oxford Economics: a 2026 hike remains “very unlikely”
Bank of America has pencilled in three rate increases across 2026, placing it at the most aggressive end of the institutional forecast spectrum and marking a notable shift from its earlier no-change baseline.
A voting Fed official explicitly calling for immediate rate action 15 minutes before a soft PPI print does not make that official’s view obsolete. It makes the market’s dovish overreaction to the PPI more legible as a short-term positioning move rather than a durable reassessment.
Why Friday’s University of Michigan survey matters more than retail sales for the rate path
Friday brings two releases. Most traders will lead with the first one. The second carries more weight for the rate path.
- Retail sales at 12:30 GMT: Headline consensus +0.1% month-over-month (prior +0.2%); ex-autos +0.2% (prior -0.2%); control group prior +0.5%
- University of Michigan consumer sentiment at 14:00 GMT: Preliminary August consensus 54.5 (prior 55.2); one-year inflation expectations last at 4.2%; five-year expectations last at 3.3%
The Michigan headline sentiment number is largely reflected in current pricing and has little direct bearing on where rates go next. The inflation expectations sub-components are where the genuine rate path signal lives.
What the inflation expectations components are actually measuring
The headline Michigan index is a composite of how consumers feel about current conditions and the broader economy. The inflation expectations questions are separate: they ask respondents directly what they expect prices to do over the next year and the next five years. The Fed has explicitly cited these Michigan inflation expectations readings in FOMC minutes as a benchmark for assessing whether longer-term expectations remain anchored.
Weekly jobless claims came in at 209,000 against a 202,000 consensus on Thursday, pointing to some softening on the employment side of the mandate, but labour market data is secondary to the expectations question at this stage of the cycle.
If Friday’s Michigan survey shows one-year inflation expectations holding at 4.2% or rising, the dovish repricing from Thursday’s PPI miss becomes significantly harder to sustain. The Fed’s greatest fear in this cycle is not one soft month of producer prices. It is a public that stops believing inflation will fall.
What it takes for this repricing to hold versus what would reverse it
Thursday’s dovish shift is a conditional bet, not a settled conclusion. Two conditions would make it durable:
- Crude oil stabilises at current levels or lower through the August and September CPI releases, allowing energy’s disinflationary effect to persist into the next round of data.
- Friday’s Michigan expectations data shows inflation expectations stable or falling from the 4.2% one-year and 3.3% five-year readings.
Two triggers would rapidly unwind it:
- A Strait of Hormuz escalation pushing crude back above $100, reversing the energy channel that drove Thursday’s PPI softness.
- Michigan one-year expectations rising from 4.2%, signalling that the public’s inflation outlook is drifting further from the Fed’s target.
The Strait of Hormuz remains the single biggest structural variable in the 2026 rate outlook. If the waterway stays open, the case for no hike this year strengthens; if passage stays restricted, two hikes become the base case. What looks like a macro repricing is largely a bet on geopolitical and data-flow outcomes, not a settled view of the economic trajectory.
Strait of Hormuz supply risk is not a binary open-or-closed variable: tanker crossings fell to as few as five per day in early July 2026 against a baseline of 80-100, and that partial disruption was sufficient to sustain an energy premium well above what aggregate global supply-demand models would predict.
The repricing is only as durable as oil prices and inflation expectations hold. Positioning around it without a view on both of those variables is directional risk masquerading as a macro call. Friday’s data will tell you which leg of the bet is most at risk.
The positioning implications extend beyond the rate futures market: rate-sensitive equity sectors and long-duration growth names carry asymmetric downside if Michigan expectations data Friday reinforces the case for additional tightening, given that the equity risk premium has already compressed toward post-2007 lows.
This article is for informational purposes only and should not be considered financial advice. Investors should conduct their own research and consult with financial professionals before making investment decisions. Past performance does not guarantee future results. Financial projections are subject to market conditions and various risk factors.
—