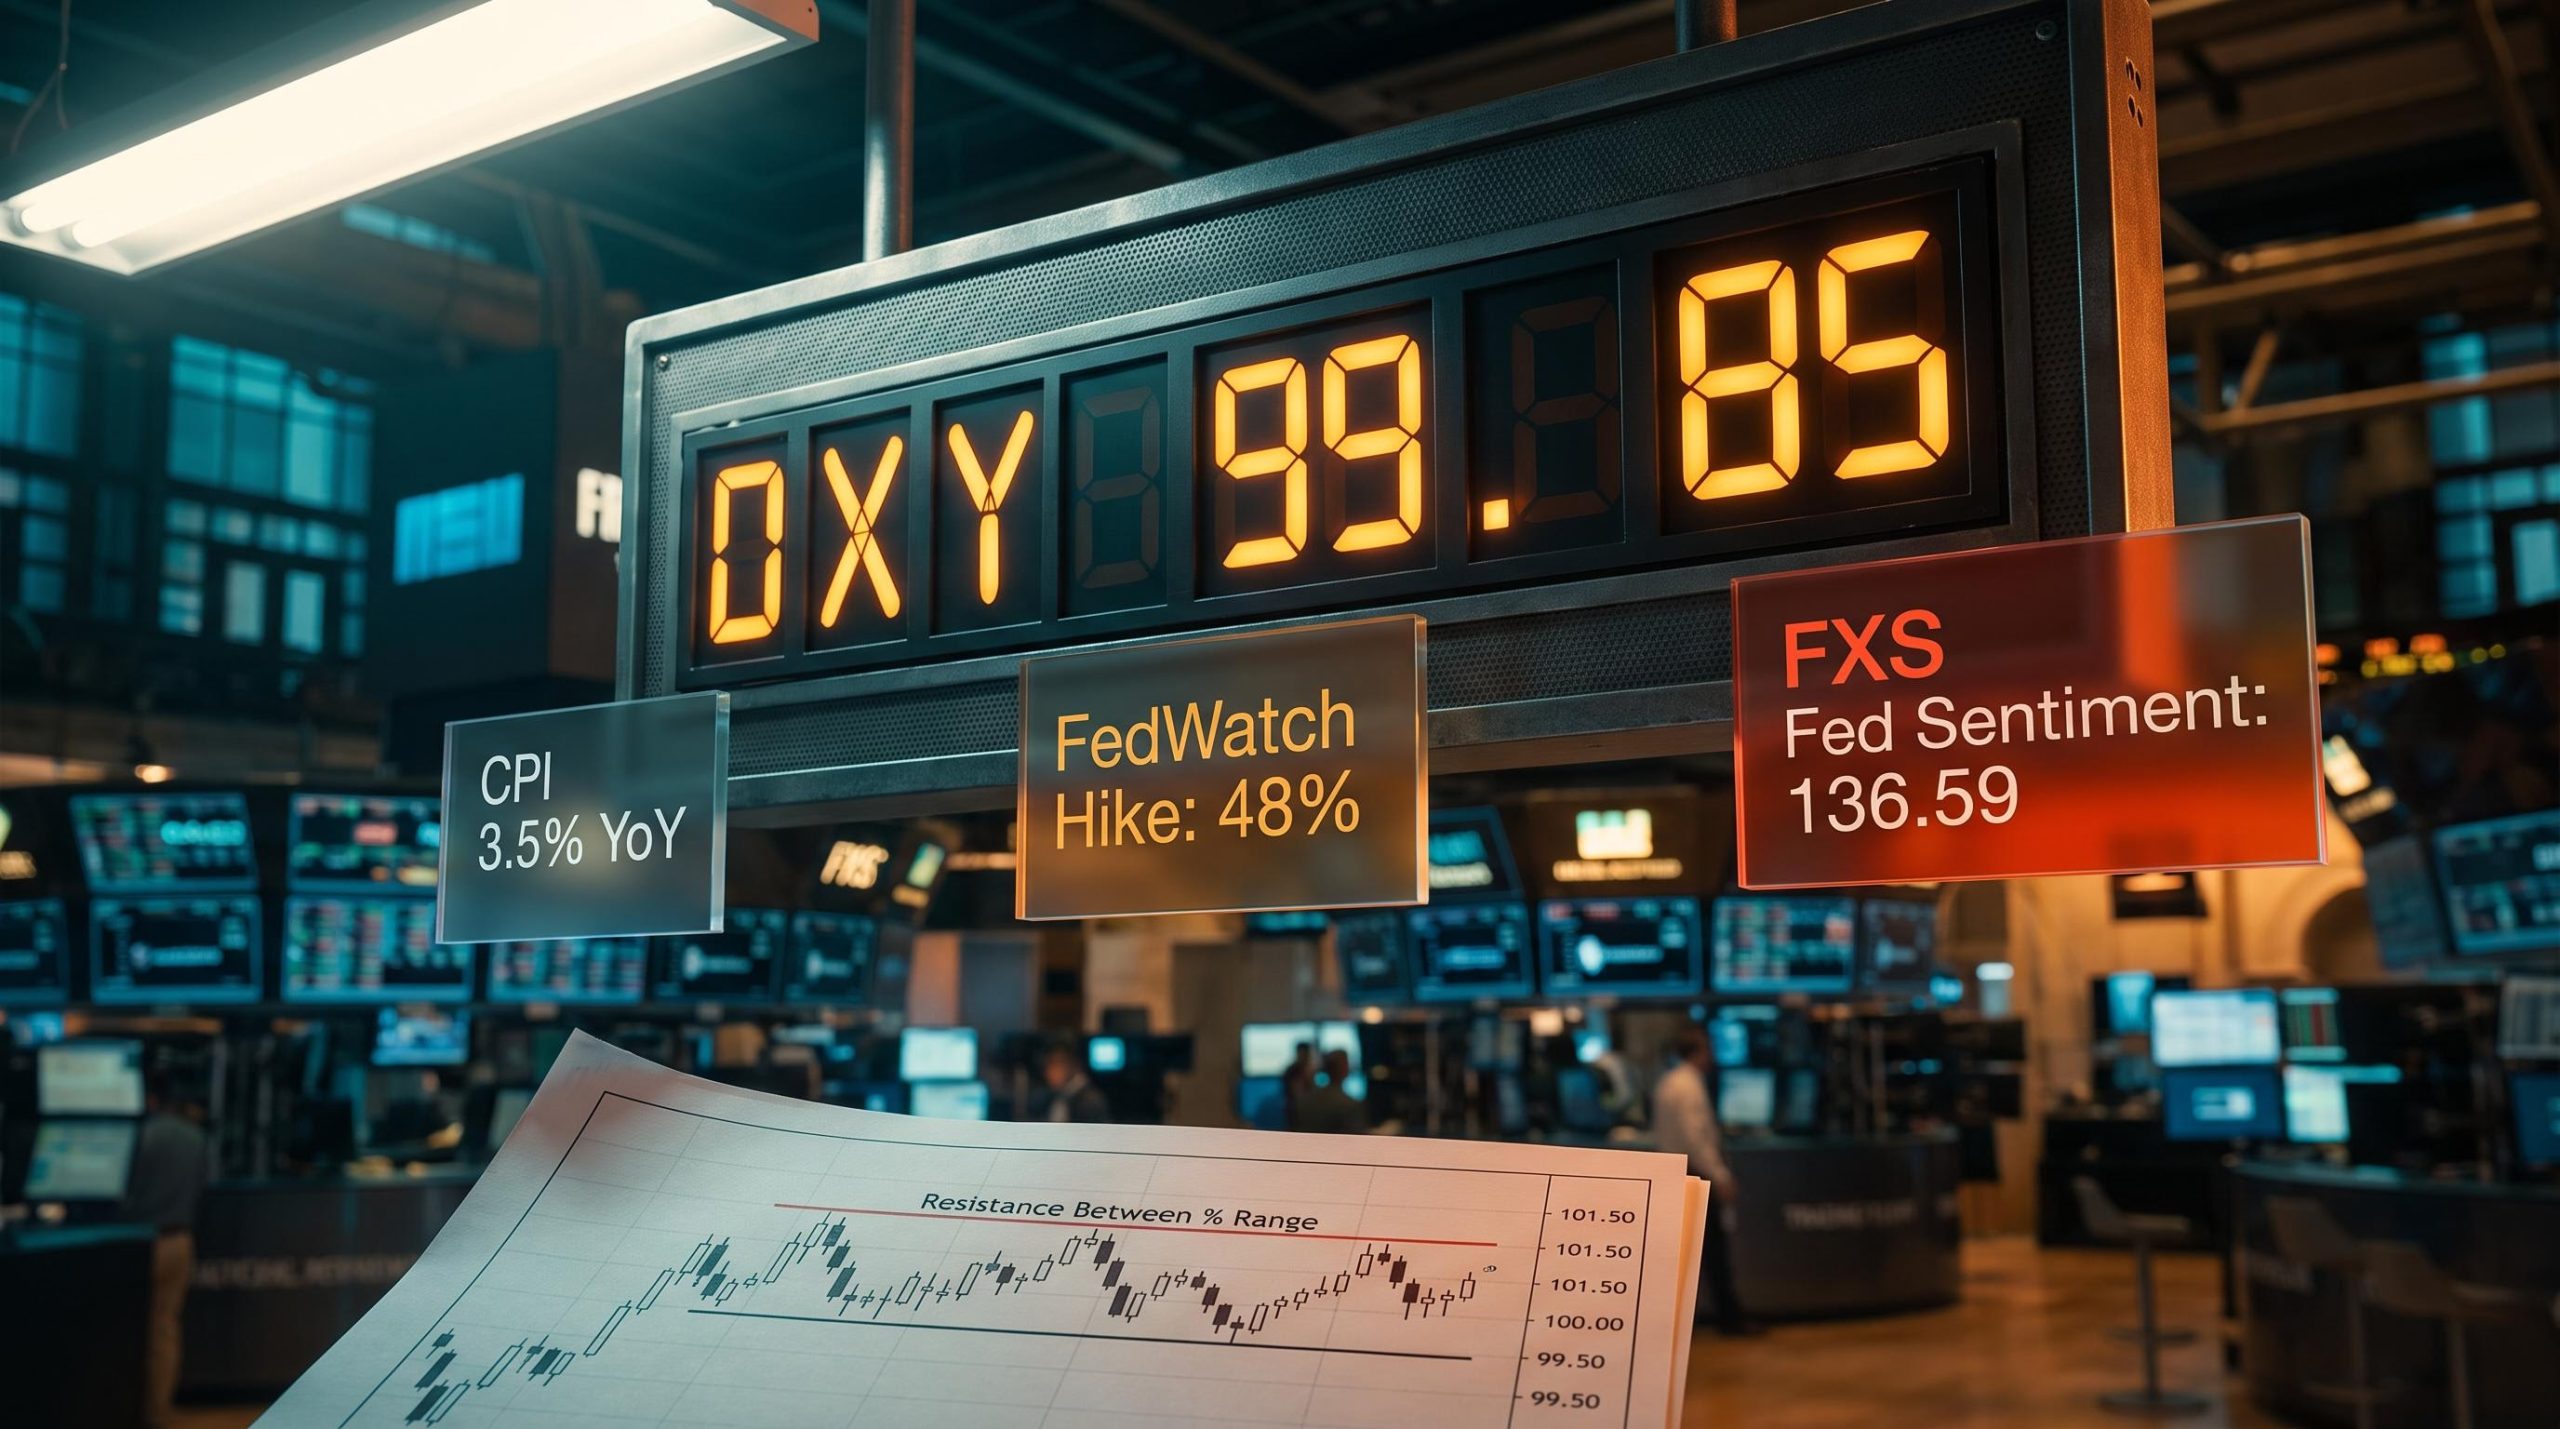
The US Dollar Index is trading within a fraction of 100, a level that functions as far more than a round number. It concentrates option strikes, stop orders, and algorithmic triggers in a way that amplifies whichever macro narrative is dominant when price arrives there. Right now, three narratives are competing for control.
The dollar’s position near 100 reflects a specific confluence: sticky-but-falling inflation keeping the Federal Reserve in a restrictive posture, a Fed communication tone that remains hawkish without committing to fresh hikes, and a Middle East geopolitical backdrop injecting an episodic safe-haven bid on top of those structural forces. Understanding how those three forces interact, and which one is doing the real work, is what separates a useful US dollar forecast from noise.
Here is the framework for assessing whether the dollar’s current strength has durable structural legs or is a function of temporary support that could unwind quickly, and the specific signposts that will tell you which scenario is playing out over the next three to six months.
Why the 100 level on the DXY is structurally loaded
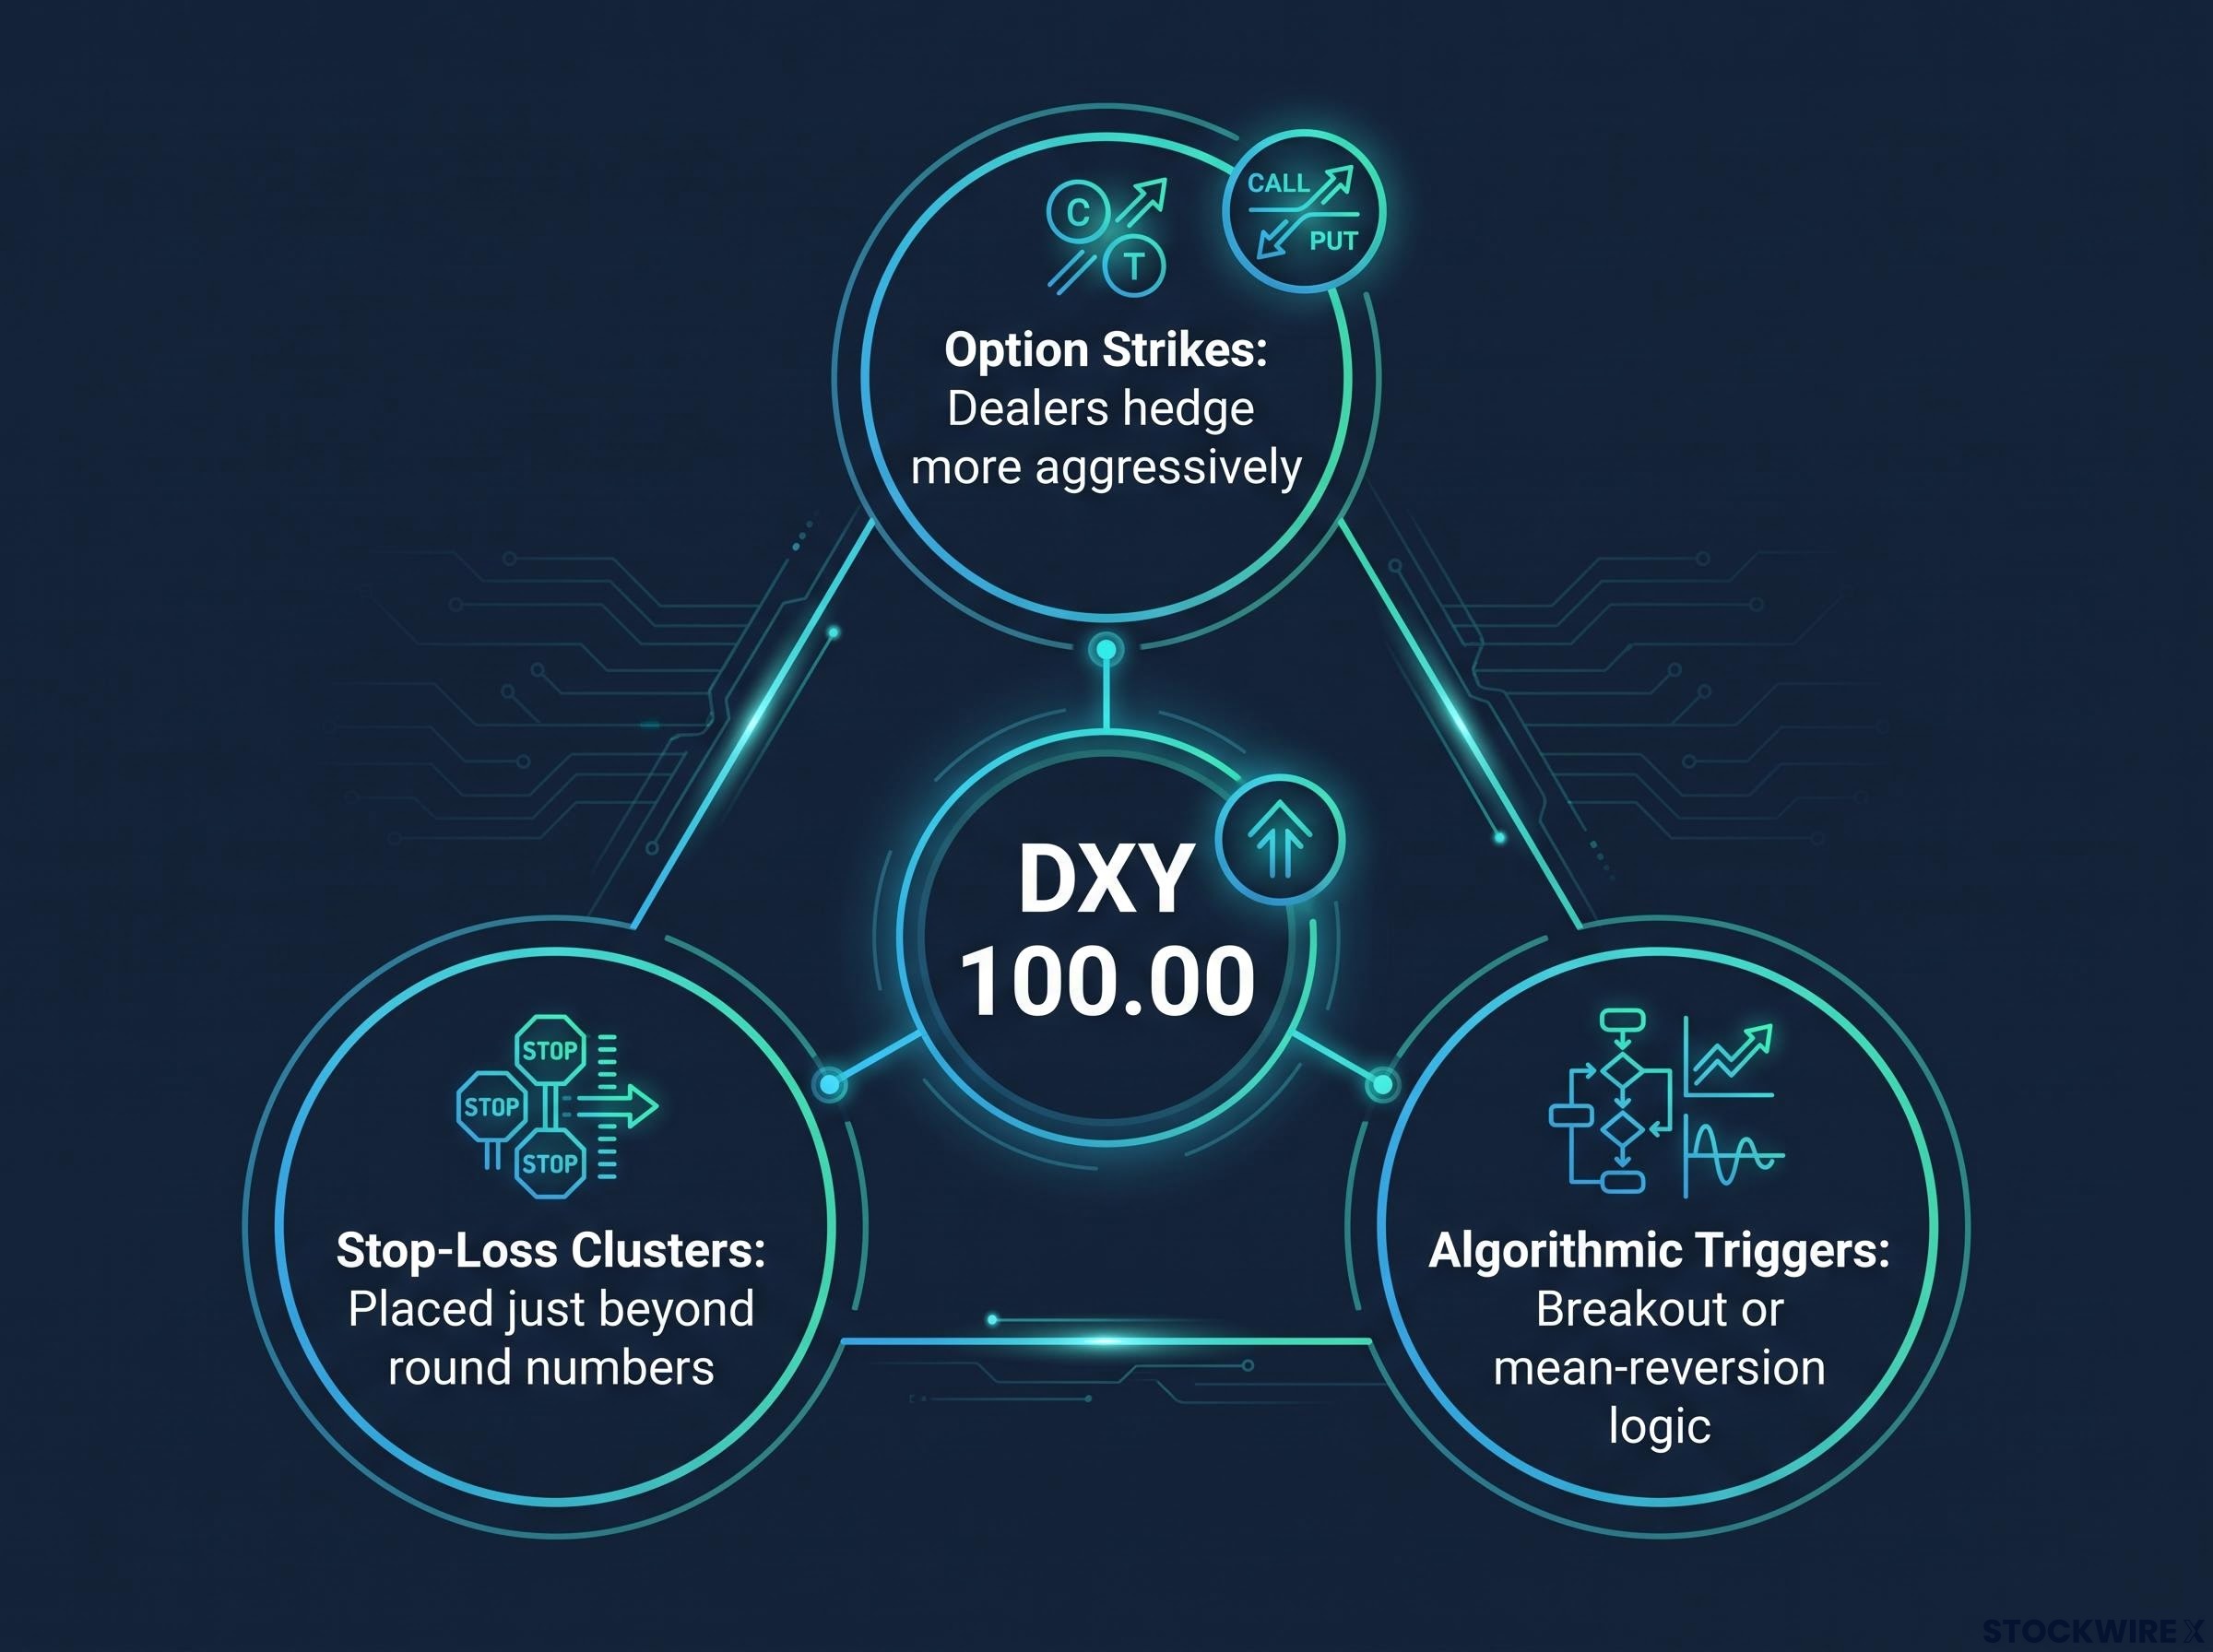
Round numbers in currency markets are not just psychological markers. They are mechanical amplifiers. At a level like 100.00 on the DXY, three types of concentrated orders stack on top of each other:
- Option strikes: Large volumes of currency options are written at round numbers, meaning dealers must hedge more aggressively as price approaches, which accelerates moves in either direction.
- Stop-loss clusters: Traders on both sides of the trade tend to place stop orders just beyond round numbers, creating pools of liquidity that, once triggered, feed momentum.
- Algorithmic triggers: Systematic strategies that use breakout or mean-reversion logic are often calibrated around round numbers, adding a layer of automated buying or selling precisely at the moment fundamentals are being tested.
The result is that 100.00 functions as a strategic pivot zone, not a one-way launchpad. A break above it, supported by strong data and rising yields, signals a durable floor. A break that occurs on thin liquidity and then fades signals a recurring ceiling. The distinction matters enormously, and it is entirely determined by what fundamental catalyst arrives when price is sitting in this mechanically loaded zone.
The DXY technical structure entering this period shows RSI in the high-30s to low-40s and MACD below zero on the daily chart, meaning the burden of proof sits with the bulls rather than the bears as each new CPI release arrives.
What the technical structure says about the current range
According to FXStreet analysis, support sits around 100.00 and 99.50, with resistance in the 100.5-101.5 zone. On Wednesday, 12 August, the DXY was quoted near 99.8-99.9 during Asian hours, marking its third straight session of gains.
That range tells you the index has not yet made a structural regime change in either direction. Cambridge Currencies projects roughly 96-101 over the next three months, with a broader 92-100 range for the second half of 2026 (though this projection has not been independently verified). The current price action is a test, not a verdict, and the fundamental data arriving over the next several weeks will determine which side of 100 becomes the new anchor.
When big ASX news breaks, our subscribers know first
What the inflation data is actually telling currency markets
The question currency markets are pricing is not where inflation sits today. It is how quickly inflation is falling and whether that pace is sustainable. Commerzbank analysts have framed the speed of price decline, rather than the absolute level, as the key variable shaping the dollar’s policy and yield outlook over the medium term, and that distinction is worth holding onto.
The pace of inflation decline is doing more analytical work than the headline level itself, a point reinforced by the energy-driven nature of the May spike: the 1.3 percentage-point gap between headline and core CPI in that month identified a supply-side distortion, not a demand-fuelled spiral spreading through services and goods.
Commerzbank’s framing: The pace of inflation decline, not just the level, is the primary driver of the dollar’s policy and yield outlook. How quickly CPI is falling determines when the Fed can credibly signal a pivot, which determines when rate differentials start narrowing.
Headline CPI registered 3.5% year-on-year in June 2026, down from 4.2% in May (both figures unverified independently). Core CPI stood at 2.6% in the same month, reflecting continued easing in underlying price pressures as earlier energy spikes faded. Cleveland Fed measures suggest longer-term inflation expectations remain reasonably anchored around 2%, despite short-term volatility driven partly by Middle East energy disruptions.
The two scenarios that matter from here are directionally clear:
- Sticky or re-accelerating inflation (particularly via energy or shelter) reprices markets toward prolonged tightening, supporting higher US yields and the DXY.
- Confirmed disinflation path toward 2-2.5% reinforces the case for eventual rate cuts, which narrows rate differentials and acts as a headwind for the dollar.
What this means for you is straightforward: the dollar’s near-term trajectory depends less on where CPI sits today and more on whether the next two or three prints confirm a credible path toward 2%. That is what determines when the Fed can credibly signal a pivot, and that is the data sequence worth tracking more closely than any single release.
How the Federal Reserve’s posture is holding the dollar near 100
The Fed’s “high for longer” stance is the structural anchor currently doing the most visible work in keeping the dollar near 100. But there is an important distinction between “high for longer” and “higher still,” and currency markets have started pricing that distinction.
Restrictive policy supports the dollar at its current level. The marginal impulse from expectations of fresh tightening, however, has weakened. According to the CME FedWatch Tool, the chance of a 25-basis-point hike at the September meeting had dipped to around 48%, retreating from 52% recorded the session before. That oscillation, rather than convergence, is itself informative. It tells you the Fed is in a data-dependent holding pattern where the next CPI or PCE print has an outsized ability to move market pricing, and therefore the dollar.
The FOMC split between hold and hike factions means individual CPI prints now function as swing votes in an active internal policy argument, amplifying the market-moving potential of each monthly release beyond what a more unified committee would produce.
Fed official Goolsbee’s recent remarks reinforced this posture. His description of labour market conditions as solid yet not robust, combined with his emphasis on the cost of living as the economy’s foremost challenge, pointed clearly toward inflation as the dominant risk in the Fed’s thinking, without signalling that further rate increases were imminent. The FXS Speechtracker placed his speech at 7 out of 10, a meaningful step up from the long-run average of 5.8.
FXS Fed Sentiment Index: 136.59, well above the neutral benchmark of 100. Aggregate Fed communication sits firmly in hawkish territory, with the index holding substantially above the neutral threshold even as markets debate the pace of future tightening.
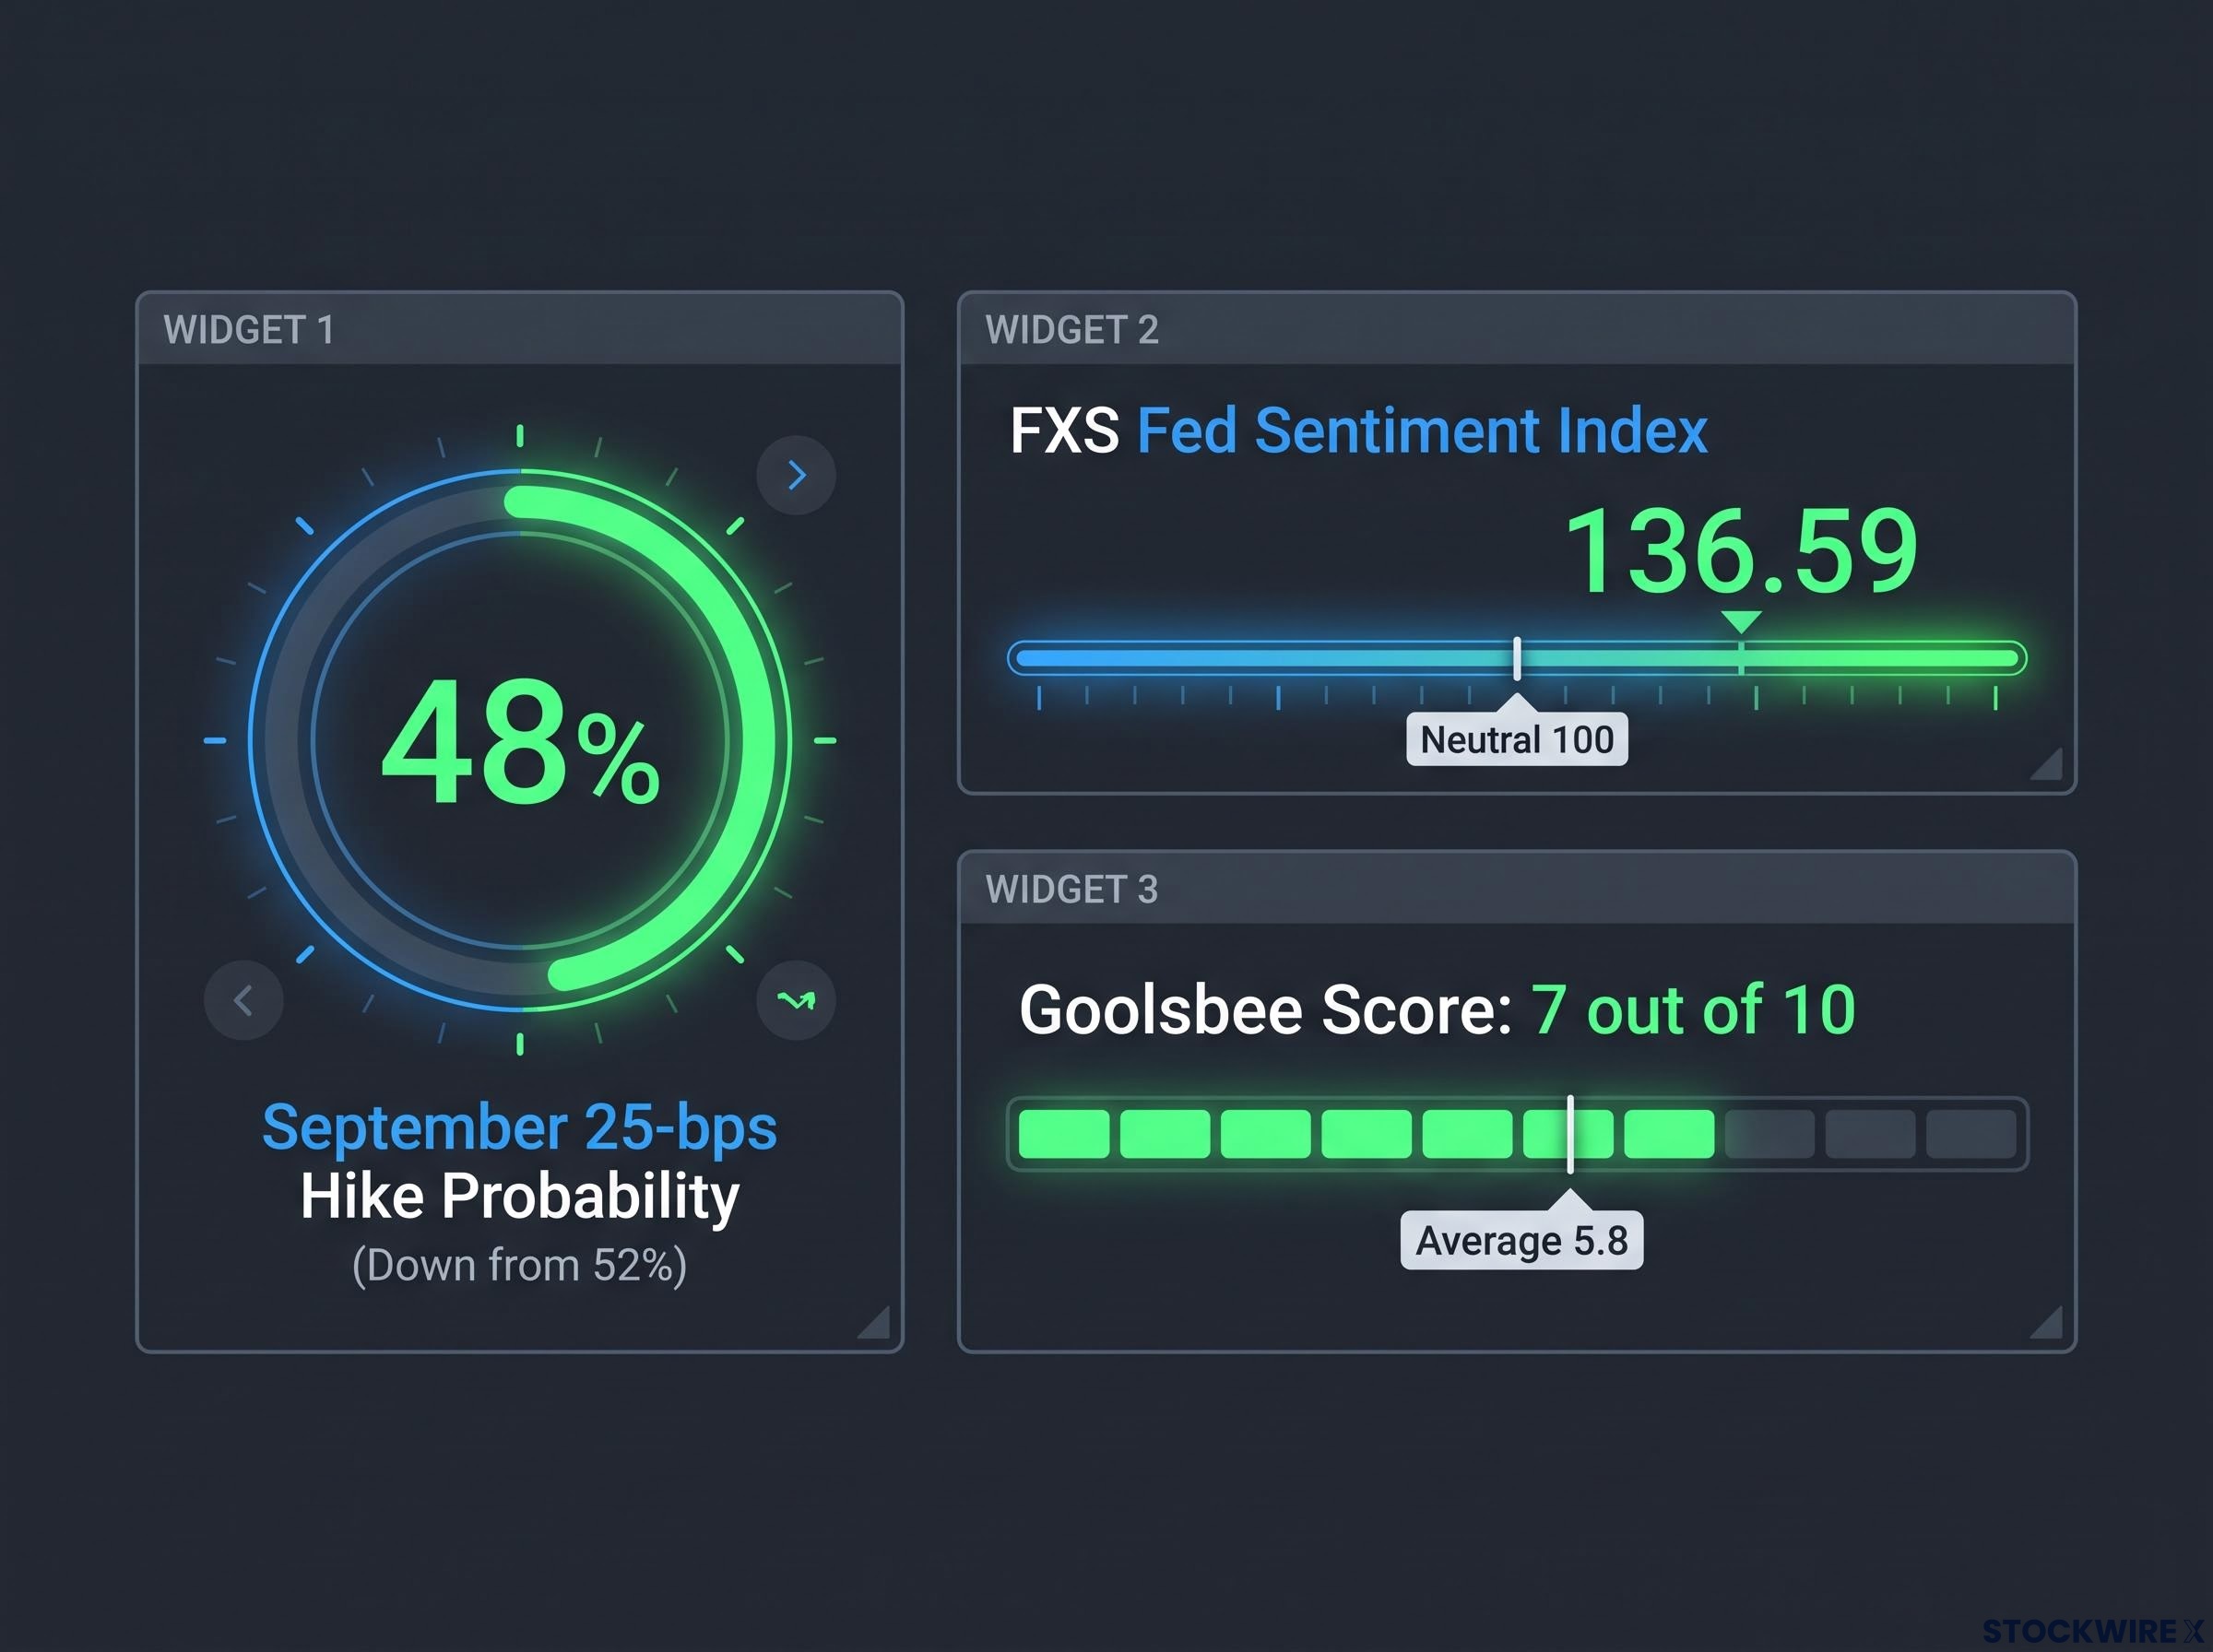
The CME FedWatch Tool tracks the probability that markets assign to specific rate decisions at upcoming meetings, based on federal funds futures pricing. The FXS Speechtracker assigns a numerical hawkishness score to individual Fed speeches, allowing you to compare communication tone across officials and over time. Together, these two instruments give you a real-time gauge of how Fed tone and market expectations interact to set the dollar’s floor and ceiling.
| Fed Posture | Market Pricing Implication | Likely DXY Directional Bias |
|---|---|---|
| Extended hold at current rates | Hike odds fade; rate differentials stable but not widening | DXY supported near 100, limited upside |
| Repricing toward additional hike | Yields rise on front end; rate differentials widen | DXY tests 101-102, potential break above |
This explains why the DXY can sit near 100 even as hike probabilities oscillate. The level reflects the current restrictive stance, not expectations of future hikes. The dollar has a floor, but the ceiling is capped until the data gives the Fed, and markets, a reason to reprice toward genuinely higher rates.
Geopolitical risk as a variable overlay, not a structural driver
Middle East tensions affect the dollar through two distinct channels, and understanding the difference between them is what separates a reactive view from a durable one:
- Safe-haven demand: Heightened tensions boost demand for liquid, perceived-safe assets, particularly US Treasuries and the dollar, as risk appetites in equities and emerging-market currencies retreat.
- Inflation via energy costs: Disruptions around the Strait of Hormuz could push headline CPI sharply higher through energy prices, with analyst scenarios suggesting a possible 1.0% monthly CPI surge driven largely by petrol costs (this figure has not been independently verified). That kind of spike would force a more hawkish Fed response, compounding the dollar’s strength through the rate channel.
The current geopolitical backdrop is real but unresolved. Reports from Pakistan’s defence minister pointed to Washington and Tehran drawing closer to a deal over Strait of Hormuz access, with separately reported Iran-Oman talks said to be at an advanced stage. Yet the diplomatic outlook remained clouded after Trump demanded that Tehran pay reparations for attacks linked to the Islamic Republic, injecting fresh uncertainty into the situation.
On 10 June, after US strikes on Iran, the DXY held around 99.85, with safe-haven demand offset by anticipation of the May CPI release. That tug-of-war captured the dynamic precisely: geopolitics moved the needle, but macro data pulled it back.
The asymmetry between escalation and de-escalation
The risk here is asymmetric, and not in the way that favours a stable outlook.
If tensions escalate into a durable supply disruption, the dollar benefits from both channels simultaneously: safe-haven flows intensify and energy-driven CPI forces the Fed to stay hawkish longer, even at the cost of growth. The DXY could spike above 100-102 under that scenario.
If tensions ease, the safe-haven premium unwinds quickly, removing a layer of dollar support and leaving the currency re-exposed to the underlying macro forces of disinflation and oscillating rate expectations. The geopolitical bid, by its nature, is one that can disappear without warning.
For you, the practical implication is clear: geopolitical headlines can move the dollar sharply in the short term, but unless they escalate into a durable supply disruption with inflation consequences, they represent a temporary overlay on top of the inflation-and-Fed thesis that is doing the structural work. Avoid over-rotating your dollar view on a single diplomatic headline.
What the three forces tell you about where the dollar goes from here
The three drivers, inflation, Fed posture, and geopolitical risk, interact in specific, trackable ways. Rather than offering a single forecast that the next data print could invalidate, the more durable approach is a scenario framework that tells you what to expect under each combination of conditions.
| Scenario | Inflation Data | Fed Path | Likely DXY Bias |
|---|---|---|---|
| Sticky or higher inflation | Headline stays above 3.5%, core stalls or rises | Market reprices toward additional hike or extended hold | Support above 100, tests 101-102 |
| Orderly disinflation (base case) | Headline trends toward 2.5-3.0%, core approaches 2.5% | Extended hold, then tentative cuts in 2027 | Range-bound mid-90s to low-100s, mild softening bias |
| Energy shock or Hormuz disruption | Headline CPI spikes on oil-driven surge | Fed forced to stay hawkish longer despite growth risks | Short-term spike above 100-102 |
| Geopolitical de-escalation plus soft data | Inflation undershoots, growth slows | Fed signals pivot toward easing | Rejection of 100, drift into mid-90s |
The base case across most institutional research sits closest to orderly disinflation: inflation remains above target but trending lower, the Fed holds then eventually cuts, and geopolitics remain a risk factor rather than a structural regime change. Natixis targets the DXY toward 98 by end-2026 (unverified), while Forecasts.org’s statistical model projects 100.9-102.5 between July and December 2026 (also unverified). The range of forecasts tells you the consensus expects bounded movement, not a trend break.
Investors wanting broader context on how the dollar reached this juncture will find our full explainer on the DXY’s 2026 rebound, which covers Morningstar’s 15% overvaluation estimate and what the first-ever net dollar-reduction intent survey among sovereign institutions means for medium-term positioning.
The signposts to monitor, ranked by analytical priority:
- Monthly CPI and PCE releases: Focus on core measures and energy components. The pace of decline matters as much as the level.
- CME FedWatch probabilities for the next two meetings: Rising odds of hikes or delayed cuts lift the dollar; falling odds do the opposite.
- Cleveland Fed inflation expectations curves: A move upward in longer-term expectations would force more sustained hawkishness.
- Energy prices and Middle East diplomatic channels: Any development that materially affects supply routes, particularly Hormuz risk, feeds both inflation and safe-haven demand.
- Price action at 100.00 itself: Whether breaks above are supported by data or fade on thin liquidity reveals whether the level is becoming a floor or a ceiling.
The scenario matrix tells you that the dollar’s trajectory is not a mystery waiting to be revealed. It is a conditional outcome. The next two or three CPI prints, combined with CME FedWatch movement, will clarify which branch of the scenario tree is live. That is where to direct your attention now.
Reading the dollar’s next move in a data-dependent regime
The hierarchy is clear. Inflation and its implications for Fed policy are the structural drivers. Geopolitical risk is a real but reversible overlay. And 100.00 is where these forces are currently being stress-tested by market mechanics designed to amplify their consequences.
The dollar’s next directional move is not predetermined. It is contingent on whether the next two or three CPI prints confirm a credible disinflation path or reveal stickiness that reprices the Fed’s timeline. Systematic monitoring of the signposts outlined above, particularly core inflation data and CME FedWatch probabilities, will provide more value than any static forecast.
The question worth holding is not whether the dollar breaks 100, but whether the break, or rejection, is confirmed by the fundamental data that would make it durable. That answer arrives with each monthly inflation release.
This article is for informational purposes only and should not be considered financial advice. Investors should conduct their own research and consult with financial professionals before making investment decisions. Financial projections referenced are subject to market conditions and various risk factors. Past performance does not guarantee future results.