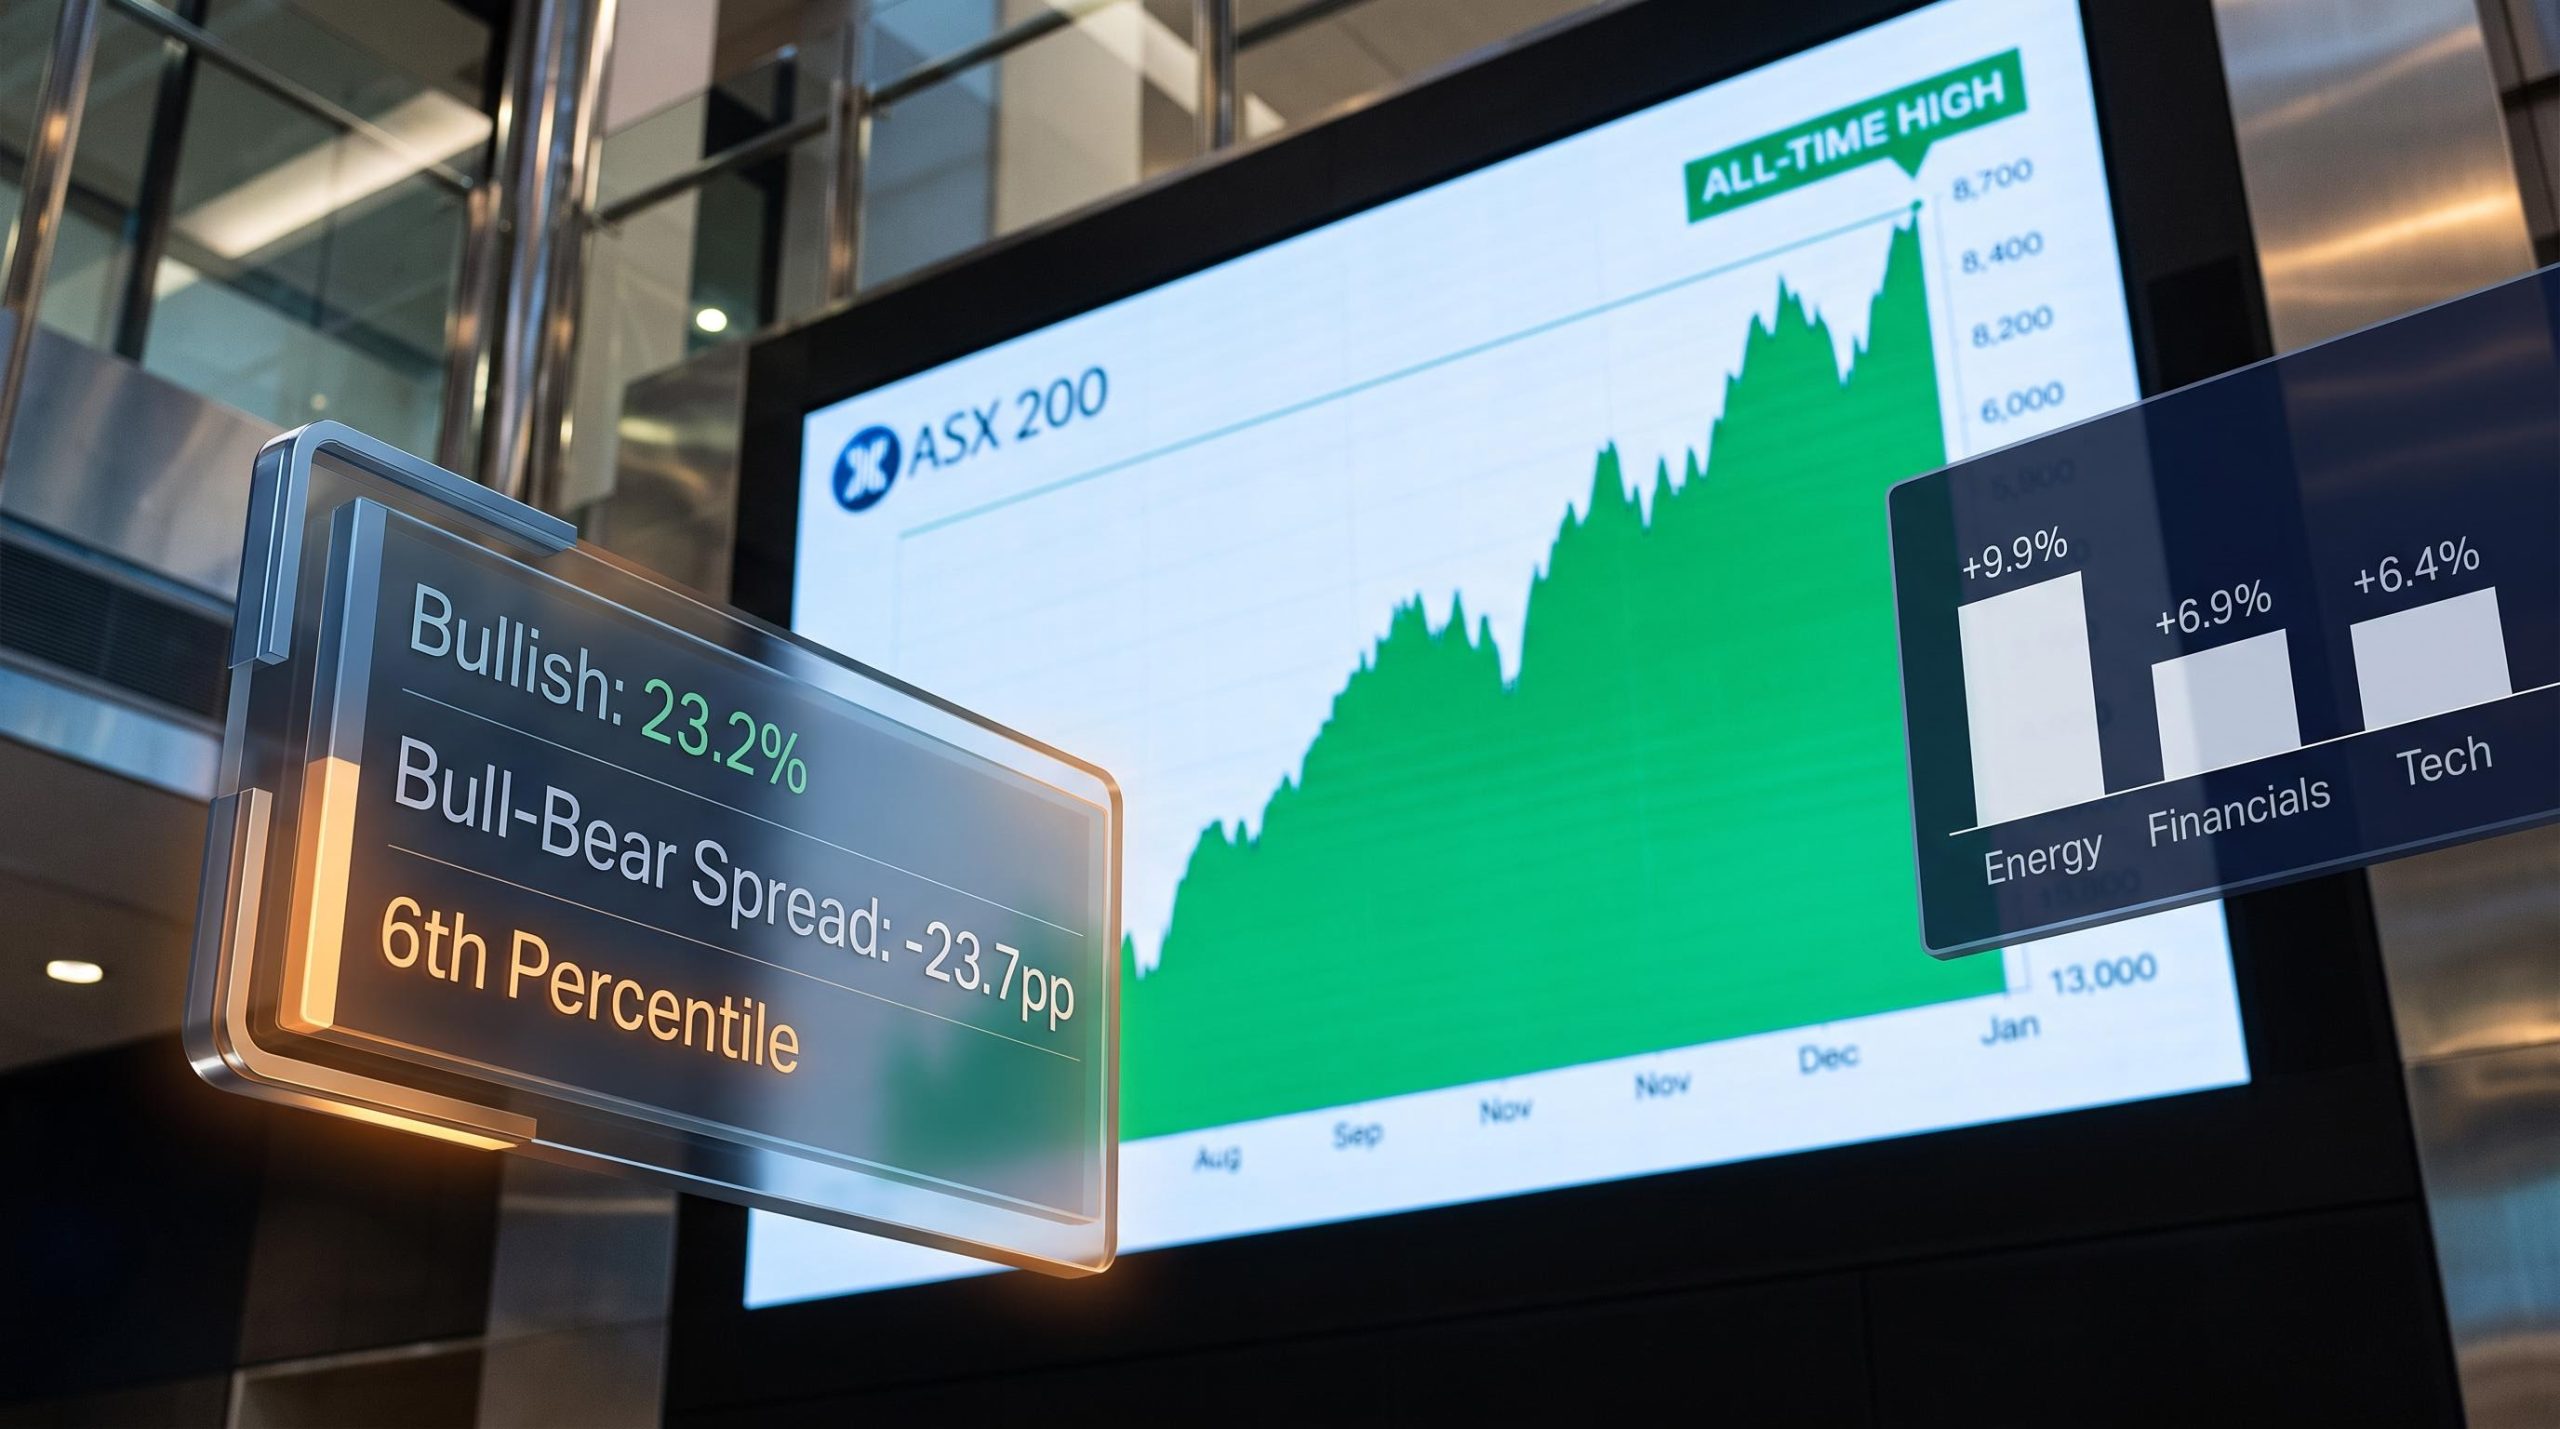
The ASX 200 posted back-to-back all-time highs on Wednesday and Thursday last week. On both days, sequential records fell. And yet the investors surveyed about their outlook for the week ended 2 August 2026 delivered one of the most pessimistic readings in the dataset’s history.
That is not a case of fear foreshadowing a fall, or prices confirming a gloomy consensus. The pessimism is materialising alongside, and in spite of, constructive price action and positive returns across every major sector. So what does a near-historic pessimism reading actually tell you when prices are rising?
Here is what the data shows about the gap between investor mood and market momentum, what it has historically meant for what comes next, and how to interpret the divergence rather than simply noting that it exists.
What the latest sentiment numbers actually show
The headline figure is stark. The share of bullish respondents came in at 23.2% for the week ended 2 August 2026, a result that ranks in roughly the 6th percentile of every reading ever recorded in the Market Index investor sentiment survey. The bull-bear spread reached -23.7 percentage points, marking its sharpest negative reading since sentiment deteriorated sharply in the 7 June fear spike.
The key data points, taken together, build a case:
- Bullish respondents: 23.2%, approximately the 6th percentile across the full dataset
- Bull-bear spread: -23.7 percentage points
- Four consecutive weekly declines in bullishness
- The bearish cohort contracted by roughly 1.2 percentage points over the week
- Current optimism is sitting near its weakest point of the year, broadly comparable to mid-May levels
Optimism has only been lower on a handful of occasions across the entire dataset.
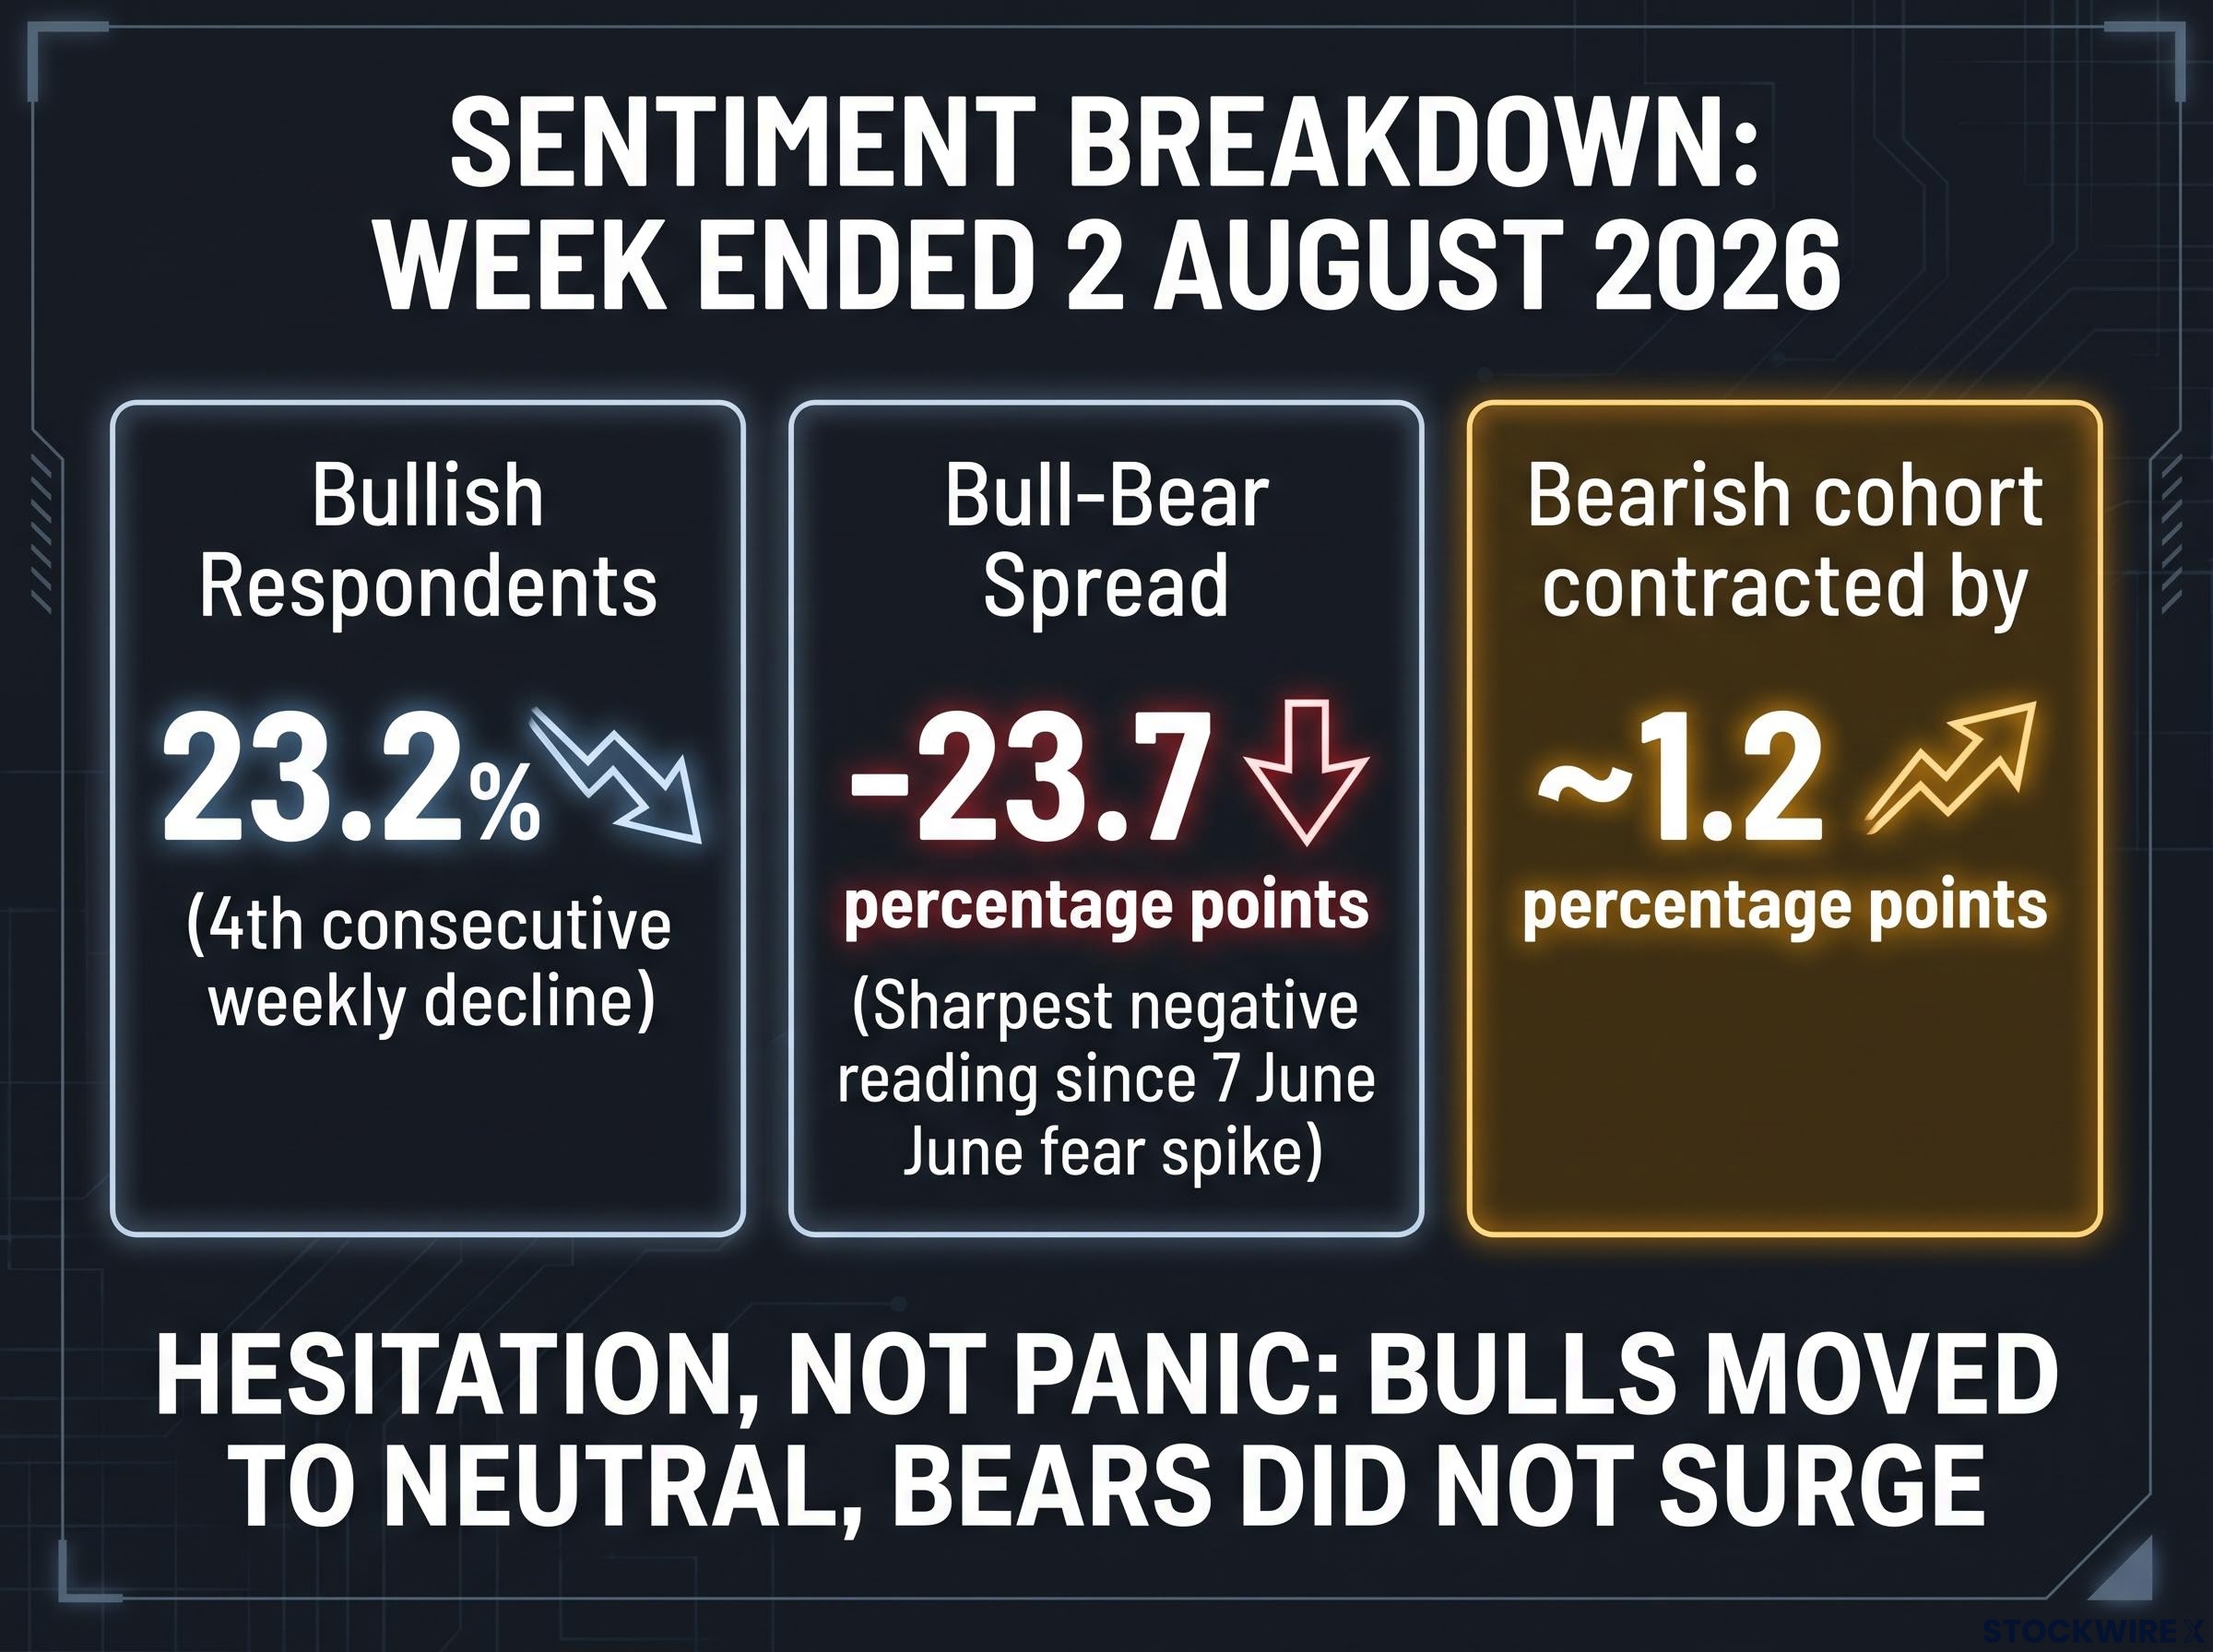
The compositional detail matters more than the headline. The drop in bullishness was not driven by a surge in outright bears. Instead, the movement ran from bulls into the neutral category, with bearish respondents edging modestly lower over the period. That distinction changes how you read the severity of the signal. This is hesitation, not panic. Investors are stepping back into uncertainty rather than capitulating into full-blown pessimism, and that difference has real implications for how durable the current configuration is likely to be.
When big ASX news breaks, our subscribers know first
How to read a sentiment survey, and when the numbers get interesting
The Market Index investor sentiment survey captures the self-reported directional bias of retail and semi-professional investors. Respondents classify themselves as bullish, bearish, or neutral. Results are published weekly as percentage shares, along with derived metrics such as the bull-bear spread.
This is a sentiment indicator, not a forecast. It tells you how investors feel, not what markets will do. That distinction is analytically important, because the tool’s value lies not in predicting direction but in quantifying the emotional state of market participants.
Academic research using Granger-causality testing reinforces a point the current survey reading illustrates clearly: sentiment surveys reflect what prices have recently done rather than predicting where they will go next, which is why the analytical value lies in extremes rather than directional readings.
Sentiment surveys sit within a broader toolkit of market psychology measures, including:
- The VIX (a volatility index that prices expected market swings)
- Put-call ratios (measuring the balance between bearish and bullish options bets)
- Fund flow data (tracking where money is moving in and out)
These instruments are inputs into a framework, not standalone signals. Their analytical power increases at statistical extremes.
What the survey measures versus what it predicts
The survey captures investor feeling, not market direction. That distinction is analytically important because the two frequently diverge, and the divergence itself becomes the signal.
At the 6th percentile, the current reading describes something specific: a crowded consensus. By definition, the pessimistic or neutral-to-pessimistic stance is shared by an unusually large proportion of respondents. Crowded positioning is where contrarian analysis begins, not ends, because it tells you something about where future marginal buying or selling pressure is likely to come from.
Records on the screen, unease in the survey: what is causing the gap?
The ASX 200 posted sequential all-time highs on Wednesday and Thursday of the survey week. At the same time, surveyed investors reported near-historic pessimism. That is not a contradiction the market will automatically resolve, but it is one worth interrogating.
The typical assumption, that record highs equal widespread investor confidence, does not hold here. Three competing explanations help frame why.
The ASX 200 record highs that form the backdrop for this sentiment divergence arrived after three RBA rate hikes compressed the index into an eight-month trading range; understanding the valuation and earnings conditions that finally broke that range helps contextualise why investor unease about multiples is not irrational even as prices advance.
- Retail sentiment is lagging institutional price-setting. The investors in weekly sentiment surveys are not the same group that sets prices at the margin. If institutional flows are driving the index to records while retail investors sit on the sidelines, the survey is capturing the psychology of laggards who have not yet re-engaged.
- Valuation anxiety is suppressing optimism. Commonwealth Bank trading at approximately 30 times forward earnings highlights a real tension. Investors can see prices rising yet feel uneasy about the multiples required to justify further gains.
- The rally is unfolding without broad psychological participation. When markets rise but the typical investor does not feel confident about it, the result is hesitation, second-guessing, and sidelined capital.
That sidelined capital is a contrarian variable, not just an anomaly. Hesitant investors represent potential re-entry buyers on relatively modest positive catalysts.
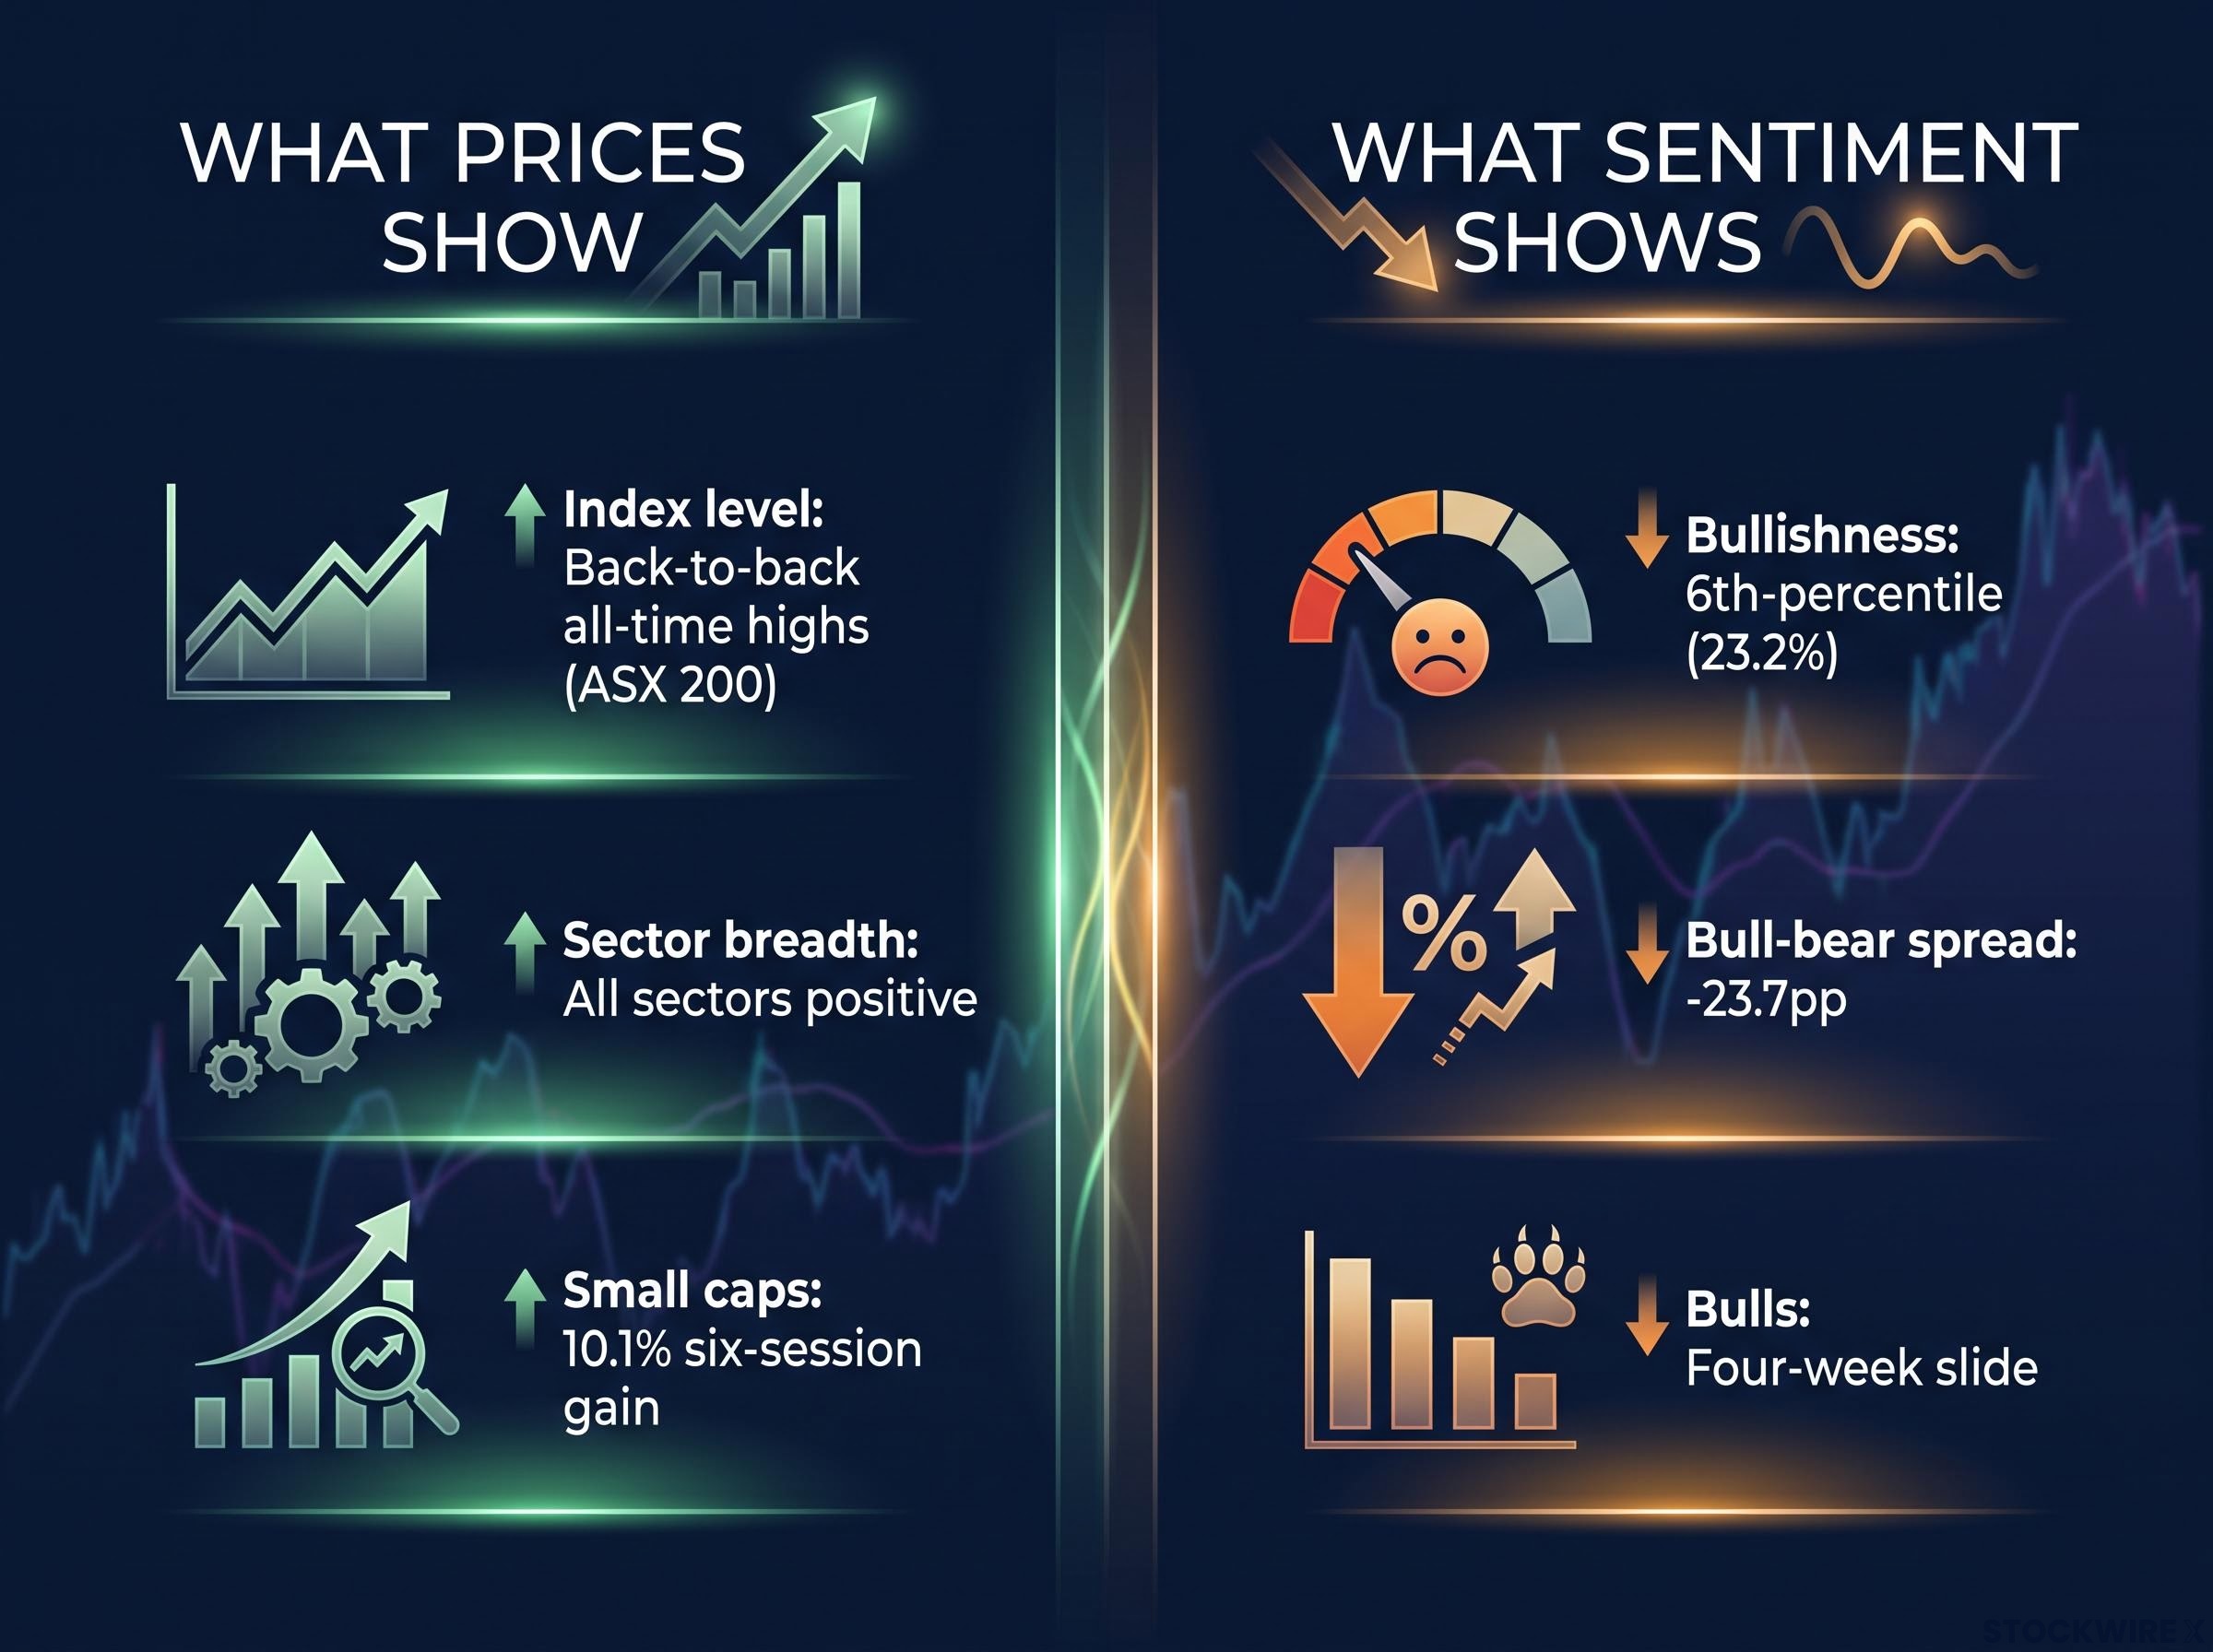
| Metric | What prices show | What sentiment shows |
|---|---|---|
| Index level | Back-to-back all-time highs | 6th-percentile bullishness |
| Sector breadth | All sectors positive | Bull-bear spread at -23.7pp |
| Small caps | 10.1% six-session gain | Four-week slide in bulls |
The divergence suggests the rally may be less psychologically extended than index levels alone imply. That has implications for how much further optimism could travel if confidence begins to catch up with price.
Sector breadth tells a different story from the survey
Every sector within the ASX 200 posted positive monthly returns over the prior month to the survey period. That is not a narrow rally being held up by a handful of heavyweight names. It is a broadly participated move.
Every sector within the ASX 200 posted positive monthly returns over the period, with no major segment in the red.
The standout performers reinforce that breadth.
| Sector | Monthly return (approx.) |
|---|---|
| S&P/ASX Emerging Companies Index | ~10.1% (six-session streak) |
| Energy | ~9.9% |
| Financials | ~6.9% |
| Technology | ~6.4% |
| Consumer Discretionary | ~4.7% |
Period: prior month to the survey week ending approximately 8 August 2026. Source: Market Index.
The small-cap and speculative participation is the detail that sharpens the picture. A gain of approximately 10.1% recorded by the S&P/ASX Emerging Companies Index over six straight sessions reflects investors extending their reach toward higher-risk names. That is the internal structure of a risk-on move, not a defensive flight to safety.
Financials advanced 6.9% despite the valuation-related unease around CBA. Energy led the major sectors at 9.9%. Broad-based strength including small caps makes the simultaneous collapse in survey sentiment harder to explain as rational caution, and more consistent with the psychological lag described above.
Why contrarians treat crowded pessimism as a starting point, not a conclusion
The mechanical basis of contrarian analysis is straightforward. When most would-be sellers have already sold or stepped aside, the bearish view is largely reflected in positioning. For markets to fall significantly from there, fresh negative news must be severe enough to convert remaining optimists and neutrals into sellers, an increasingly demanding hurdle as the pessimistic camp grows crowded.
By contrast, even modestly positive news in a deeply pessimistic backdrop can trigger outsized moves, as under-exposed investors scramble to rebuild positions.
A contrarian framework built on four sequential signals, sector-level mandate avoidance, direct evidence of peer absence, peer scepticism, and early green shoots visible only through primary research, offers a structured approach to acting on extreme sentiment readings rather than simply observing that pessimism is crowded.
That is why a 6th-percentile bullishness reading attracts contrarian attention. But disciplined contrarians apply three caveats before acting on it:
- Extreme sentiment can persist and deepen. Today’s 6th percentile can become next week’s 4th percentile. Mean reversion is a tendency, not a timer.
- Sentiment works best alongside corroborating price action. A contrarian reading paired with a falling index and broken technical levels is very different from one sitting next to fresh all-time highs.
- The type of pessimism matters. Bulls shifting to neutral (hesitation) sends a different signal from neutrals shifting to bears (conviction).
Why this setup is different from typical extreme pessimism
A concerning extreme pessimism setup pairs deeply negative sentiment with falling prices, panic-driven bears, and deteriorating market structure. The current configuration is the opposite: the ASX 200 is at record highs, sector strength is broad-based, and the pessimism is driven by hesitation rather than conviction.
Applied to this setup, the three caveats arguably reinforce the contrarian read rather than moderating it. Sentiment is extreme. Price action is constructive. The pessimism looks tentative. Survey data indicates that when bullishness declines across four consecutive weeks, sentiment has typically turned around within the following week. That combination, where none of the caveats fire, makes the signal comparatively cleaner than most extreme readings.
What the next survey reading will reveal, and what to watch beyond it
The immediate test is the next survey reading following the week ended 2 August. Historical patterns suggest four consecutive bearish readings tend to reverse, making the next data point analytically significant.
The more important question is what happens to sentiment if the ASX 200 continues pressing higher. Behavioural finance describes a FOMO (fear of missing out) inflection point: the moment when watching prices rise becomes more painful than the perceived risk of re-entering. That dynamic, if it unfolds, would force reluctant investors back in and recover sentiment even as prices advance.
Markets that grind higher against a backdrop of widespread scepticism can eventually force reluctant participants back in, recovering sentiment as prices advance.
On that view, Australian markets may be earlier in the sentiment cycle than record index levels alone suggest. The progression from pessimism, through scepticism, toward optimism could still be ahead. If the FOMO dynamic unfolds, current sentiment levels may look in hindsight like the early phase of a recovery, not the peak of a warning signal.
For investors wanting a structured method to act on a potential FOMO inflection point without abandoning long-term discipline, our dedicated guide to core-satellite portfolio construction explains how to channel re-entry impulses into a bounded satellite allocation that protects the compounding core.
The next survey reading arrives quickly. You are now positioned to interpret it.
Mood and momentum are telling different stories, and the gap rarely stays wide for long
Australian investor sentiment at the 6th percentile sits alongside ASX 200 record highs and broad-based sector strength. That is an unusual configuration, and historically it has tended to resolve toward sentiment recovery rather than price reversal.
The key distinction from this analysis: pessimism driven by hesitation in a rising market is a different animal from pessimism confirmed by falling prices. The current setup belongs firmly in the former category. Bulls stepped back; bears did not surge. Prices did not validate the gloom.
If you are watching the next sentiment survey and monitoring whether sidelined capital begins to re-engage, you will have an earlier read on whether the FOMO inflection point is approaching, and whether this gap between mood and momentum is about to close.
This article is for informational purposes only and should not be considered financial advice. Investors should conduct their own research and consult with financial professionals before making investment decisions. Past performance does not guarantee future results.