The two most-cited reasons to be bearish on Nvidia heading into August 26 both involve large, attention-grabbing numbers. One of them is probably overstated. The other is more complicated than either bulls or bears are pricing in.
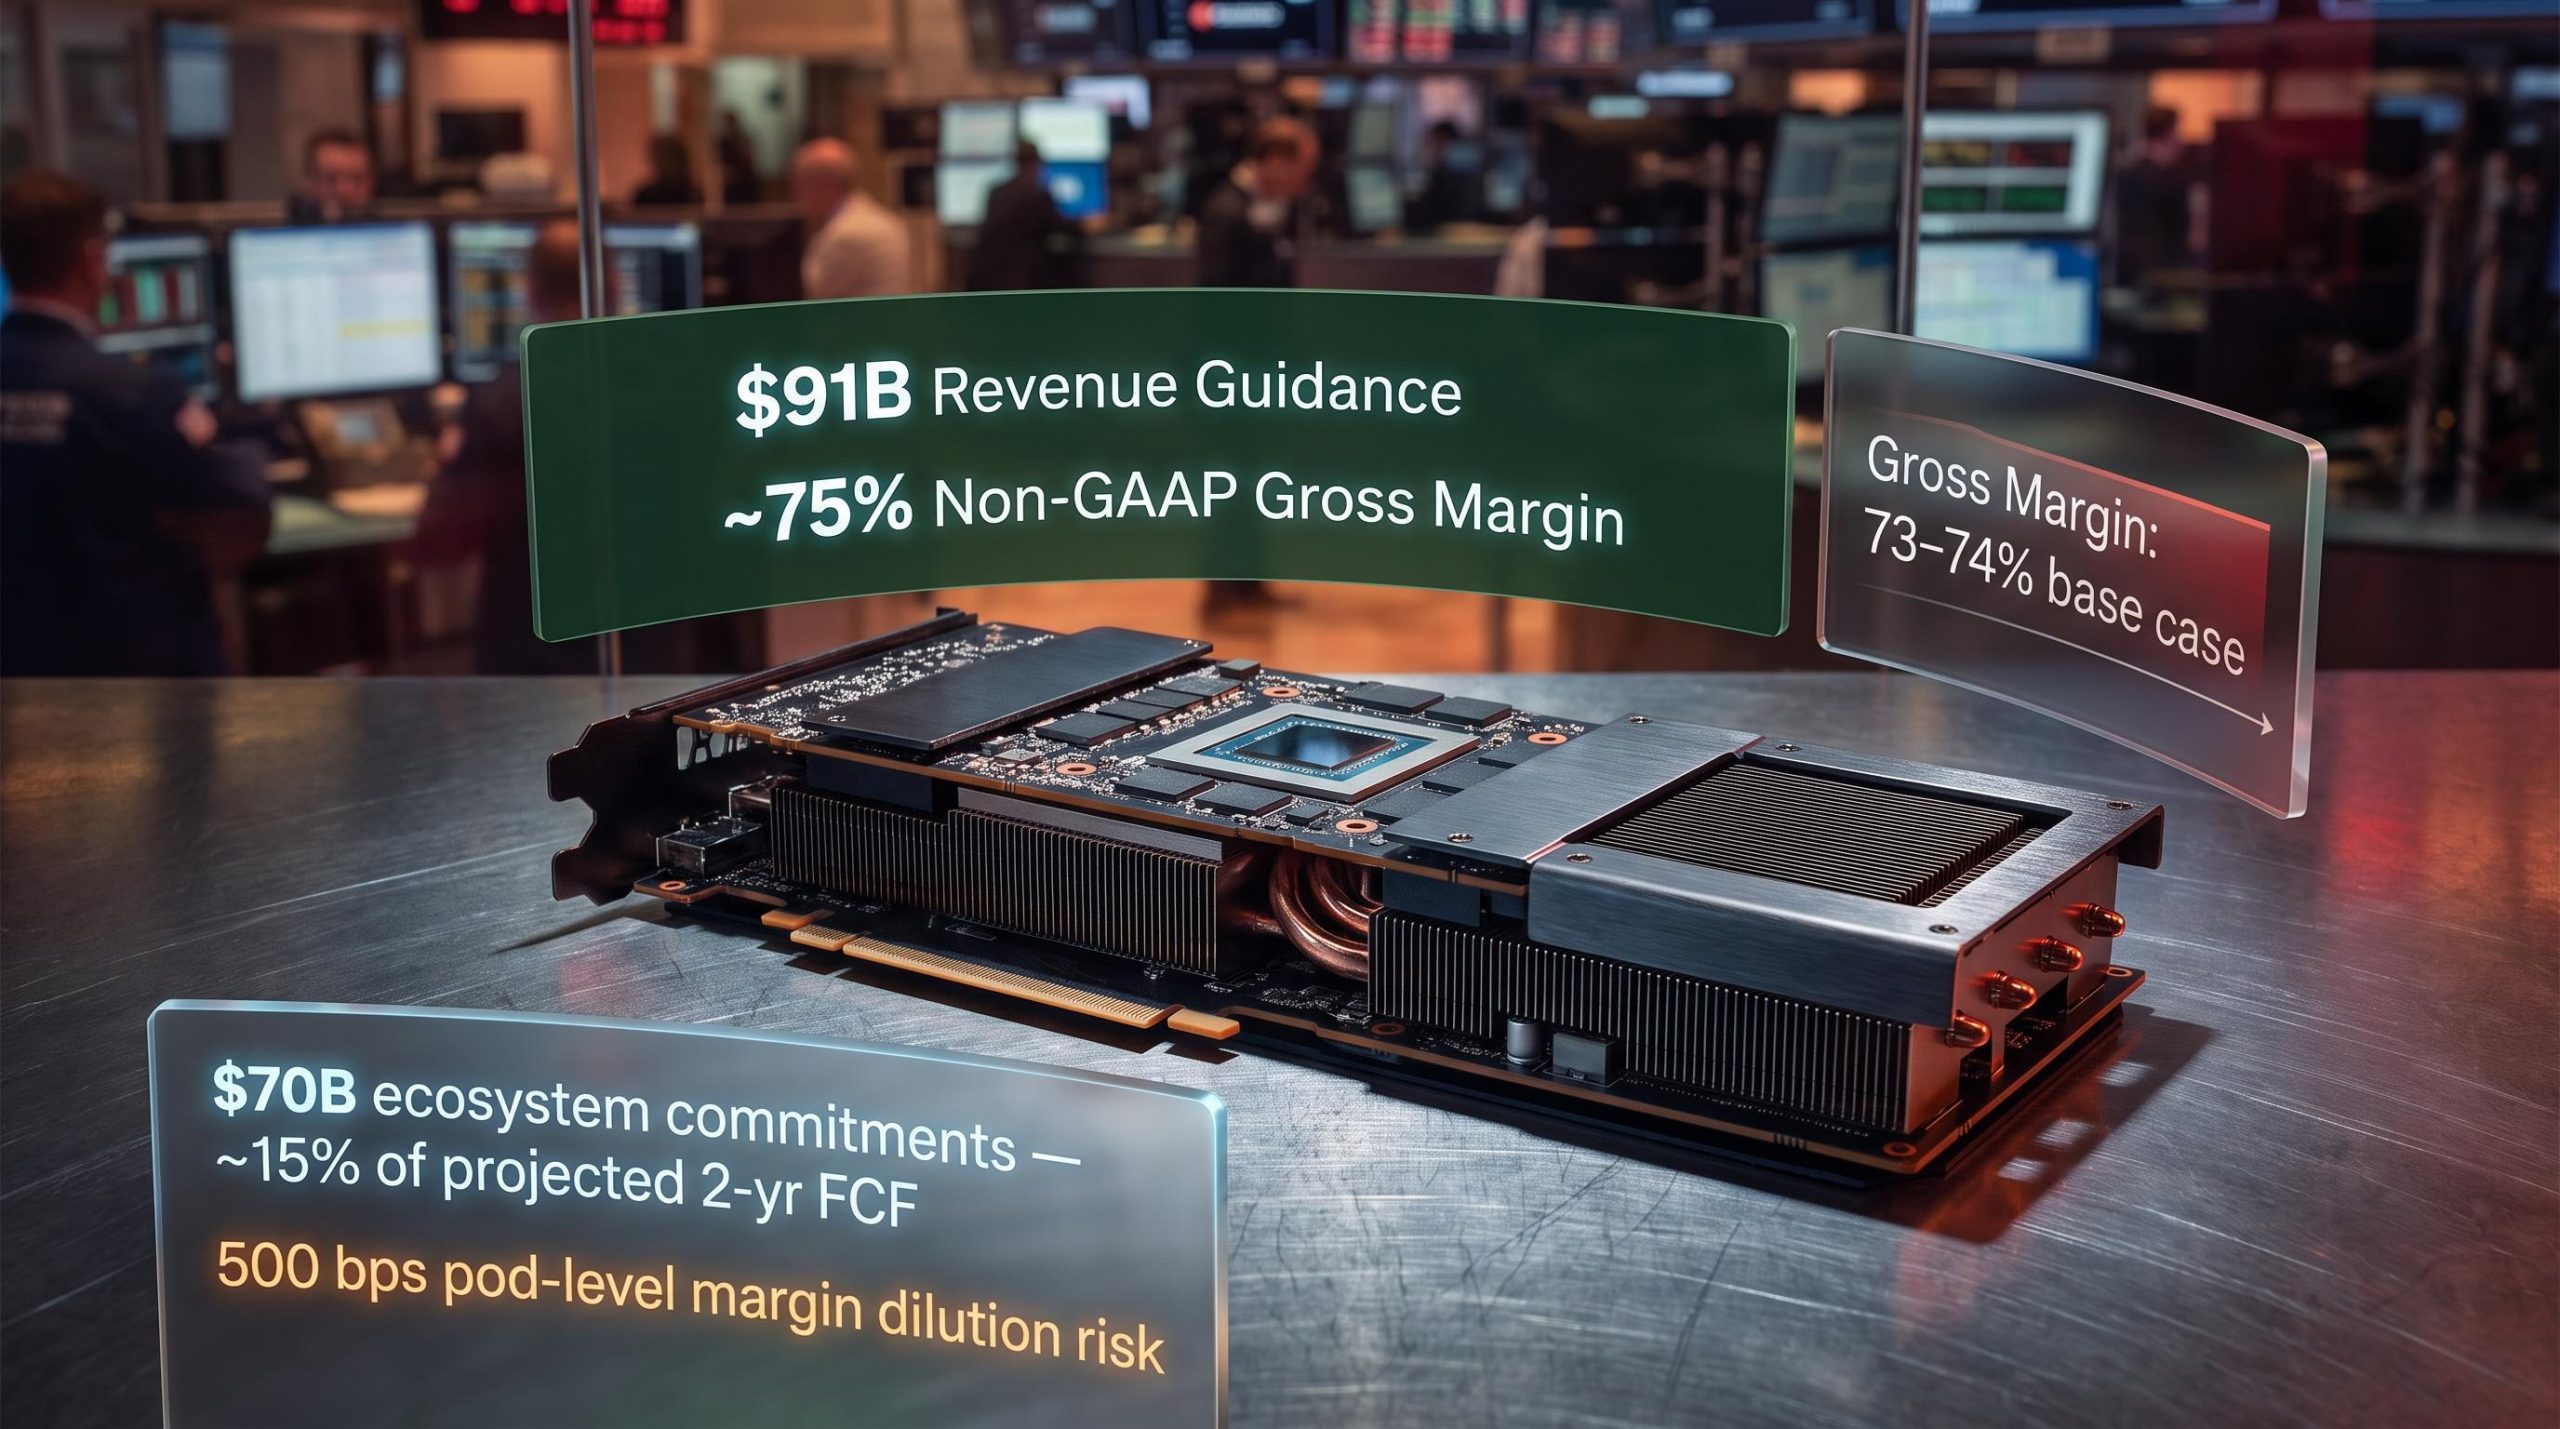
Nvidia is guiding roughly $91 billion in revenue and approximately 75% non-GAAP gross margins for fiscal Q2 2027. The headline story remains extraordinary. Two concerns have come to dominate pre-earnings conversations: whether rising memory costs will eat into hardware margins in a lasting way, and whether Nvidia’s roughly $70 billion in ecosystem equity positions amounts to a self-reinforcing demand loop. Bank of America has published a quantified framework addressing both concerns directly.
Here is what the memory and financing risks actually look like in numbers, what BofA’s counterarguments are, what remains unresolved, and what specific disclosures on August 26 will tell you whether the bear case is gaining or losing ground.
Why memory costs are getting more attention this cycle than any before it
In prior server generations, memory was a secondary cost line. You bought processors, you added DRAM, and memory pricing fluctuations moved your bill of materials by a few percentage points either way. That relationship has structurally changed.
High-bandwidth memory (HBM), the specialised DRAM designed to feed AI accelerators at the speeds they require, has become a core cost driver. The result is that memory now sits at the centre of GPU economics in a way it never did for CPUs.
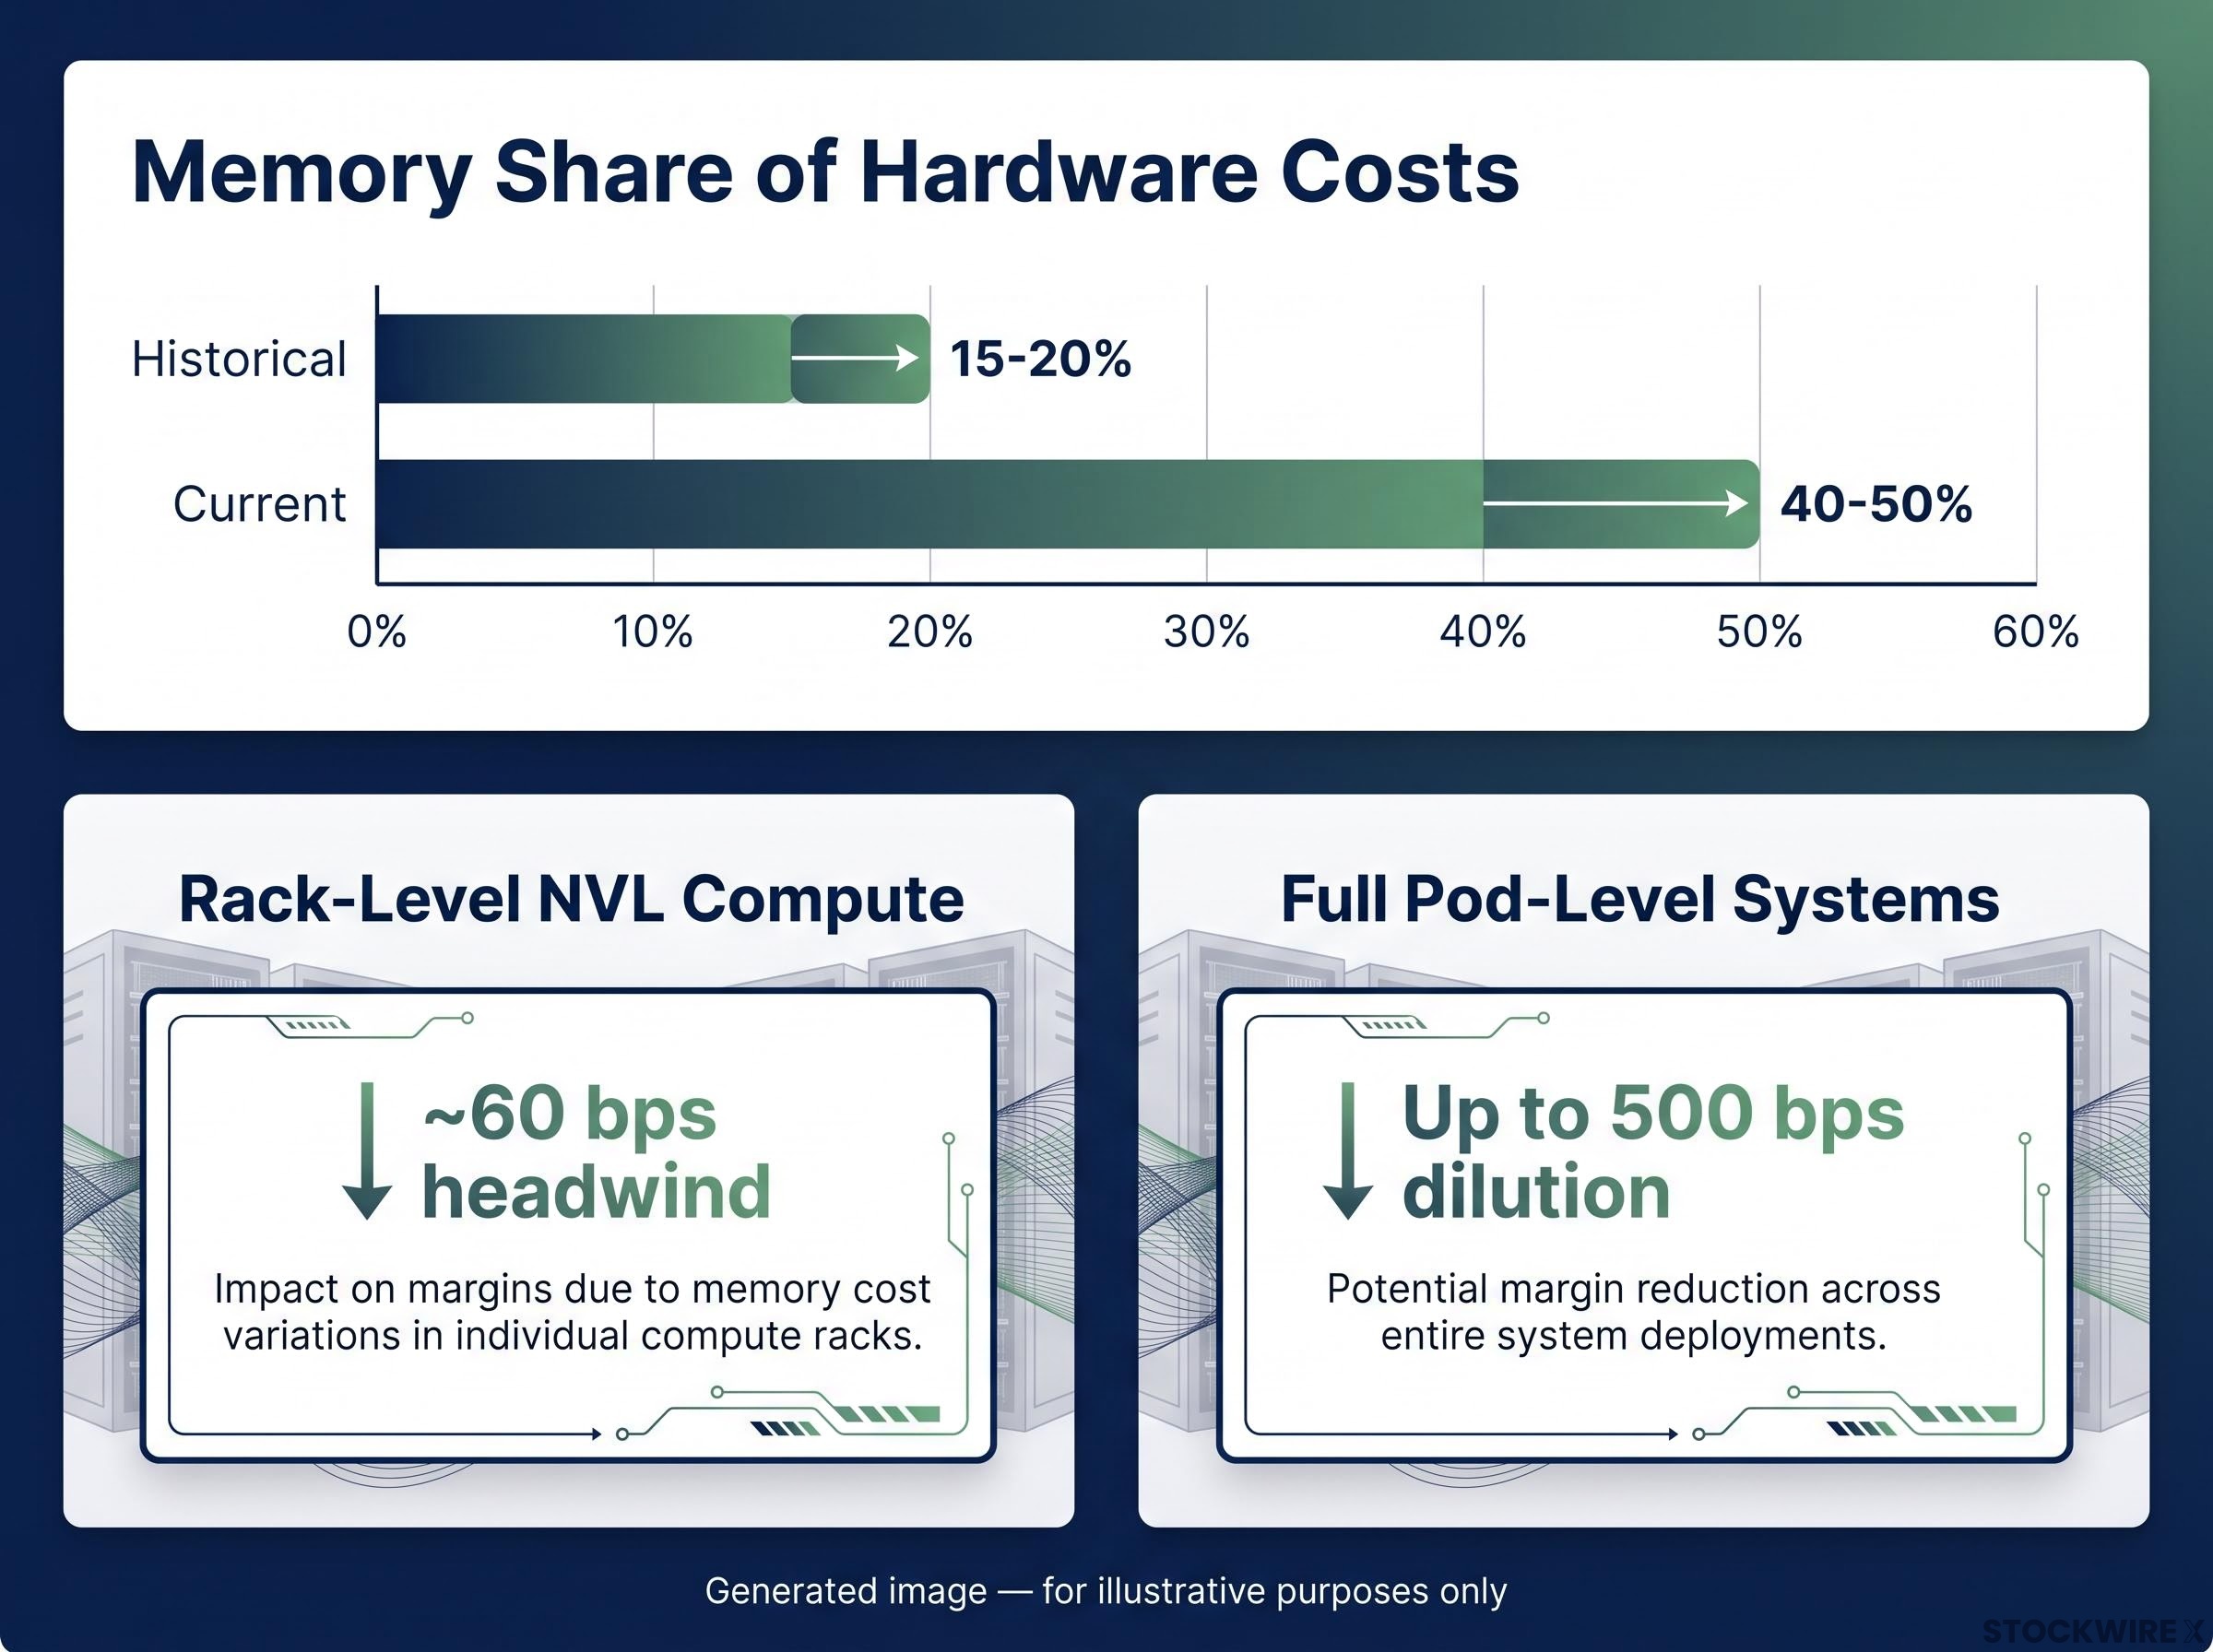
Memory now represents 40-50% of total hardware build costs, up from a historical range of 15-20%.
That is not a cyclical spike. It is a permanent feature of the AI hardware economics you are underwriting when you hold Nvidia. Consider the specifics:
The memory chip price forecast confirmed by S&P Global Ratings extends through at least 2028, with Samsung, SK Hynix, and Micron collectively redirecting roughly 89% of global DRAM supply toward high-margin HBM for AI customers — a capacity reallocation that structurally tightens commodity memory availability and reinforces why this shift is a permanent feature of AI hardware economics rather than a cyclical fluctuation.
- Historical memory share of hardware costs: 15-20%
- Current memory share: 40-50%
- Vera Rubin NVL rack configuration: combined HBM and LPDDR memory outlays come to roughly 12.7% of the total rack price, based on BofA’s proprietary modelling
- Preferred supplier advantage: SK Hynix cited as a preferred HBM supplier, giving Nvidia better pricing and allocation than commodity assemblers
That structural shift is why the margin conversation around this earnings cycle sounds different from anything investors have heard in prior server buildouts. Treating it as routine DRAM noise will lead you to misread what BofA’s margin scenarios actually mean.
When big ASX news breaks, our subscribers know first
How memory inflation actually translates into Nvidia’s gross margin math
BofA’s framework separates two system configurations, and the margin implications diverge sharply between them. The distinction matters more than the headline numbers.
For rack-level NVL compute configurations, BofA puts the gross margin headwind from elevated memory costs at around 60 basis points when measured against the current Blackwell Ultra generation. That is modest. At current guidance of approximately 75% non-GAAP gross margin, a 60-basis-point shift barely registers.
The picture changes when you move to full pod-level systems.
The pod-level scenario: when storage enters the equation
At pod scale, the system includes not just GPU racks but also networking, power infrastructure, and storage. When LPDDR and NAND storage components are included at full-pod scale, their combined weight in the cost structure becomes substantially heavier, and BofA’s modelling points to gross margin dilution of as much as 500 basis points.
That is an entirely different risk profile. In BofA’s view, this outcome sits firmly in tail-risk territory because full-pod shipment volumes are expected to stay limited in the near term, rather than representing a central forecast. But the 440-basis-point gap between the two scenarios tells you something important: product-mix trajectory, not the memory price itself, is the variable that will determine whether margin compression is modest or meaningful.
| Configuration | Primary memory cost driver | Estimated gross margin impact | Near-term volume expectation |
|---|---|---|---|
| Rack-level NVL compute | HBM + LPDDR | ~60 bps headwind | High (current generation) |
| Full pod-level systems | LPDDR + NAND storage at scale | Up to 500 bps dilution | Limited initial volumes |
BofA’s long-run base case sees gross margins settling into a 73-74% band, moderating from the roughly 75% level prevailing today. The word “drifting” matters more than the destination. This is normalisation, not a cliff. When you sit down to evaluate margin guidance on August 26, these two scenarios give you the range to work with rather than reacting to a single gross margin figure in isolation.
Gross margin sustainability near 75% was identified as the highest-priority signal in BofA’s prior Nvidia earnings framework, with HBM supply constraints from SK Hynix, Samsung, and Micron named as the structural cost headwind that revenue beats alone cannot neutralise — a framing that maps directly onto the rack-level versus pod-level divergence BofA now models for the August 26 print.
What Nvidia’s $70 billion ecosystem bet actually looks like against its cash generation
Seventy billion dollars is a large number. Against projected free cash flow (FCF), the money a company generates after all operating expenses and capital expenditure, it looks considerably more manageable.
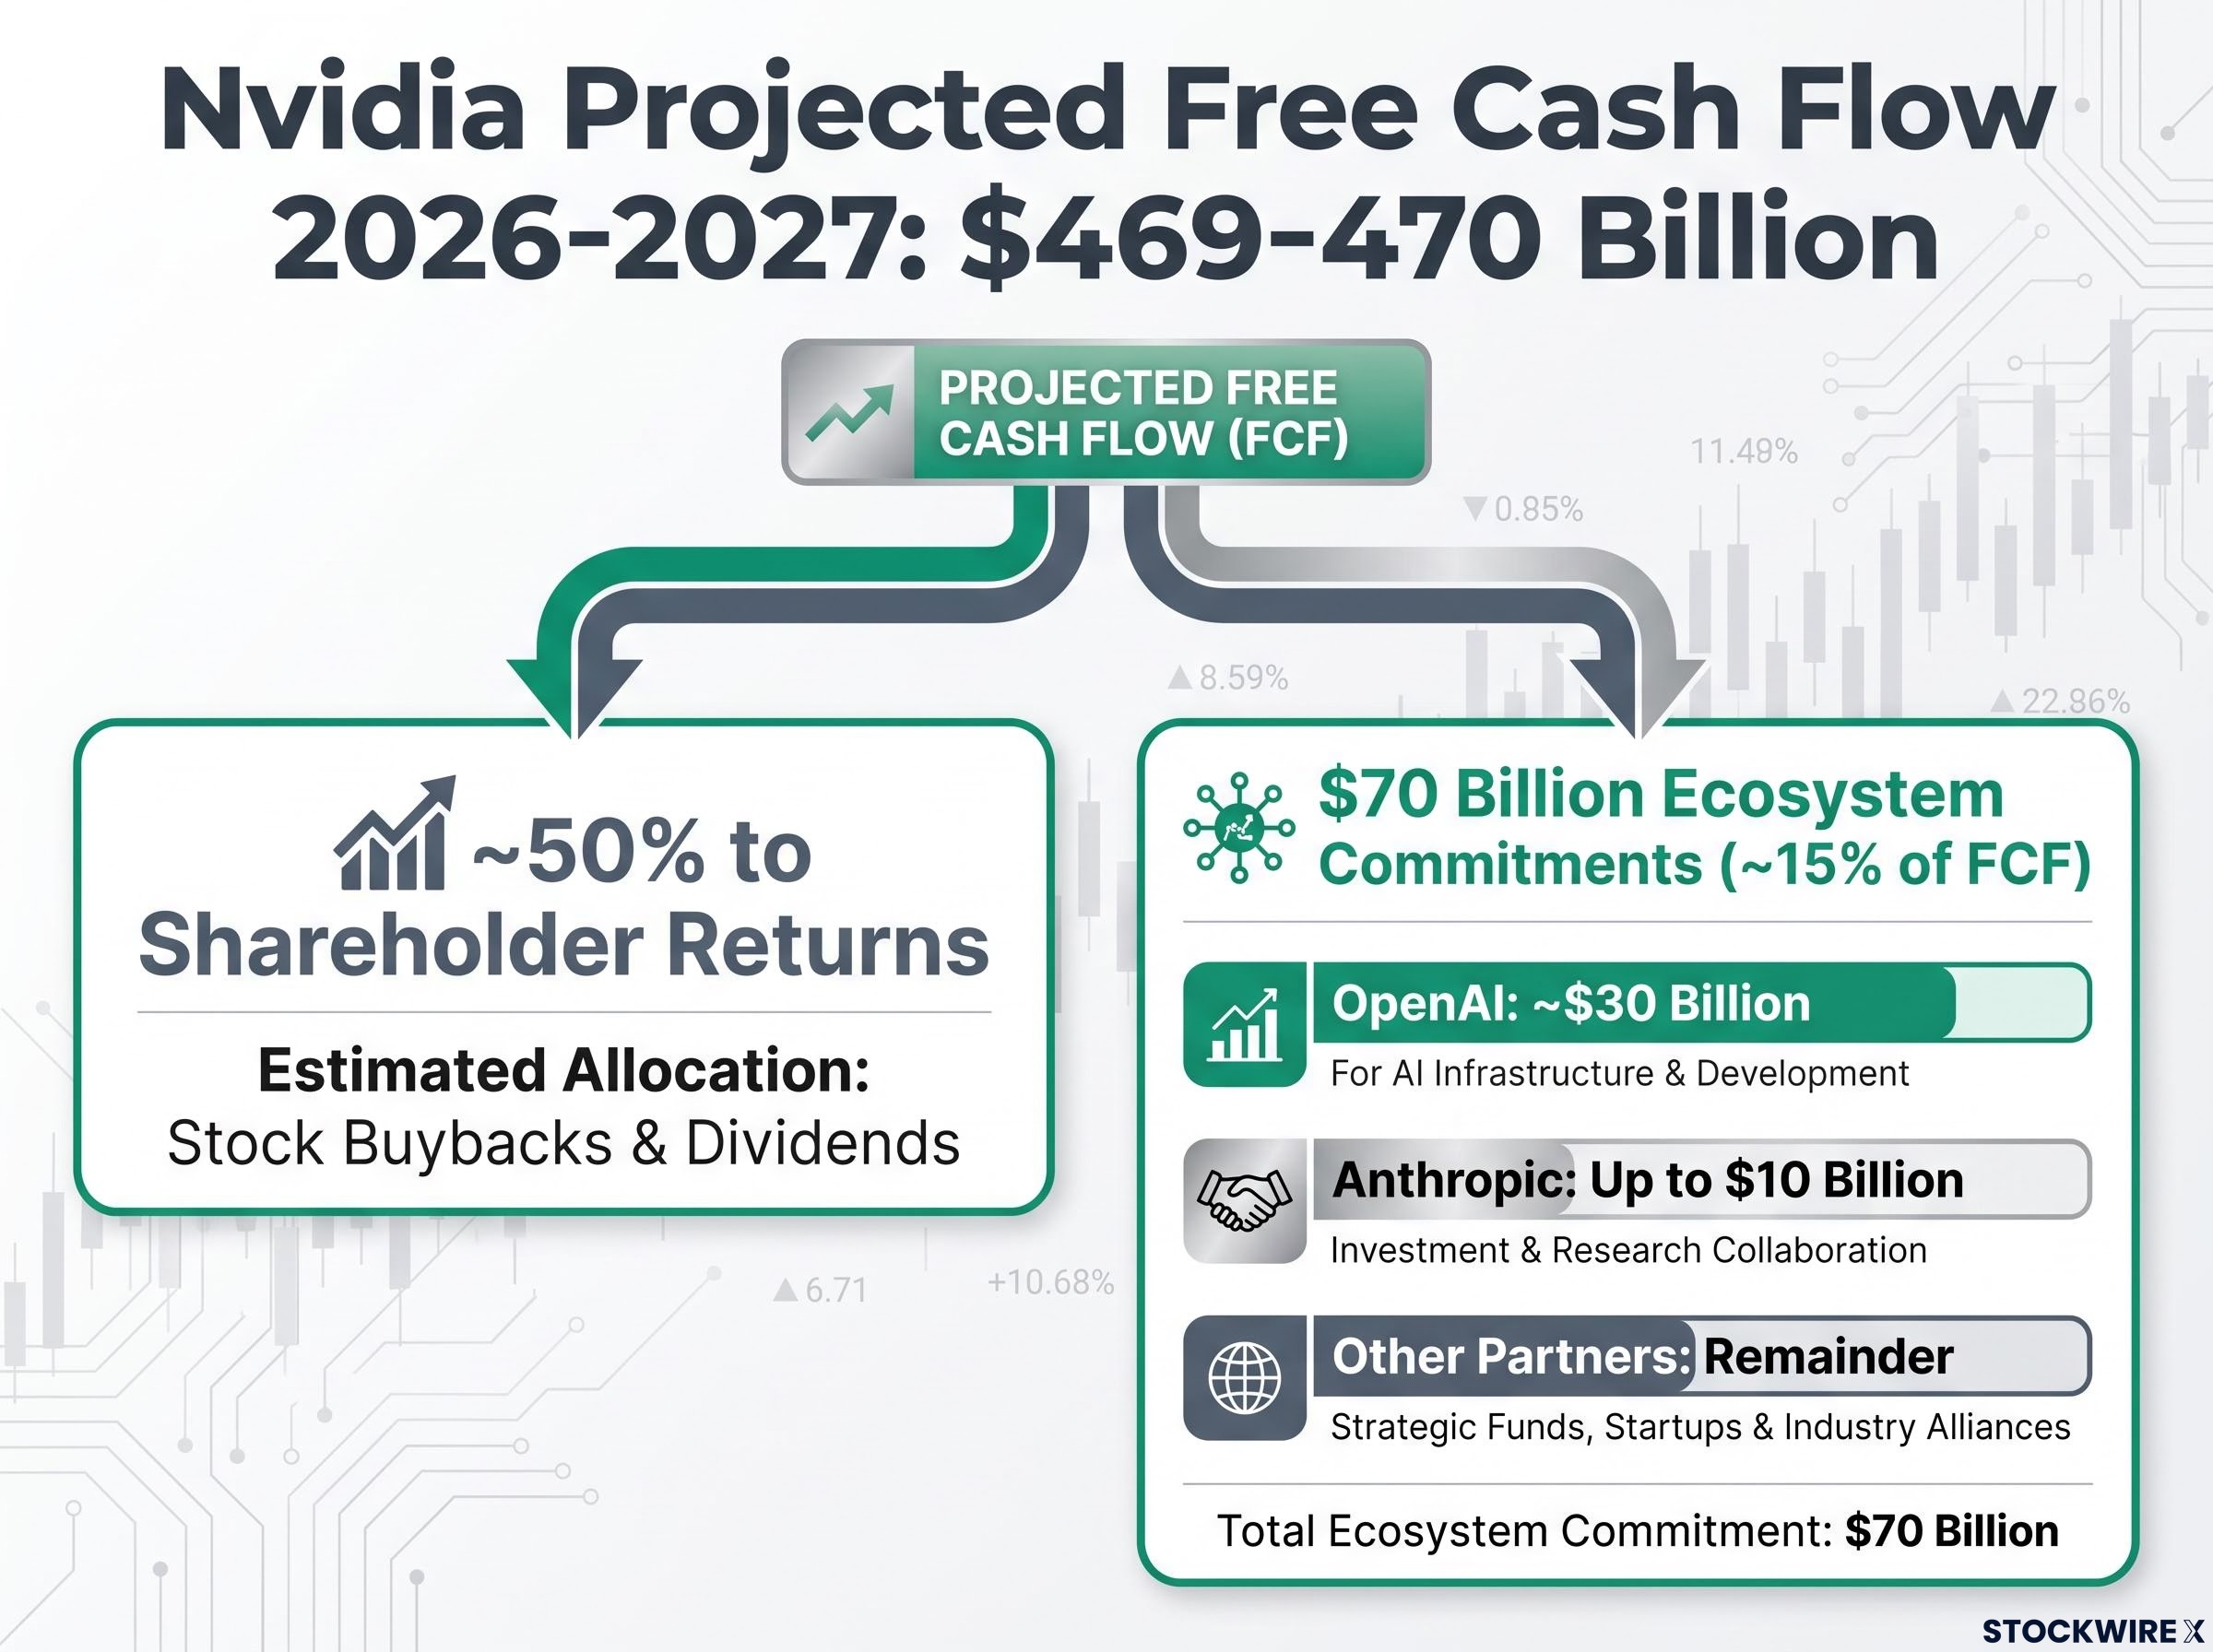
BofA estimates Nvidia’s ecosystem equity commitments at approximately $70 billion, representing roughly 15% of projected two-year free cash flow.
BofA projects Nvidia will produce around $469-470 billion in FCF across calendar years 2026 and 2027, and that denominator reshapes the picture considerably. Here is where the commitments sit:
Hyperscaler capex commitments of $600–$725 billion for 2026, with board-approved allocations from Amazon, Meta, Microsoft, and Alphabet already in place, form the demand backstory underpinning BofA’s $469–470 billion two-year FCF projection; any softening in that capex trajectory is the single variable that converts the 15% ecosystem commitment figure from manageable to pressured.
- OpenAI: approximately $30 billion
- Anthropic: up to $10 billion
- Other ecosystem partners: remainder of the $70 billion total
Nvidia has publicly committed to returning approximately 50% of FCF to shareholders. BofA’s view is that both obligations, ecosystem investment and shareholder returns, can be met simultaneously under current revenue assumptions.
That framing tells you these commitments are strategically heavy but financially manageable under the current trajectory. It also immediately moves the real question: what happens to those assumptions if AI infrastructure demand softens? The 15% figure is reassuring precisely as long as the revenue assumptions behind that $469-470 billion FCF projection hold.
The $250 billion OpenAI backstop: why the headline number and the actual risk are different things
External reporting indicates that Nvidia has reportedly provided around $250 billion in financial guarantees supporting OpenAI’s construction of a 10-gigawatt data centre in Ohio on a campus operated by SoftBank Energy. That number is designed to alarm. But the mechanics of how this guarantee works matter more than the size.
According to BofA’s analysis, the arrangement is structured as a contingent guarantee with back-loaded exposure rather than an immediate capital commitment, following the pattern of standard project-finance transactions. Project-finance guarantees have three structural characteristics that distinguish them from cash outlays:
- Contingent trigger: The guarantee is callable only under specific default conditions, not on demand.
- Long maturity profile: Exposure is spread over a timeframe that matches the data-centre lease, not concentrated in any single period.
- Asset-relative sizing: The guarantee is sized relative to the value of underlying physical infrastructure and expected cash flows, meaning recovery rates in a default scenario are typically higher than for unsecured obligations.
If structured like conventional infrastructure project finance, the expected economic cost to Nvidia is far lower than the $250 billion headline suggests.
Circular demand: the real version of the bear case
The genuine version of the circular-demand argument is not that Nvidia lends against each chip sold. Most of Nvidia’s exposure is via equity stakes in ecosystem companies, not traditional customer loans. Losses would show up as mark-to-market impairment on equity holdings, not as bad debt on hardware receivables.
The more precise concern is that financing arrangements make it nearly impossible to distinguish organic demand from engineered demand at Nvidia’s current valuation. The economic risk is better described as strategic and counterparty concentration in a small set of AI platforms, not a traditional vendor-financing loop.
What this means for you: price in concentration risk and conditional downside, not a near-term balance-sheet drain. Those are very different inputs to a valuation model.
Where the bear case retains genuine force despite BofA’s counterarguments
BofA’s framework addresses the headline numbers effectively. What it does not fully resolve is the structural fragility underneath them.
The bear case has shifted from “demand will fall” to “demand is circular.”
Three genuine risks survive BofA’s counterarguments:
- Product-mix acceleration: If AI customers adopt fully integrated pod-level systems faster than expected, the 500-basis-point dilution scenario stops being a tail risk and enters the base case. Margin guidance by product line on August 26 is the test.
- Demand-quality opacity: Even if the $70 billion is manageable against FCF, how much of the current order book is financed or guaranteed versus independently funded remains unanswered by BofA’s framing. That distinction matters because financed demand is contingent demand.
- Counterparty concentration amplification: A deterioration in OpenAI’s or another key partner’s financial health would simultaneously hit chip demand and investment or guarantee valuations. Nvidia’s obligations to AI partners reportedly could reach hundreds of billions when guarantees are included. This correlated downside, where revenue and the investment portfolio face the same stress at the same time, is not captured by standard valuation multiples.
The bear case that retains genuine traction is not that memory costs will collapse margins. It is that a meaningful fraction of Nvidia’s demand pipeline may be contingent on Nvidia’s own financing, which means the company’s revenue and its equity portfolio face correlated downside in a stress scenario.
The correlated-downside risk intensifies when viewed alongside the custom silicon competition emerging from Nvidia’s own largest customers: Alphabet, Amazon, and Microsoft are each funding purpose-built inference chips in the segment projected to represent 80% of the AI accelerator market by 2030, meaning a demand slowdown could simultaneously pressure GPU order volumes and the equity valuations of ecosystem partners Nvidia has committed billions to support.
What the August 26 call will actually tell investors about which scenario is unfolding
Pre-earnings analysis has limited value unless it translates into specific questions. Here are the three disclosure categories that will determine whether BofA’s optimistic case or the bear’s correlated-downside scenario is closer to reality:
- Margin guidance by product line: Updated gross margin guidance and any commentary on memory and system-level cost trends by configuration type. The rack-level versus pod-level distinction is the margin story.
- Demand composition by financing structure: Any breakdown of data-centre order-book composition by customer segment, and specifically how much demand is backed by Nvidia-linked financing versus independent customer cash flows.
- Guarantee-specific disclosures: Clarification of the scale, triggers, and duration of guarantees tied to OpenAI and other partners, particularly whether the $250 billion backstop has the contingent, asset-backed structure BofA assumes.
The current baseline comparators are approximately $91 billion in revenue and approximately 75% non-GAAP gross margin. Nvidia confirmed August 26 as the fiscal Q2 2027 earnings release date.
| Bear-case risk | August 26 disclosure that confirms or alleviates it |
|---|---|
| Product-mix margin compression | Gross margin guidance by configuration type and pod-level shipment volume commentary |
| Demand-quality opacity | Breakdown of financed vs. independently funded data-centre orders |
| Counterparty concentration | Disclosure of total guarantee scale, trigger conditions, and maturity profiles |
If management provides no breakdown of financed versus independently funded data-centre demand, treat that opacity itself as a signal. BofA’s manageable-risk framing depends entirely on organic demand being the dominant force.
A calibrated read: what the data says the real risk level is before August 26
BofA’s two reframings hold up under scrutiny on their own terms. Memory cost inflation points to modest margin normalisation toward 73-74%, not a structural break. At roughly 15% of the projected two-year FCF figure, the $70 billion in ecosystem commitments does not constitute a balance-sheet emergency under current assumptions.
What survives those arguments is concentration risk and demand-quality ambiguity. The base case is a gradual margin drift, strategic capital tied to a small AI ecosystem, and an earnings call that will resolve the demand-quality question one way or another.
The data points to manageable, not negligible, risk. Investors who go into August 26 understanding both BofA’s reframing and the correlated-downside scenario that remains are better positioned than those reacting to either headline numbers or sell-side reassurance alone.
This article is for informational purposes only and should not be considered financial advice. Investors should conduct their own research and consult with financial professionals before making investment decisions. Past performance does not guarantee future results. Financial projections are subject to market conditions and various risk factors.