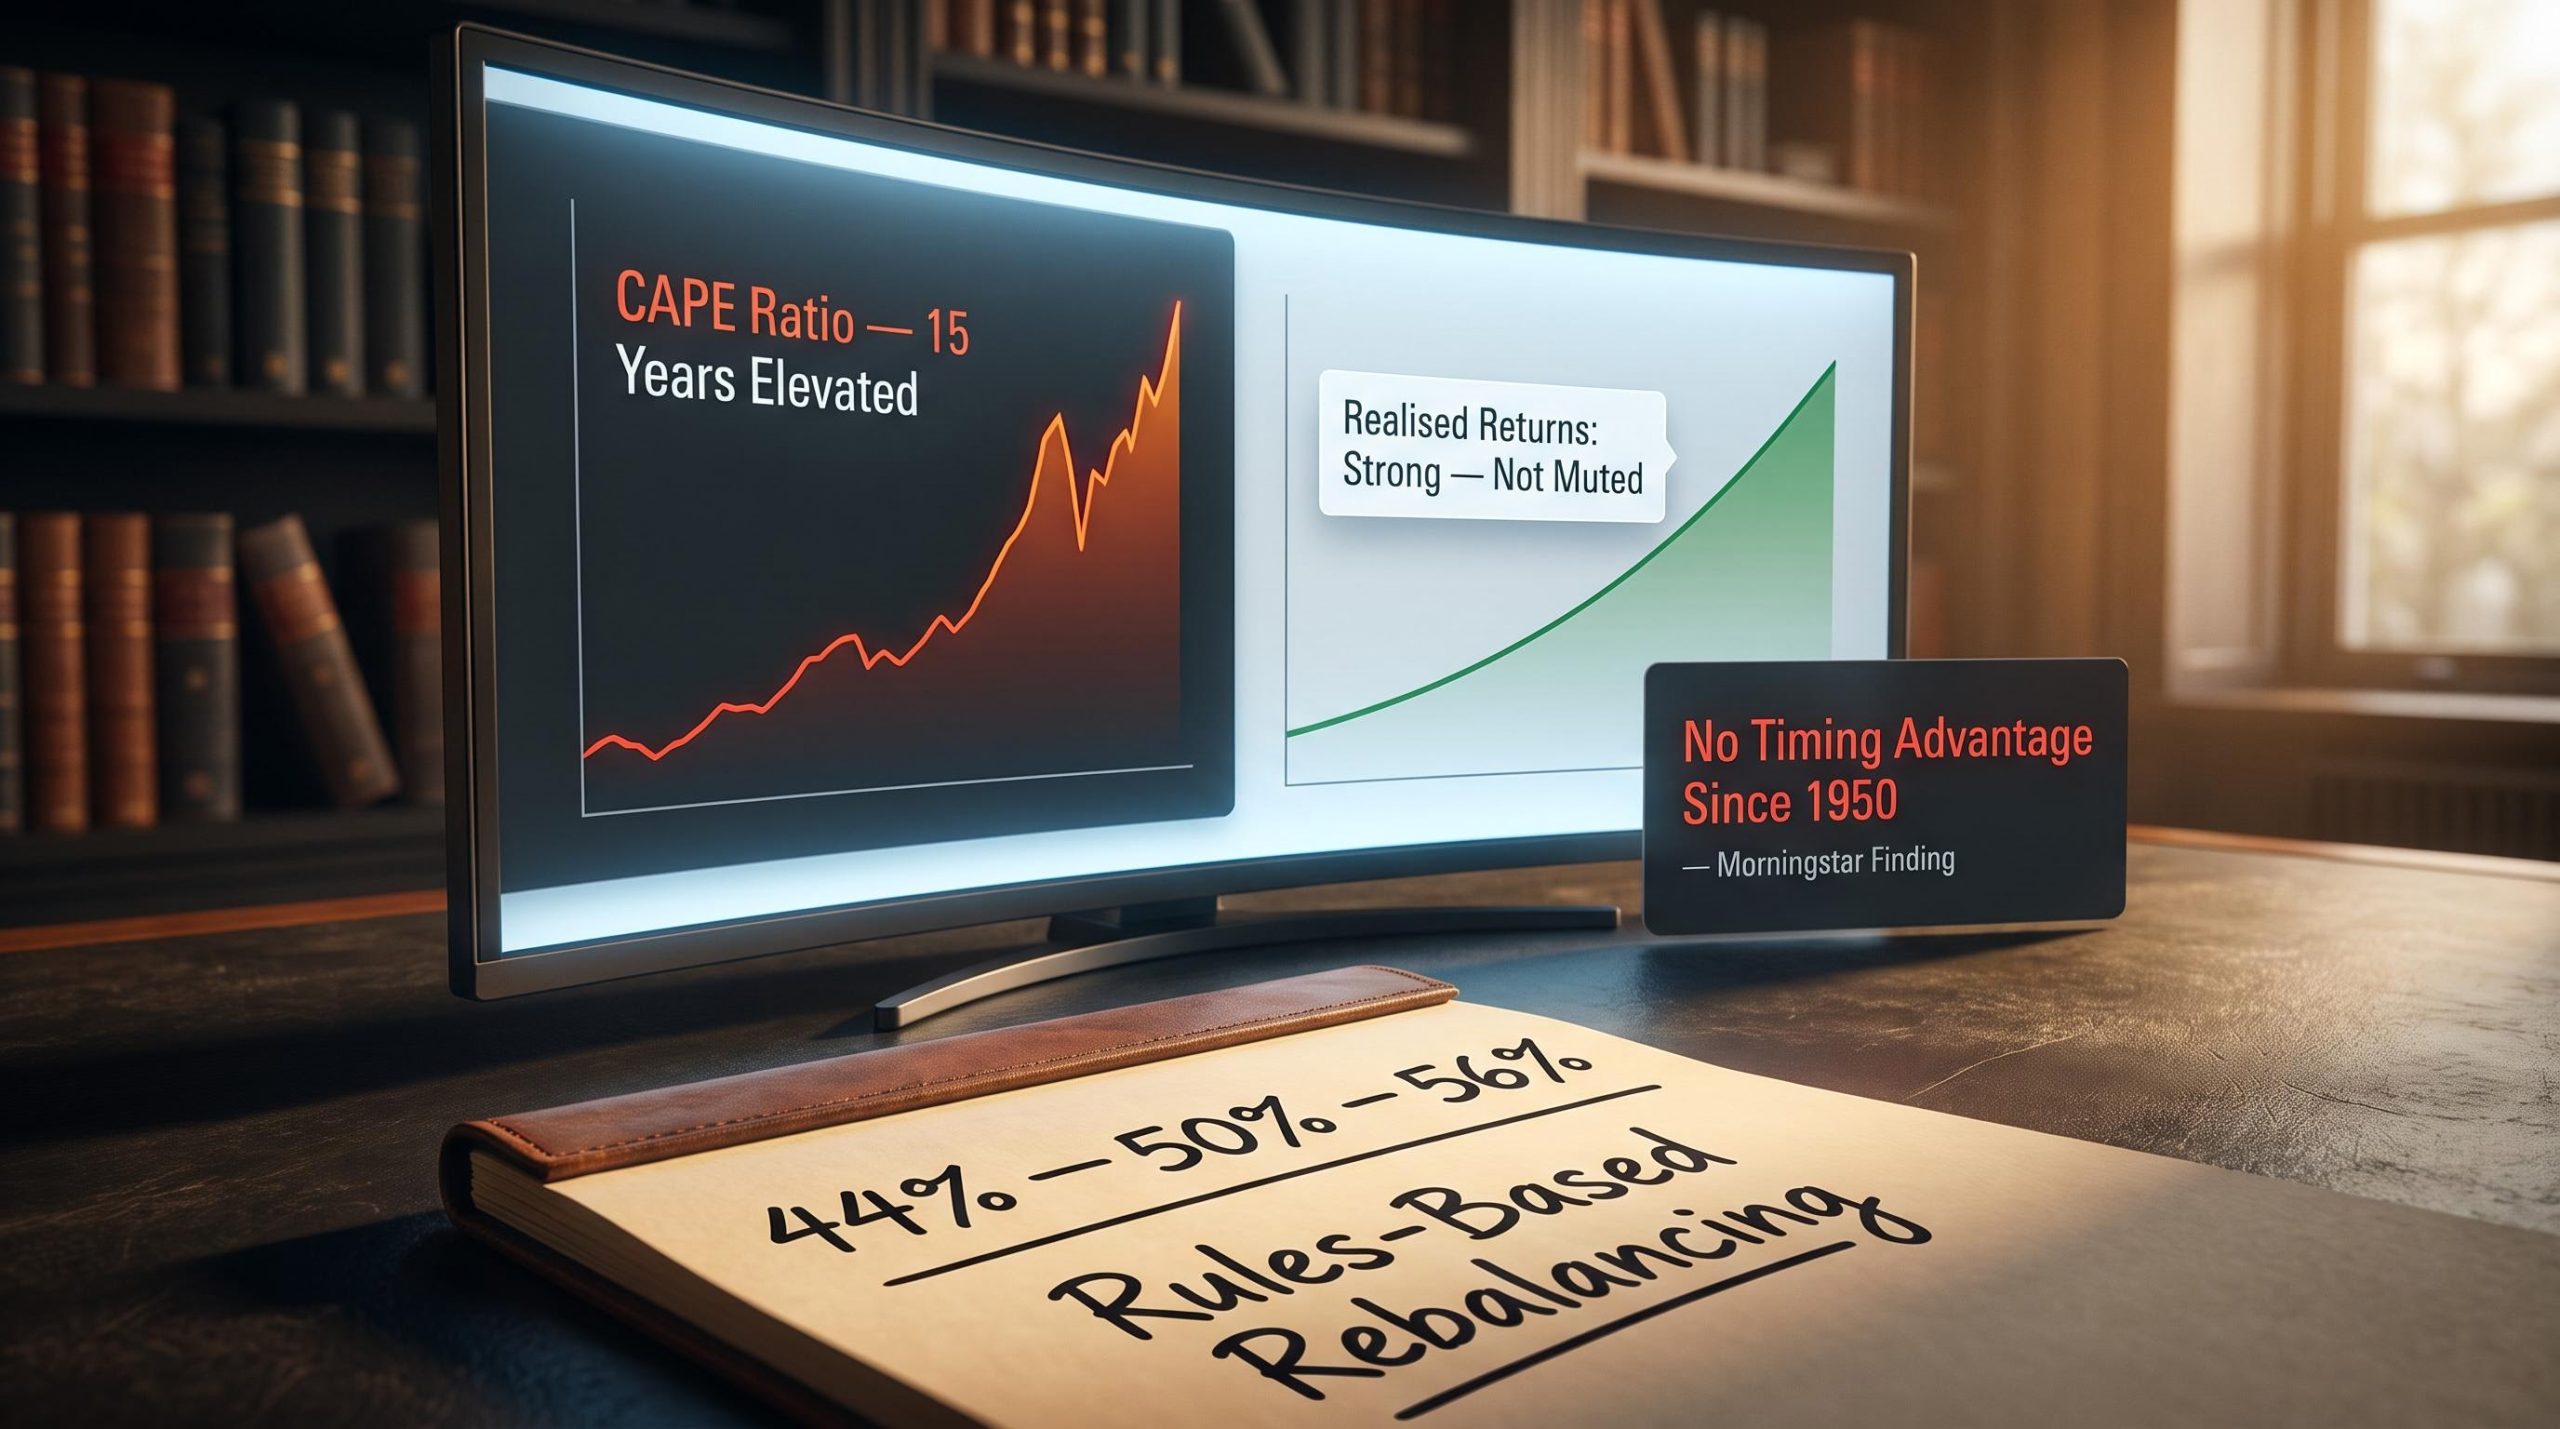
Investors who trusted the CAPE ratio to tell them when to exit equities over the past 15 years paid a steep price for that trust. Not because the metric is broken; it was designed by a Nobel laureate and has genuine academic pedigree. The cost came from misreading what the tool was built to do.
The CAPE ratio carries real informational value over long horizons. That is precisely what makes it dangerous when investors treat it as a timing trigger. A valuation measure that is informative over decades but unreliable over quarters, or even years, is the kind of instrument that rewards patience and punishes action.
Here is the fork in the road: the evidence on using valuation signals to adjust your allocation sits on one side, and a rules-based portfolio rebalancing strategy sits on the other. By the time you finish this, you will know which approach the data supports, and what that means for how you manage your own portfolio from this point forward.
What the CAPE ratio actually measures (and what it does not)
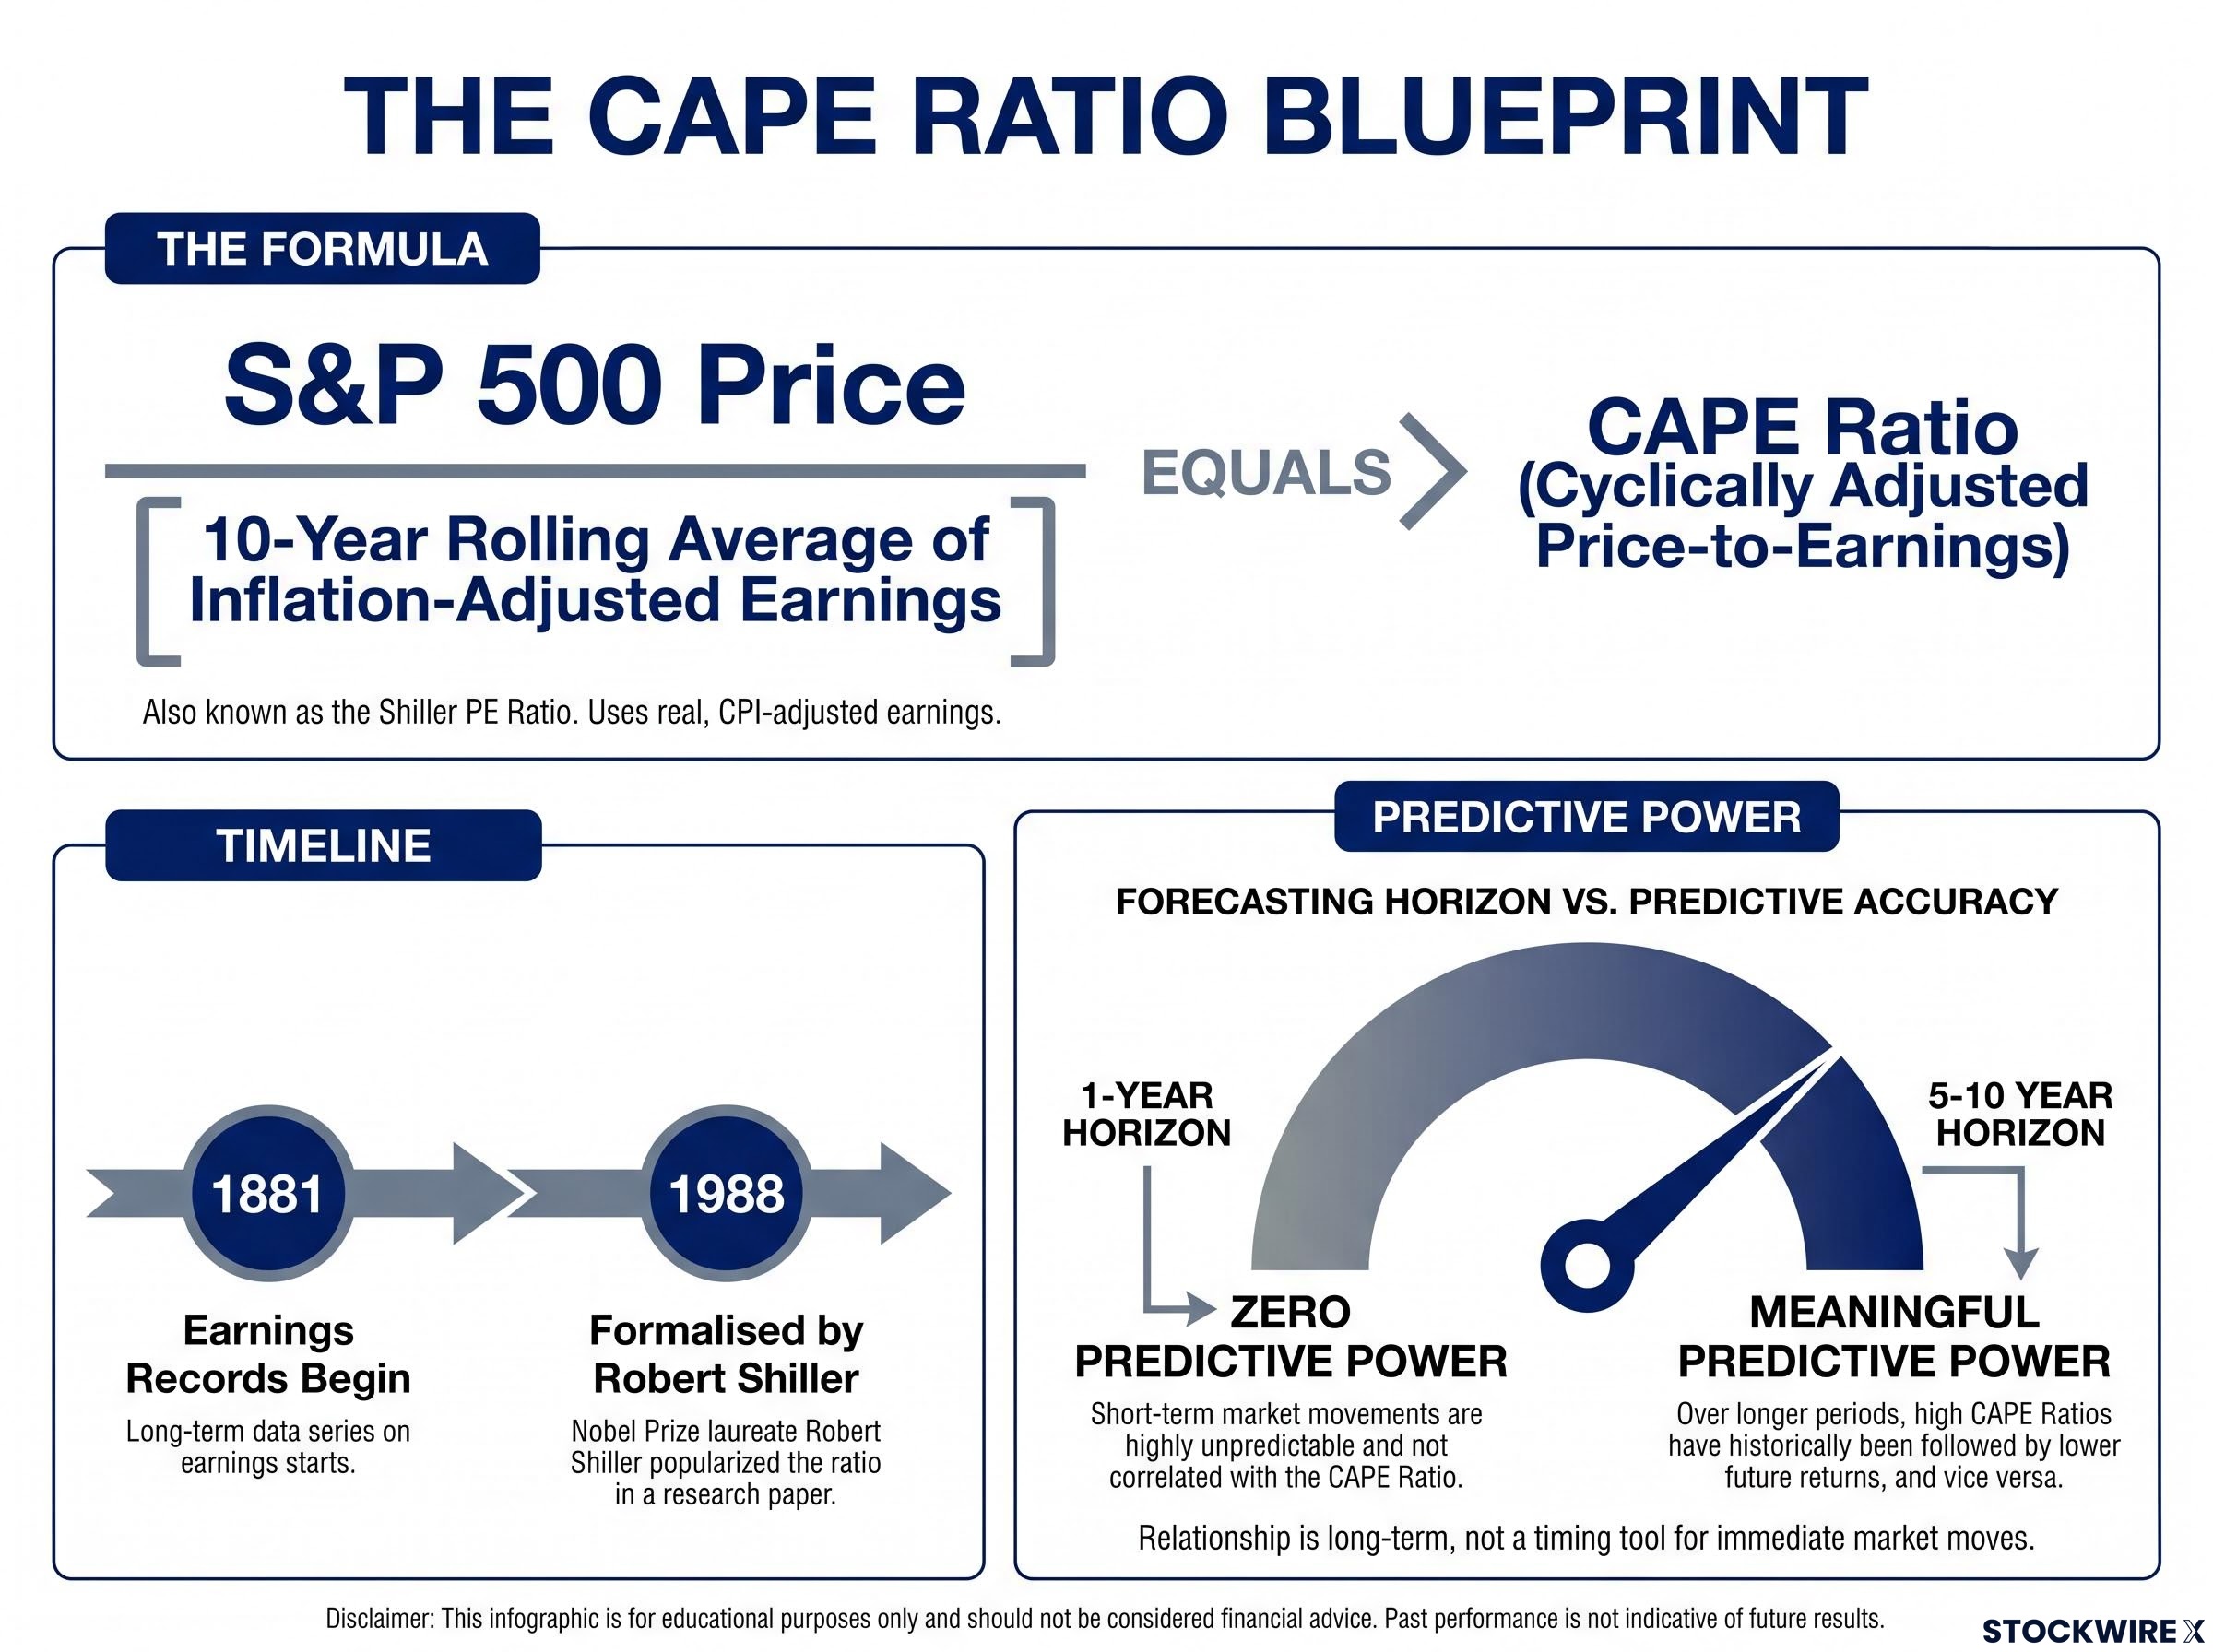
The CAPE ratio, sometimes called the Shiller P/E, takes the current S&P 500 price level and divides it by a 10-year rolling average of inflation-adjusted earnings per share. The logic is straightforward: averaging real earnings across a full decade smooths out business-cycle noise and gives a more stable read on long-term earning power than a standard one-year P/E ratio.
Robert Shiller, the Nobel laureate economist behind the metric, constructed it using earnings records stretching back to 1881, with the framework formalised in 1988. Multiple studies confirm that higher CAPE readings tend to be associated with lower subsequent average returns over 5-10 year windows.
AAII analysis of CAPE predictive horizons confirms the graduated relationship between valuation readings and returns: the signal weakens sharply at one-year windows and strengthens progressively across five-to-twenty year periods, which is precisely the asymmetry that makes CAPE a legitimate long-run gauge but an unreliable tactical trigger.
But here is where the crack appears. Shiller himself has stated that CAPE “was never intended to indicate exactly when to buy and to sell.” Research finds essentially zero predictive power over 1-year horizons. The metric tells you something meaningful about the next decade. It tells you almost nothing about the next quarter.
Three properties define CAPE’s design and its limits:
- Smoothing method: 10-year inflation-adjusted earnings average, designed to filter business-cycle noise
- Documented predictive horizon: 5-10 year average returns, not 1-year or 3-year outcomes
- Shiller’s own stated intent: a valuation gauge, not a buy/sell signal
The variants that tried to fix the original
Practitioners have tried to improve on the original. Research Affiliates developed the CC CAPE ratio, a modified version that adjusts for structural changes in earnings composition. The excess CAPE yield, defined as one divided by the CAPE ratio minus the real 10-year bond yield, attempts to contextualise equity valuations against bond alternatives.
Both refinements are worth knowing. Neither solves the timing problem. Both still rely on backtested data and face the same limitation: they describe valuation levels, not when to act on them.
The forward P/E versus CAPE divergence in the current AI-driven rally, where the two metrics expanded by very different magnitudes since 2022, illustrates precisely why CAPE’s 10-year earnings smoothing produces a signal that is structurally incompatible with near-term allocation timing.
When big ASX news breaks, our subscribers know first
Fifteen years of elevated readings, fifteen years of strong returns
Since the early 2010s, CAPE has persistently signalled above-average valuations. Commentators translated those readings into warnings: expect muted future equity returns. Reduce exposure. Wait for valuations to normalise.
The market did not cooperate. Realised equity returns over that period were strong, not muted. The gap between the model’s implied signal and what investors actually experienced widened year after year. Every month spent waiting for the ratio to revert was another month of compounding missed.
The institutional record on this is unflattering. Research Affiliates documented that tactical strategies based on absolute CAPE thresholds “have been almost uniformly unsuccessful,” missing long bull runs while waiting for valuations to normalise. Morningstar ran a backtest spanning more than 100 years and found that CAPE-based timing showed only a small advantage over buy-and-hold, entirely driven by pre-1950 data. Since 1950, there was no advantage, and taxable investors were actively harmed by the strategy’s realised gains.
| Source | Time Period Studied | Key Finding | Implication for Timing Strategies |
|---|---|---|---|
| Research Affiliates | Multiple decades | Absolute-CAPE tactical strategies “almost uniformly unsuccessful” | Missed long bull runs while waiting for normalisation |
| Morningstar | 100+ years (focus post-1950) | No timing advantage since 1950; active harm to taxable investors | Tax drag erased any theoretical benefit |
| CAIA | Multiple decades | CAPE timing effectiveness “largely questionable” | Binary buy/sell rules based on CAPE would have been “disastrous” |
| Quantpedia / CXO Advisory | Multiple decades | Timing rules not beneficial except at highest CAPE decile | CAPE lacks a stable average, undermining threshold-based rules |
“When it comes to market timing, CAPE effectiveness is largely questionable,” the CAIA review concluded, noting that blindly translating CAPE into buy/sell orders would have been “disastrous.”
That gap between what CAPE implied and what investors actually experienced is not a historical curiosity. It is a direct measure of opportunity cost, the returns a rule-following investor surrendered by acting on a signal that was never designed for timing.
Why investors keep reaching for the forecast anyway
If the evidence against CAPE-based timing is this clear, why does the impulse persist?
Because pattern-seeking is wired into how human brains work. Jason Zweig, the author of the Intelligent Investor column at The Wall Street Journal, has written about humanity’s deeply ingrained compulsion to forecast, describing it as an addiction rooted in how the brain processes uncertainty. Our minds are built to detect patterns, and when markets move in any direction, that circuitry demands a causal explanation and a prediction about what follows.
Zweig’s observation captures the core problem: prediction feels like analysis, and the mathematical packaging of a model like CAPE reinforces that illusion, even when the model is doing the same thing as informal opinion, projecting historical patterns forward.
The appeal of formal models is specific: mathematical framing creates an illusion of precision that informal prediction does not, even though both carry similar limitations. Stock prices reflect the aggregated information and judgment of all market participants, making systematic outperformance through timing very difficult.
Three failure modes explain why timing decisions built on CAPE (or any valuation signal) tend to disappoint:
Sell decision biases, including the disposition effect and loss aversion, concentrate at exactly the moments when CAPE-based timing rules are most likely to fire, meaning the investor who acts on a valuation signal is also the investor most exposed to the behavioural traps that random exit strategies systematically avoid.
- The cognitive trap: Pattern-seeking brains treat any plausible model as actionable, conflating description with prescription
- The statistical fragility: Even statistically significant long-run predictors like CAPE carry wide confidence intervals, making binary in/out decisions fragile over typical investor horizons
- The execution problem: A correct exit decision is only half the task; missing the recovery, which often clusters near the worst days, is frequently more damaging than avoiding part of the downturn
Black Monday in October 1987, when the market fell more than 20% in a single day, illustrates the point sharply. CAPE was not at extreme highs. The decline arrived without the signal that was supposed to warn investors. Timing triggers can fail at precisely the moments they matter most.
The mechanism is clear: a sophisticated, research-backed metric can still lead a disciplined investor to make a worse decision than simply staying the course. Recognising that mechanism is the prerequisite for choosing a different process.
How a rules-based rebalancing process actually works
A rules-based rebalancing strategy replaces forecasting with mechanics. The framework below, attributed to Allan Roth, CPA, founder of Wealth Logic, LLC, illustrates how a concrete, repeatable set of rules operates in practice.
Portfolio drift after equity gains is the mechanical precondition that makes rebalancing rules actionable: without measuring how far your allocation has moved from its target, the tolerance band framework has no starting point.
- Set a target allocation. Roth’s illustrative example uses a 50/50 stocks-to-bonds split. The specific ratio matters less than the commitment to one.
- Define tolerance bands. A band of plus or minus 6 percentage points around each target. Equities can drift between 44% and 56% before a trigger fires.
- Execute trades when bands are breached. If equities rise above 56%, sell equities and buy bonds to restore the target. If they fall below 44%, sell bonds and buy equities.
The rule makes no forecast. It requires no opinion about CAPE, the Federal Reserve, or macroeconomic conditions. It simply responds to drift.
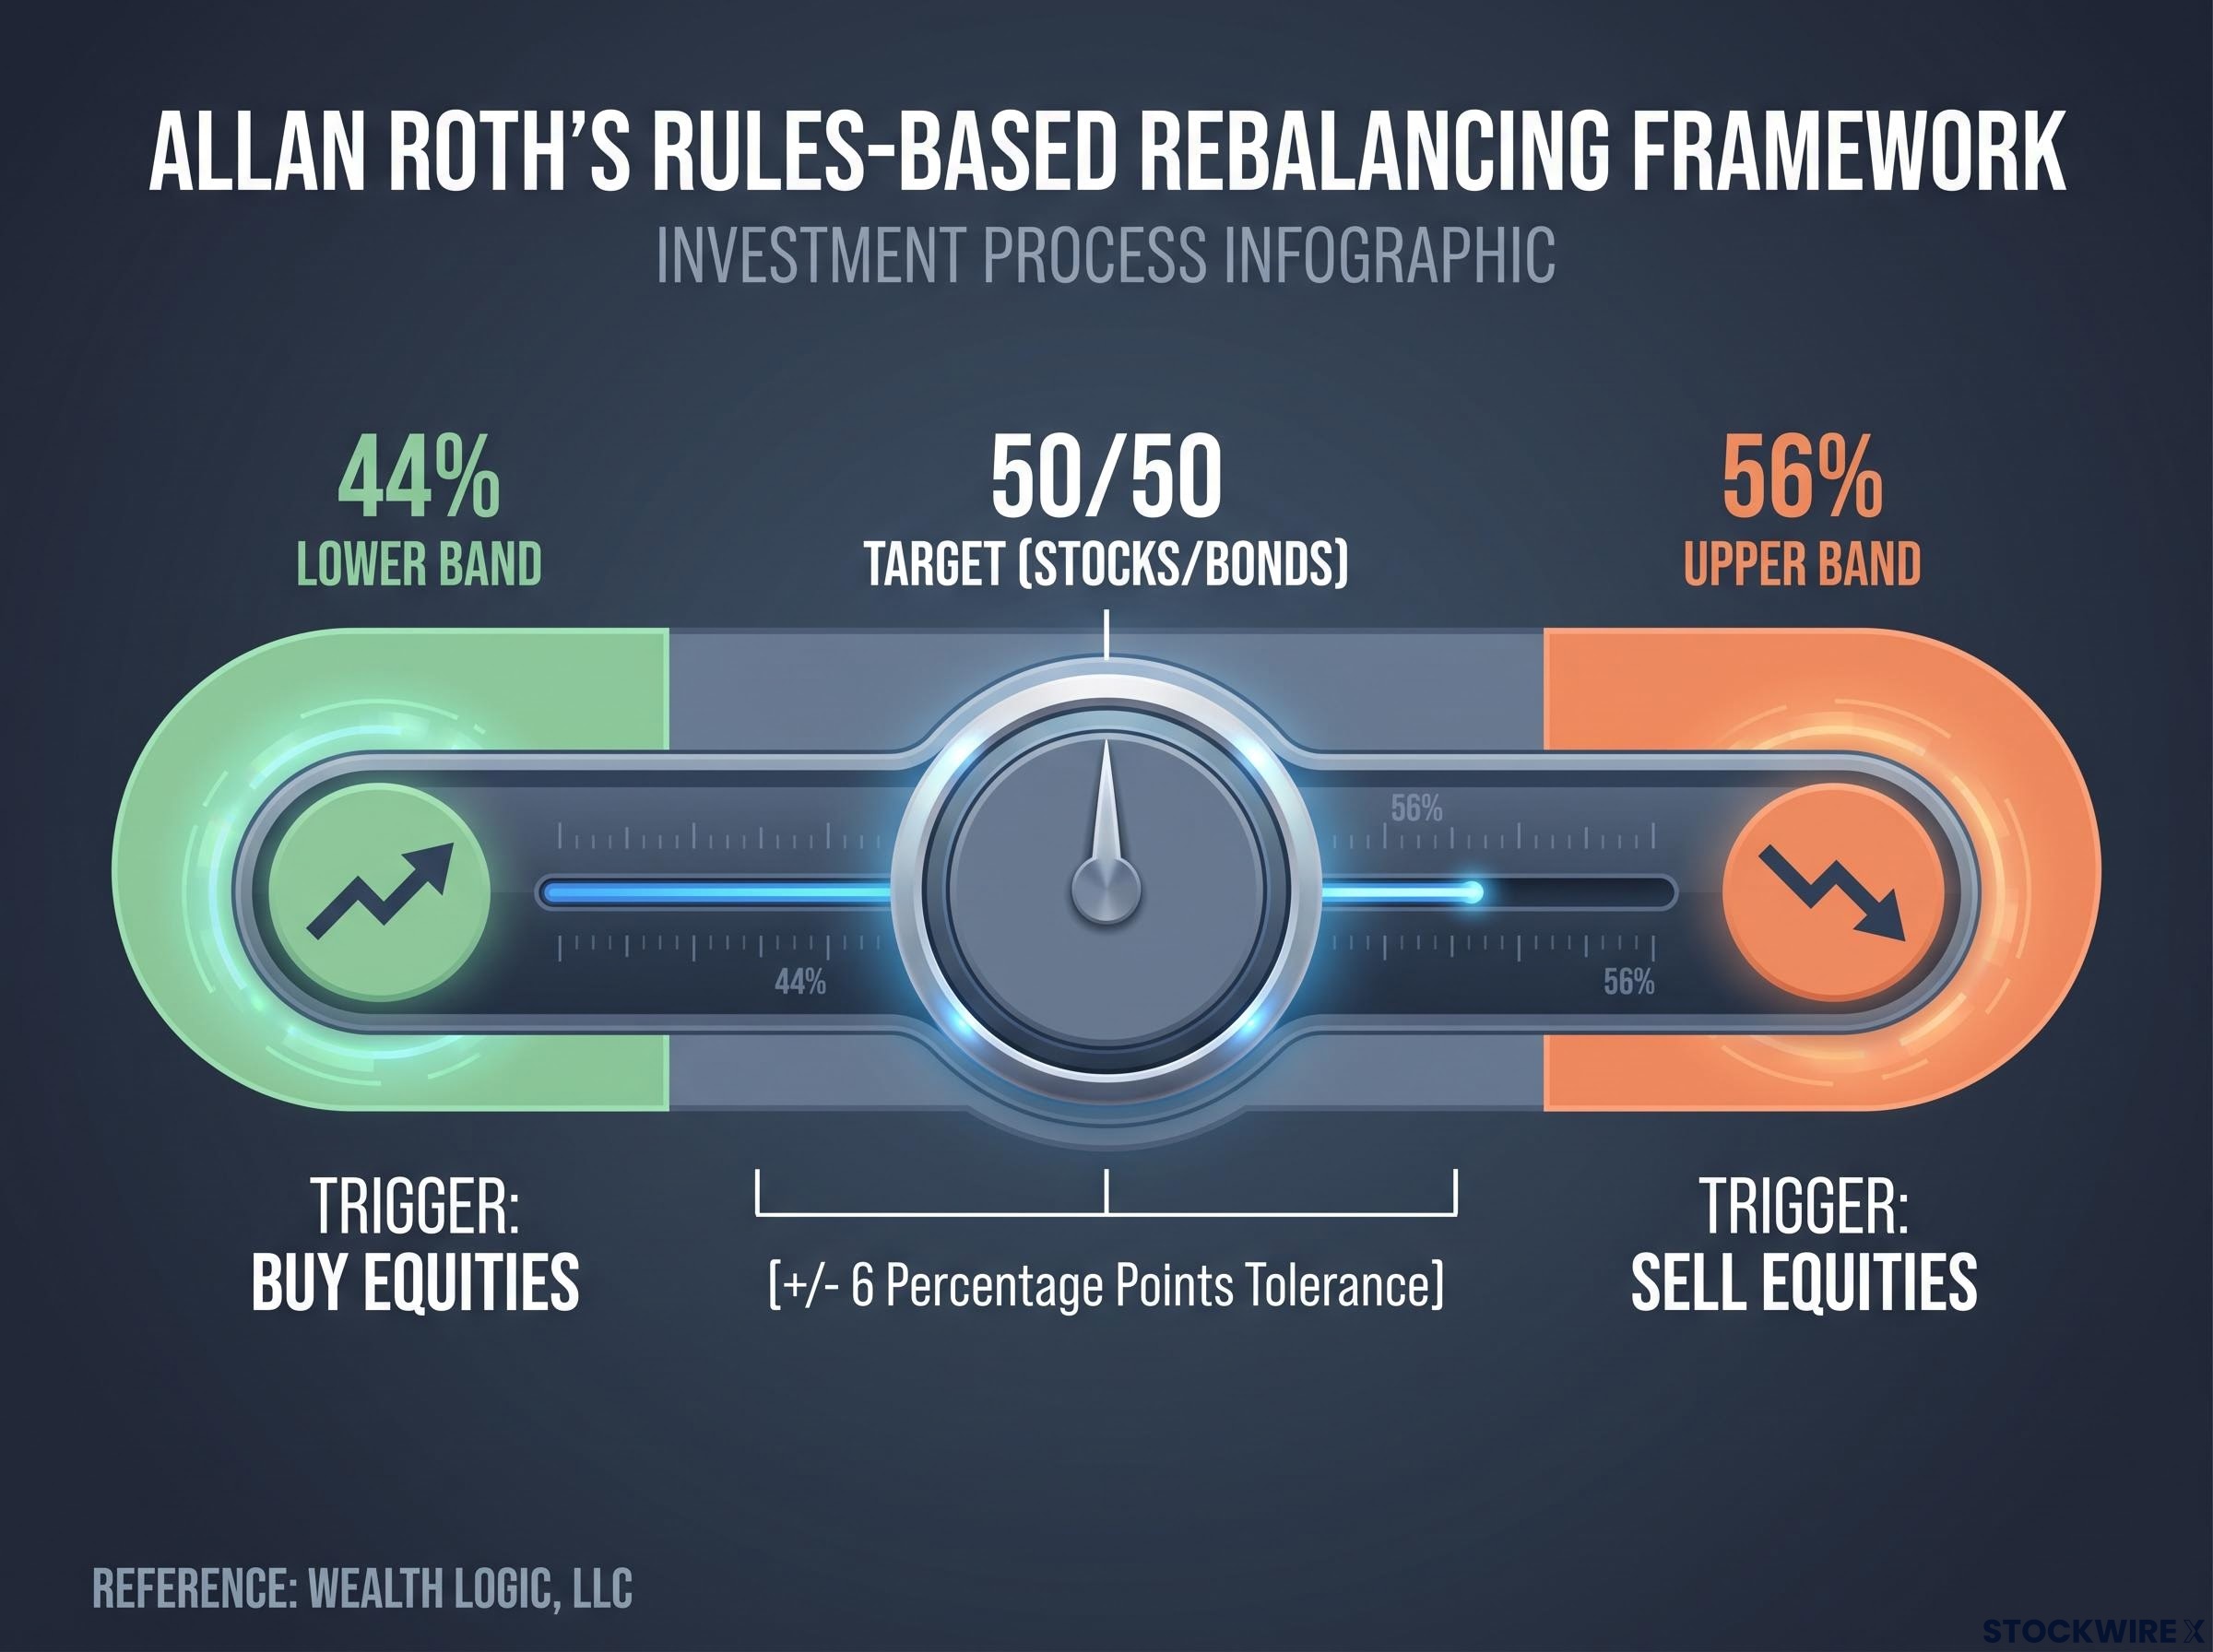
The buy-low/sell-high logic is automatic: you sell what has appreciated above the band (relatively expensive) and buy what has fallen below it (relatively cheaper), without any prediction about what comes next.
| Portfolio State | Equity Weight | Rule Triggered | Action Required |
|---|---|---|---|
| At target | 50% | None | No action |
| Above upper band | 57% | Sell equities | Sell stocks, buy bonds to restore 50/50 |
| Below lower band | 43% | Buy equities | Sell bonds, buy stocks to restore 50/50 |
Because equities have appreciated significantly in recent years, a rules-based framework would have mechanically triggered equity sales. Not because of a prediction, but because higher prices pushed weights above the band. The distinction between this and a CAPE-based timing decision is not philosophical but operational, and it is one you can map directly onto your own portfolio.
Tax-smart rebalancing and the limits of discipline
Rebalancing in taxable accounts realises capital gains. That creates drag, and Morningstar’s backtest confirmed the damage: CAPE-based timing actively harmed taxable investors. Tax-efficient execution is what separates a framework on paper from one that works in practice.
The preferred techniques, in order of priority:
- Direct new contributions toward whichever asset class is currently underweight
- Redirect dividends and interest payments to the underweight side rather than reinvesting in kind
- Conduct rebalancing trades inside tax-advantaged accounts such as IRAs and 401(k) plans, where capital gains are deferred or eliminated
None of these steps relies on CAPE or any other timing metric. Each reduces the friction that erodes process benefits over time.
The discipline question
Tax mechanics are solvable. The harder variable is behavioural.
Allan Roth himself has acknowledged personal uncertainty about near-term and long-term equity performance, and a personal inclination toward valuation pessimism. That disclosure is the honest counterweight: even someone who genuinely believes equities are stretched is better served by the rule than by acting on that conviction.
A committed process reduces the influence of momentary sentiment, anxiety, and overconfidence, which is precisely when those forces are strongest. The question you need to answer honestly is whether your own tendencies make the discipline achievable, or whether you need structural support to maintain it: an advisor, automatic rebalancing features in your 401(k), or a calendar-based review commitment made in writing.
A rebalancing rule is only as strong as your pre-commitment to follow it when following it feels wrong.
What the evidence actually supports, and what it does not
Dismissing CAPE entirely would be intellectually dishonest. It is a legitimate long-horizon valuation gauge with documented informational value over 5-10 year windows. Commentary from the CFA Institute and Brandes confirms this role. Some recent papers still find statistically significant predictive power for multi-year returns.
The specific claim the evidence supports is narrower and more precise: using CAPE as a binary timing trigger for portfolio allocation changes is inferior to a disciplined rules-based rebalancing process for typical investors over realistic horizons.
CAPE at historically extreme levels, such as the May 2026 reading of 40.16 breached only once in 145 years of market history, strengthens the case for return-assumption recalibration without strengthening the case for timing-based exits.
What the evidence validates:
- Long-horizon return expectations informed by valuation context
- CAPE as a descriptive measure of where equities sit relative to historical earnings
- Academic signal value over multi-year windows
What the evidence does not support:
- Tactical allocation timing based on CAPE levels
- Binary in/out decisions triggered by threshold crossings
- Short-term return prediction in any actionable form
Larry Swedroe has noted that CAPE is not the only forecasting model to have disappointed. The failure is consistent with the general difficulty of market timing, not idiosyncratic to one metric.
The argument here is specifically against CAPE as a timing trigger, not against CAPE as a valuation measure. The distinction matters, because collapsing both into a single verdict would be as intellectually lazy as the timing strategies the evidence discredits.
Sophisticated, valuation-aware dynamic strategies may add value in specific regimes, but these sit beyond the practical reach and appropriate risk budget of most individual investors.
This article is for informational purposes only and should not be considered financial advice. Investors should conduct their own research and consult with financial professionals before making investment decisions. Past performance does not guarantee future results.
Building a portfolio process that does not depend on being right
The evidence points in one direction: valuation signals like CAPE are informative but not actionable as timing triggers. A rules-based rebalancing process manages risk without requiring a forecast, and the discipline to follow it when prediction feels more compelling is the actual competitive advantage available to you. It is free, systematic, and does not depend on being smarter than the market.
Your next steps are concrete:
- Confirm or establish a target allocation matched to your actual risk tolerance, not to a questionnaire answer or a market view
- Define tolerance bands in advance and write them down, so the decision is made before the pressure arrives
- Identify whether rebalancing will be executed manually or through a structural mechanism, such as automatic rebalancing in a retirement plan or a scheduled review with an advisor
The question was never whether CAPE is a good metric. It is. The question is whether acting on it makes you a better investor. The evidence says it does not. A process you can follow does.