Australian bank shares are among the most expensive in the developed world, yet they have delivered roughly one-quarter the return of European and UK banking peers so far in 2026. The gap is not a rounding error. It is a threefold difference in year-to-date performance, and it raises a question that anyone holding or considering the sector needs to answer.
The timing sharpens the stakes. August 2026 reporting season is approaching, and the operating backdrop has shifted materially. A sequence of three rate increases, fiercer competition across both the lending and deposit markets, and a Federal Budget that wound back tax concessions for property investors have all weighed on the sector since 2025. Margins are compressing. Loan losses are expected to rise. At current valuations, the sector has little room to absorb disappointment.
Here is what the numbers show, and what they mean for your decision: whether the valuation premium is justified, where the better risk-reward sits within the sector, and which specific variables in the coming results will determine whether current prices hold or correct.
Why Australian banks are the most expensive in the developed world
The starting point is not a matter of interpretation. According to VanEck, Australian banks are the most expensive in the developed world on 12-month forward price-to-earnings and price-to-book measures. That means investors buying the sector today are paying more for each dollar of earnings or book value than they would for US, UK, or European banks.
VanEck reports that Australian banks rank as the most expensive in the developed world on forward P/E and price-to-book, ahead of all major developed-market banking sectors.
According to UBS, the sector’s price-to-earnings ratio has moved to a position more than two standard deviations above its long-run historical average when measured against the S&P/ASX 200. That is not modest richness. It is a genuine statistical outlier, and it means the margin for error on forward earnings is unusually thin.
The sharpest expression of the premium sits in one stock. Commonwealth Bank of Australia (CBA) trades at approximately 27-28x earnings, against a long-term average near 18x. That is roughly double the multiple of comparable global banking franchises. According to Morningstar estimates, the major banks’ weighted average price-to-fair-value sits at approximately 1.14, meaning they trade about 14% above intrinsic value estimates on average.
| Metric | CBA | ASX 200 Average | European Banks |
|---|---|---|---|
| Forward P/E (approx.) | ~27-28x | Lower range | ~Half CBA’s multiple |
| CBA Long-term Average P/E | ~18x | N/A | N/A |
Outside of CBA, the picture is less extreme. Commentary from Canaccord suggests the big four (ex-CBA) trade nearer to or at a slight discount to the broader market, within their historical P/E range relative to the ASX 200. But at a sector level, the premium is real, and it is the starting point for everything that follows.
The valuation methods for ASX bank stocks extend well beyond forward P/E, incorporating price-to-book, dividend discount models, and APRA capital requirements that make direct comparisons with European or US peers systematically misleading without adjustment for the Australian regulatory and franking credit context.
When big ASX news breaks, our subscribers know first
What the profitability numbers say about whether the premium is earned
If Australian banks trade at the highest multiples in the developed world, the obvious test is whether their returns justify the price. The answer, on the current numbers, is that they do not.
UBS places sector return on equity (ROE), the percentage profit a bank earns on its shareholders’ equity, at 11.0%, against a long-run historical average of 12.0%. That one-percentage-point gap may look modest in isolation, but it runs in precisely the wrong direction for a sector priced at premium multiples.
What is driving the profitability gap
Three near-term headwinds explain why returns are tracking below their long-run average:
- Net interest margin compression: intensified competition for both deposits and loans is squeezing the spread banks earn on lending
- Rising loan losses: Morningstar expects an increase in bad debts in the near term, which directly reduces bottom-line profitability
- Slowing credit growth: declining residential property prices and falling mortgage application volumes are constraining the volume side of the equation
VanEck reinforces the disconnect, noting that recent rallies have stretched valuations even as the earnings outlook is not clearly improving. A premium multiple layered on below-average returns is the least favourable combination a value-oriented investor can face. The sector currently presents exactly that configuration, and it means any further deterioration in margins or credit quality will be amplified by the starting valuation.
The RBA banking indicators data shows major banks’ net interest margins have been on a sustained downward trajectory through 2025-2026, providing the clearest official measure of how deposit and lending competition is translating into compressed profitability at the system level.
How the global comparison changes the investment case
The numbers land before any explanation is needed. According to UBS broker research, from 1 January 2026 to early August 2026:
European bank shares posted gains of approximately 23%. UK bank shares rose approximately 24%. The Australian banking sector, by contrast, advanced only approximately 6.8%.
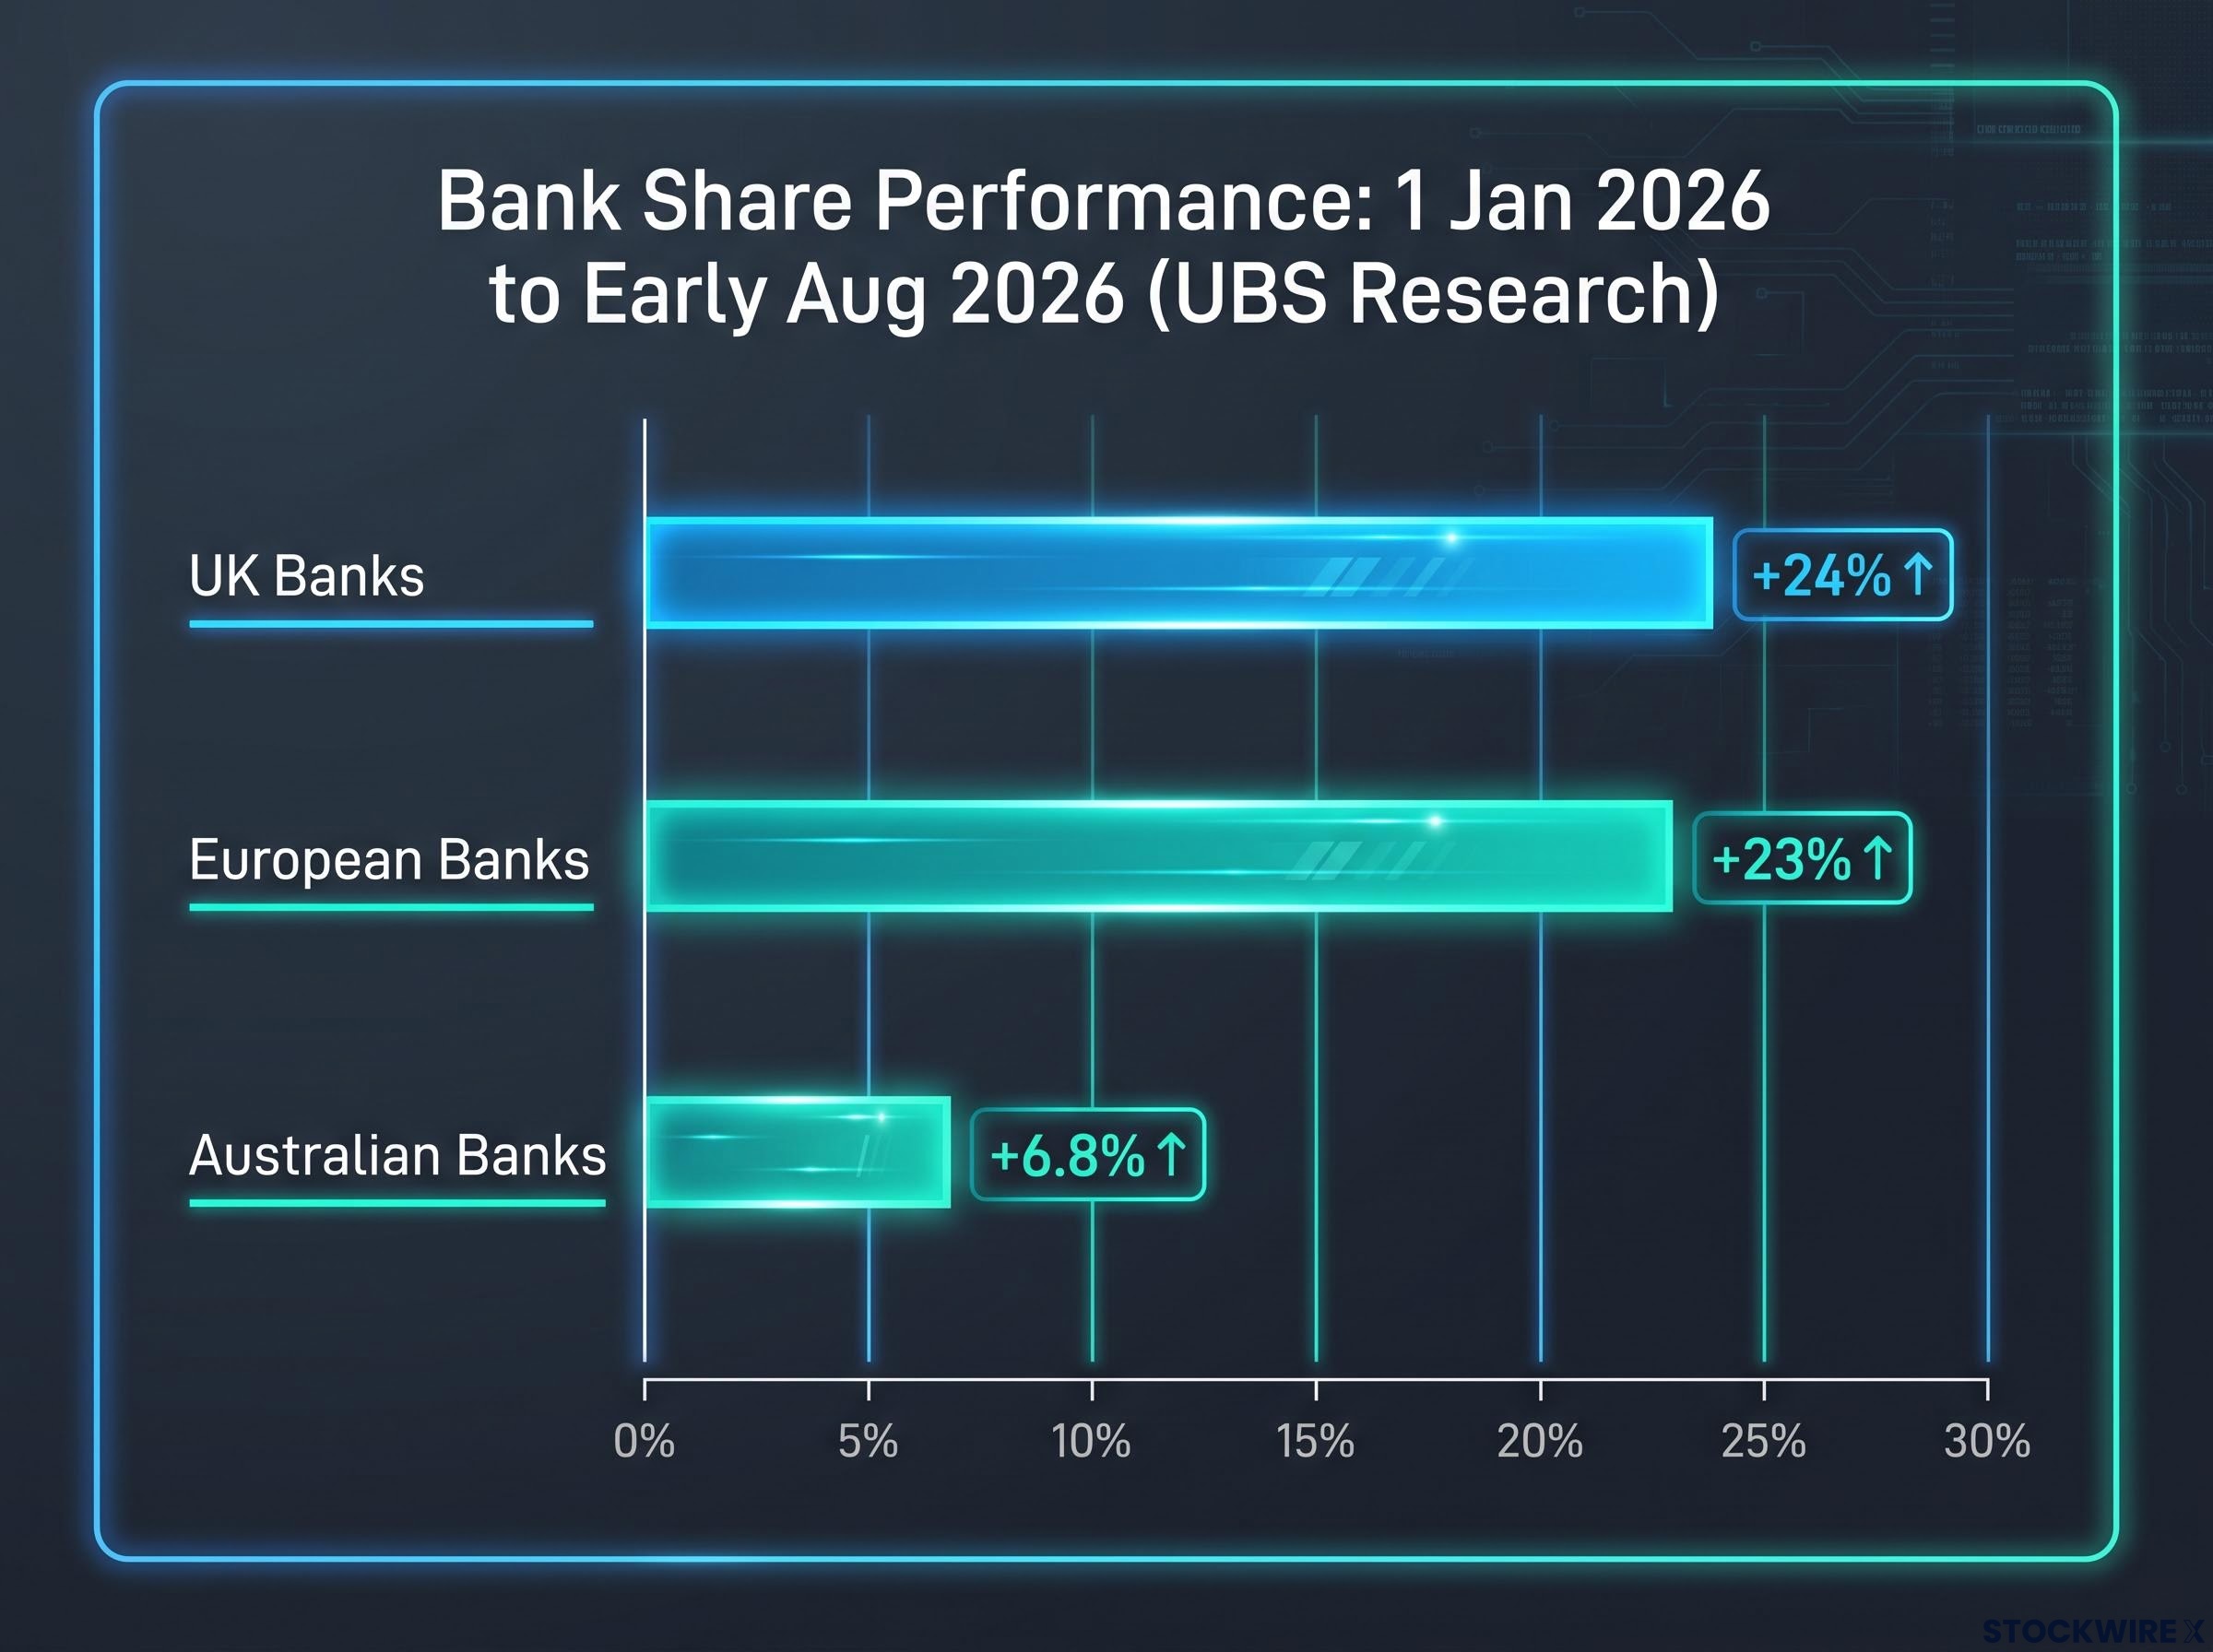
That is a threefold performance gap. Australian investors who held domestic bank shares instead of European or UK equivalents have received roughly one-quarter the return over the same period.
The individual big four figures tell a similar story of subdued performance:
- CBA: up approximately 5%
- NAB: down approximately 6%
- Westpac: down approximately 6%
- ANZ: down approximately 1%
The re-rating logic explains why. European and UK banks improved profitability from lower starting valuations, which created room for multiple expansion. Investors were paying less per dollar of earnings, and when those earnings improved, share prices re-rated sharply. Australian banks had no equivalent catalyst and started from richer valuations, which left limited upside even if earnings held steady.
The gap is not a temporary blip. It reflects valuation starting points and earnings trajectory, which means it is directly relevant to anyone deciding how to allocate financial sector exposure. For investors who can access global equities, the relative opportunity has shifted meaningfully in 2026, and the cost of home-market concentration in bank shares is measurable.
The risks that matter most heading into August reporting season
The historical data is on the table. The forward-looking question is whether the August results will confirm or challenge the current pricing.
Broker analysis from UBS and Morgan Stanley identifies three variables that will likely move the market more than backward-looking profit figures:
- NIM guidance: management commentary on where net interest margins are heading will signal whether margin compression is stabilising or accelerating
- Loan growth outlook: any downgrade to volume expectations would compound the margin pressure
- Capital ratios: whether banks hold comfortable buffers above regulatory minimums, or whether those buffers are thinning
What rising provisions signal about credit conditions
Several banks increased their loan loss provisions, funds reserved in anticipation of loans that may not be repaid, ahead of first-half results. Morningstar explicitly expects an increase in loan losses as a near-term headwind, which implies further provisioning ahead. When multiple banks build reserves simultaneously, it signals internal recognition that the credit environment is deteriorating, not an isolated pocket of stress.
The pattern is not new to 2026: margin and capital disappointment triggered a 7-14% sell-off across the big four in May 2026, with NAB recording the steepest monthly decline, reinforcing how swiftly premium valuations can unwind when reporting season delivers below-expectation NIM and provisioning numbers.
Morgan Stanley, in a recent note, identified weaker-than-expected capital ratios as a separate indicator of potential stress across the sector. NAB’s decision to partially underwrite its dividend reinvestment plan (DRP) drew particular attention: the bank brought in a third party to purchase shares from investors who chose the cash dividend option, allowing NAB to hold more capital on its balance sheet rather than paying it out. Market observers interpreted this reliance on the DRP mechanism as a sign that the bank’s capital buffer was more constrained than investors would have liked.
If management teams deliver cautious NIM guidance alongside capital ratios that disappoint, the sector’s valuation premium will face a direct test. If you hold at current prices, you should be clear about your tolerance for that scenario.
Understanding why bank valuations are so stretched despite weak fundamentals
The valuation premium looks irrational on a pure fundamentals basis. It is not. Three identifiable structural forces explain why prices have remained elevated even as returns and growth have softened.
- Index weight and passive ownership: Australian banks command large weightings in the ASX 200, which forces index-tracking funds and exchange-traded funds to hold them regardless of relative value. This creates a layer of demand that is indifferent to price.
- Dividend yield and franking credits: major banks pay consistent dividends with franking credits attached, which makes them especially attractive to Australian investors in a tax system that rewards franked income. The after-tax yield proposition sustains demand even when growth and return metrics soften.
- Superannuation sector allocation patterns: Australia’s superannuation system channels a large and growing pool of capital toward domestic equities, with major banks representing a significant share of that allocation by default.
These forces are real, and they explain the premium. But they do not justify it indefinitely. If dividends are trimmed, or if capital requirements force banks to rely more heavily on DRP issuance rather than cash payouts, the yield thesis weakens. NAB’s partial DRP underwriting is an early indicator of exactly that risk.
The structural support disappears if the dividend proposition erodes, and the valuation gap to fundamentals would close quickly. Understanding why the anomaly exists is what equips you to judge whether it will persist, narrow, or resolve abruptly.
Dividend yield signals become particularly unreliable when share prices are falling alongside a deteriorating earnings outlook: a rising yield figure can reflect the market already pricing in a dividend cut rather than a genuine income opportunity, which is the precise risk configuration the current sector presents.
Where brokers see better and worse risk-reward within the sector
The sector is broadly expensive, but not uniformly so. The broker consensus on where the greatest risk and relative opportunity sit within the big four is clear.
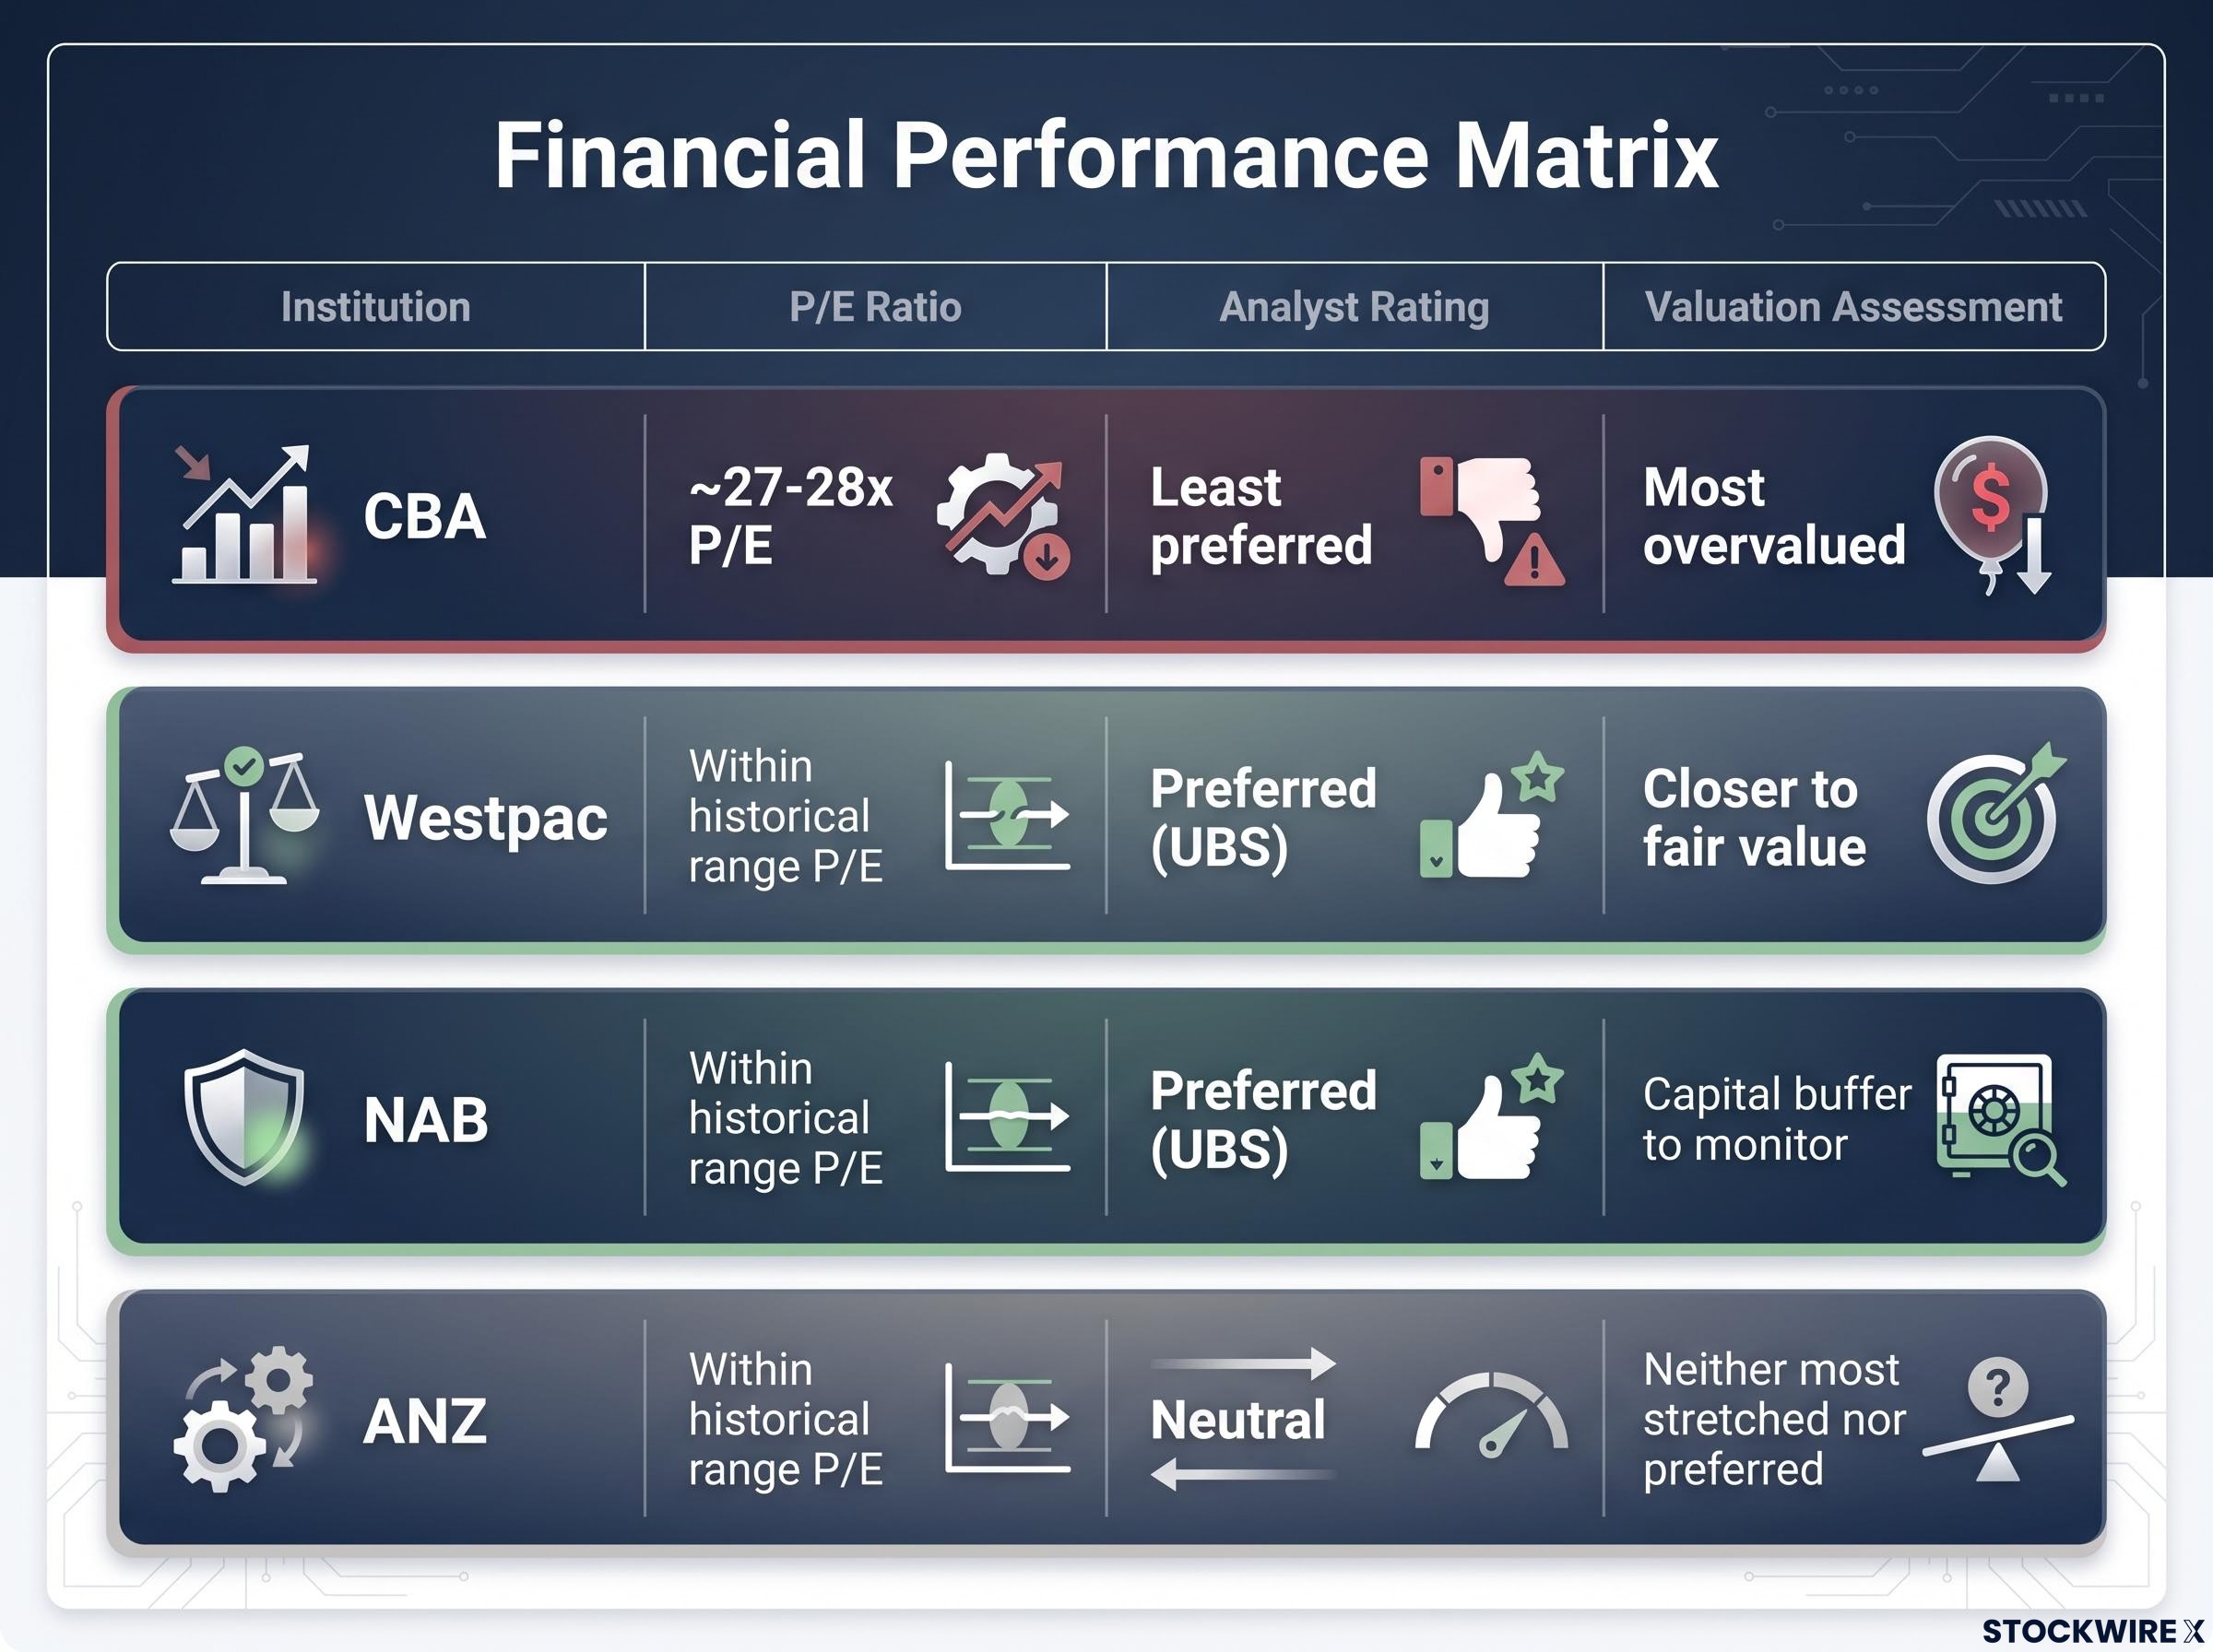
CBA carries the greatest valuation risk. Both UBS and Morningstar identify it as the most overvalued of the major banks, with its share price significantly above fair value estimates. At 27-28x earnings, the stock is priced for conditions materially better than the current operating environment delivers.
UBS names NAB and Westpac as its preferred picks for outperformance within the sector on relative value grounds. Outside of CBA, valuations are described as more reasonable, with the big four (ex-CBA) trading at a slight discount to the broader market and within their historical P/E range relative to the ASX 200.
ANZ sits between the two camps, neither the most stretched nor the clearly preferred alternative.
Citi characterises the sector as overvalued, warning that bank stocks could face material downside if earnings growth disappoints.
| Bank | Approx. P/E | Broker Preference | Key Risk-Reward Note |
|---|---|---|---|
| CBA | ~27-28x | Least preferred | Most overvalued; greatest valuation risk |
| Westpac | Within historical range | Preferred (UBS) | Relative value; closer to fair value |
| NAB | Within historical range | Preferred (UBS) | Relative value; capital buffer to monitor |
| ANZ | Within historical range | Neutral | Neither most stretched nor clearly preferred |
For an investor determined to hold domestic bank exposure, the broker consensus suggests that rotating from CBA toward NAB or Westpac is the most defensible relative-value trade available within the sector right now. Non-major banks are generally considered cheaper than the big four on valuation metrics, offering another avenue for those seeking financial sector exposure at less demanding multiples.
What the valuation gap means for your next move in ASX bank shares
The picture is clear. The sector trades at premium multiples globally and historically, on below-average returns, in a deteriorating operating environment, with a specific reporting season test imminent. That combination defines the current risk profile.
The practical distinction is between the sector-level valuation problem, which affects all banks, and the stock-specific relative value consideration. CBA carries the most concentrated risk. NAB and Westpac offer relatively better positioning on broker assessments. The gap between them is wide enough to matter.
The August reporting season is the near-term test. The premium is more defensible if:
- NIM guidance comes in line with or better than expectations
- Capital ratios meet market expectations without DRP reliance
- Loan losses track below current forecasts
If those conditions are not met, the valuation gap to fundamentals has a clear closing mechanism, and the threefold performance gap to European and UK peers is a reminder of the opportunity cost of holding expensive domestic exposure.
Investors exploring what a further deterioration in NIM guidance or capital ratios would mean for their position will find our full explainer on stress-testing ASX bank valuations, which includes worked sensitivity ranges showing how dramatically valuation outputs shift under different discount rate and earnings growth assumptions.
This article is for informational purposes only and should not be considered financial advice. Investors should conduct their own research and consult with financial professionals before making investment decisions. Past performance does not guarantee future results. Financial projections are subject to market conditions and various risk factors.