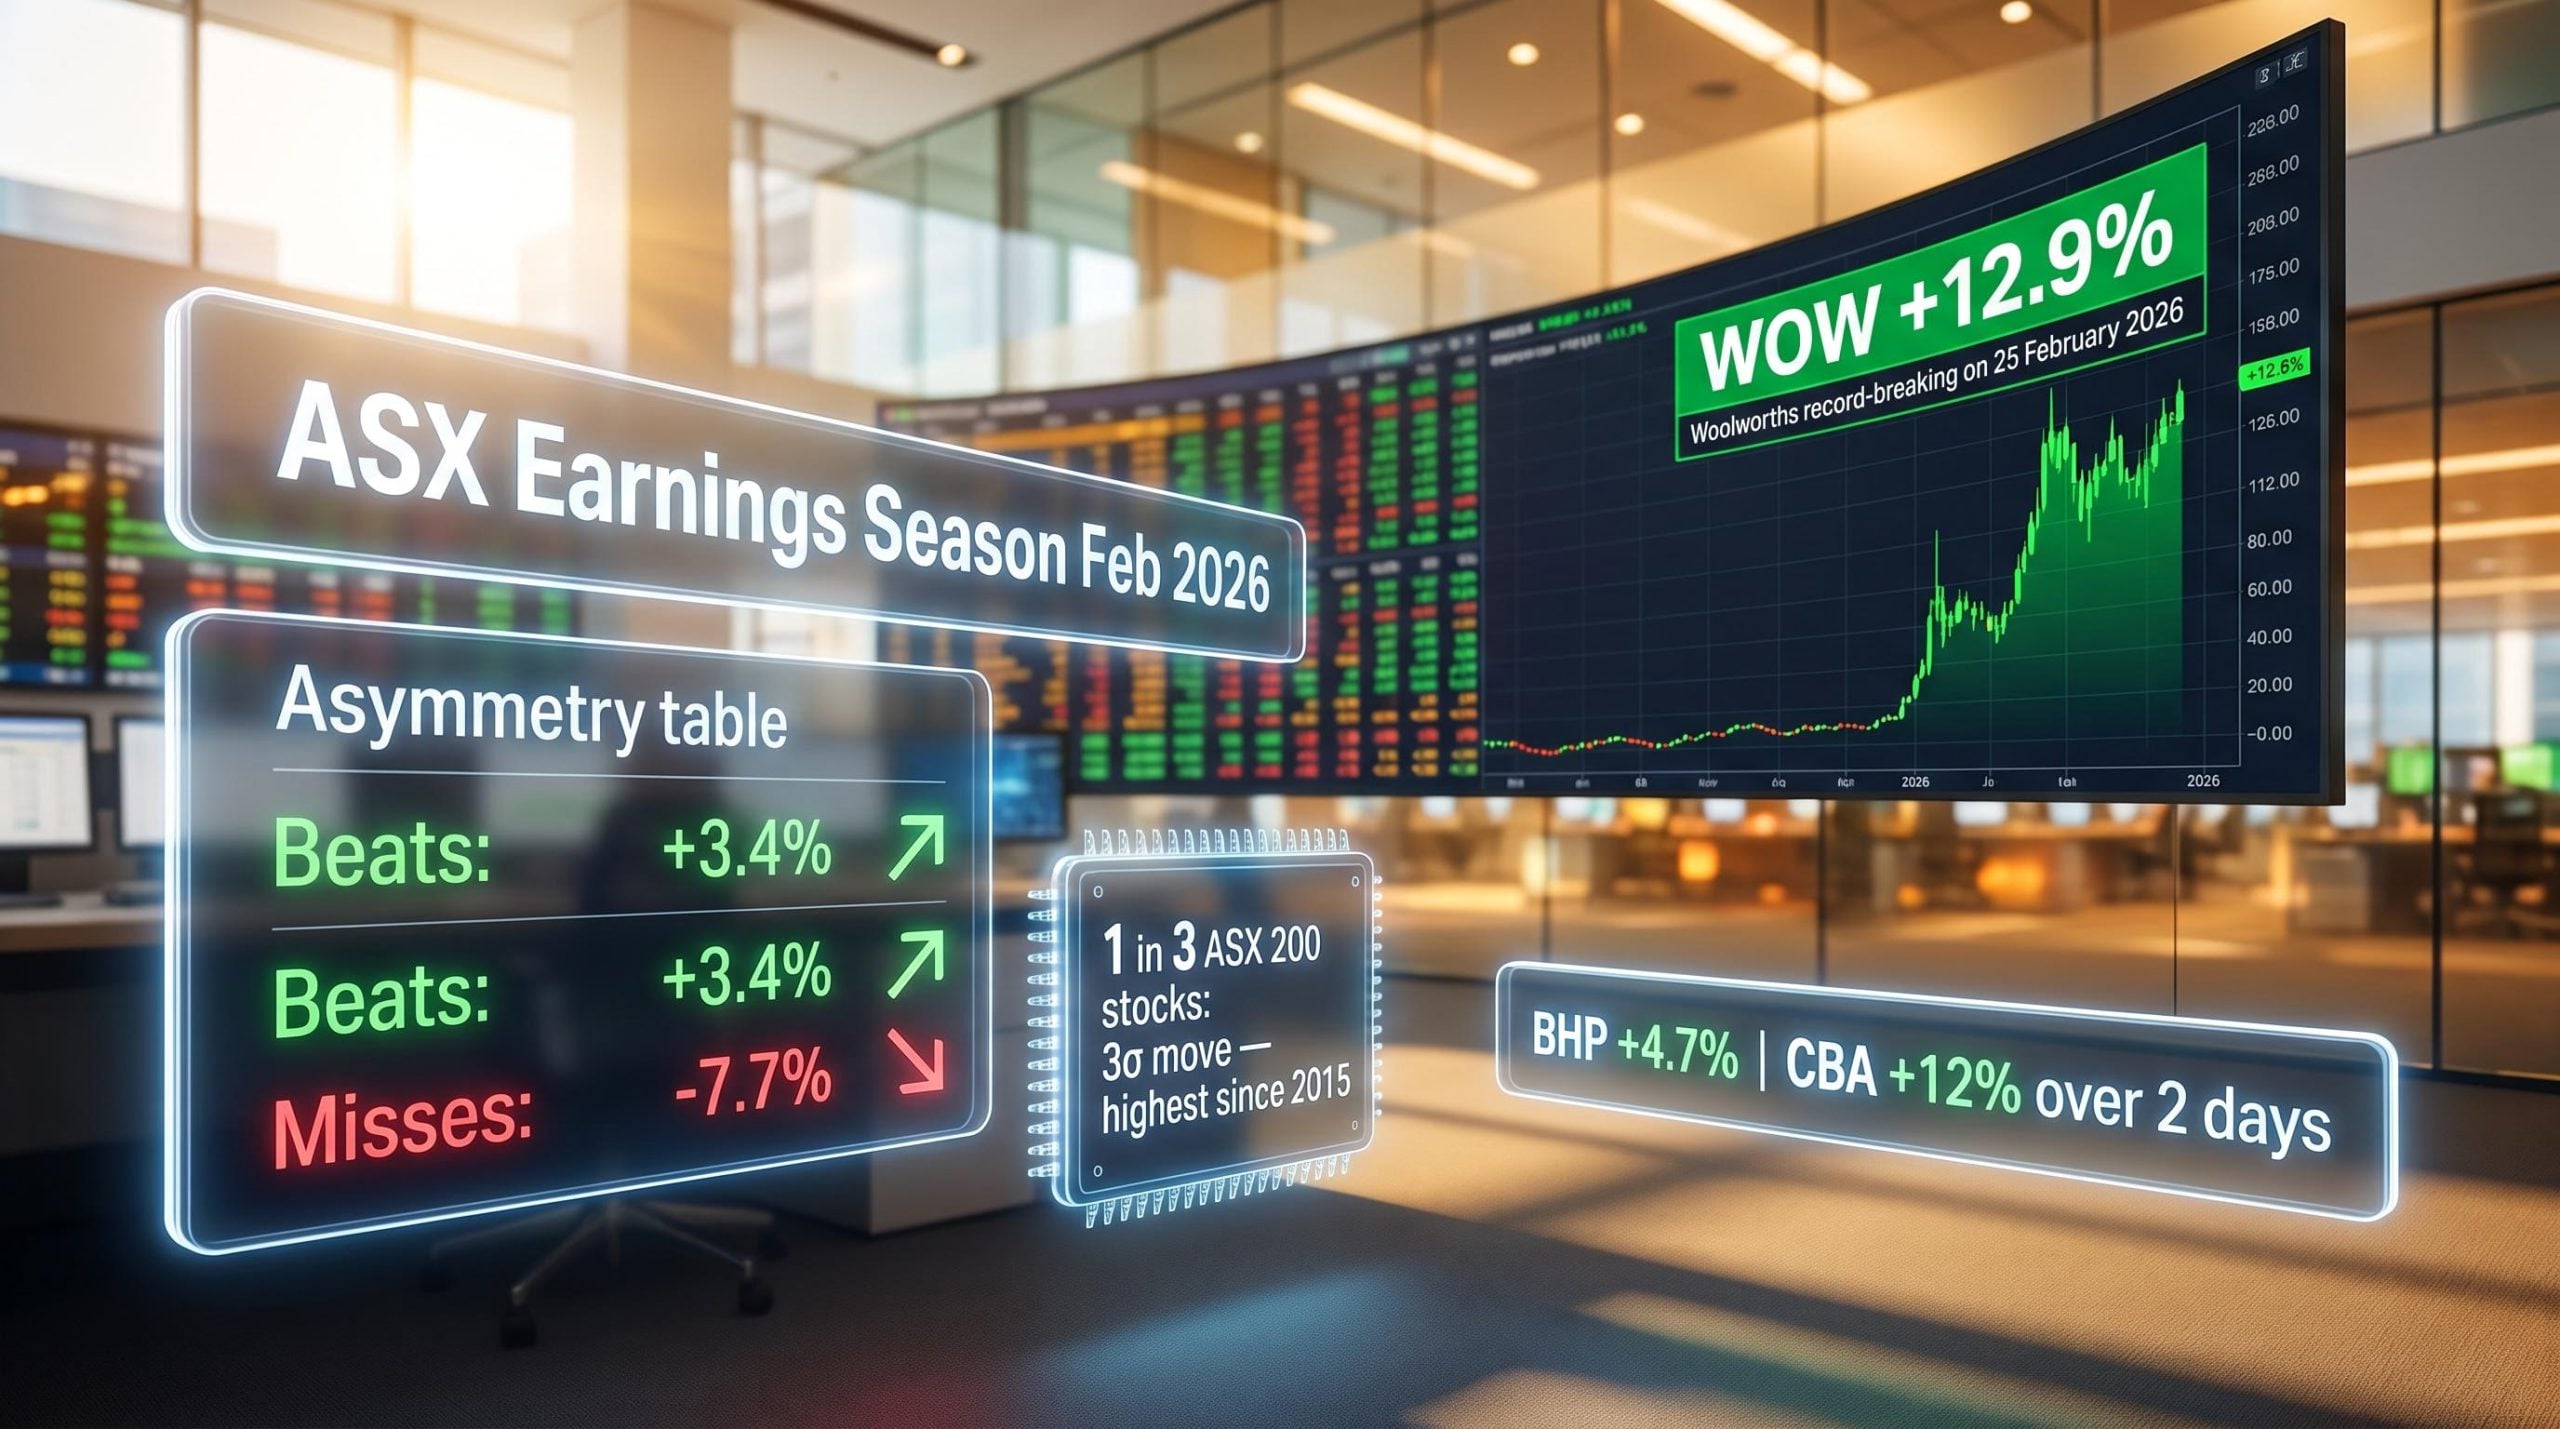
In February 2026, a supermarket stock recorded its largest single-session gain in the company’s history. There was no takeover bid. No earnings bombshell from a high-growth darling. Just a half-year result from a grocer that most of the market had written off as boring.
That paradox sits at the centre of something every Australian investor needs to understand about ASX earnings season. February 2026 was among the most volatile reporting periods on record, with JPMorgan’s data showing that more than a third of ASX 200 companies experienced price swings exceeding three standard deviations on their reporting days, a rate unseen in that dataset since 2015. This is not background colour. This is the environment you navigate every February and August.
Here is what three of the ASX’s biggest names in February 2026 actually teach you about how results move stocks: why profit numbers alone do not explain the reaction, what signals to watch before a result drops, and how to think about positioning when a company you hold is about to report.
Why earnings season compresses so much market movement into so few weeks
ASX reporting season runs twice a year, in February and August, driven by the semi-annual reporting cadence that most Australian-listed companies follow. This is distinct from the quarterly cycle in the United States, where companies report every three months. On the ASX, the information arrives in larger, less frequent batches, and the concentration is intense: hundreds of companies release results across three to four weeks.
That compressed window creates an information shock. Fund managers, sell-side analysts, and algorithmic trading systems must all update their models simultaneously. On peak days, dozens of results land before the market opens, and stocks gap up or down before most retail investors have finished reading the headlines.
The ASX continuous disclosure obligations under Listing Rules 3.1 through 3.1B require listed companies to release price-sensitive information immediately, which is why results land in concentrated batches and why the market’s reaction is so compressed into a narrow window each February and August.
The scale of recent volatility tells you this is not a niche phenomenon:
- Average result-day move of approximately 5% up or down (Morningstar, ASX Investor Update, February 2026)
- August 2025 was the most volatile ASX reporting season in at least a decade (Morningstar)
- One in five ASX 200 companies moved more than 10% post-results (VanEck, August 2025)
- Approximately half of the 146 stocks CommSec monitored in February 2026 moved at least 5% on result day; roughly 20% moved at least 10%
Over one-third of ASX 200 companies recorded price moves exceeding three standard deviations on their reporting days in February 2026, the highest rate in JPMorgan’s dataset since 2015 (JPMorgan via Reuters).
The concentration of information events into three to four weeks is not calendar trivia. It means that for a short window every six months, single-stock risk is structurally elevated across the entire market. If you are not actively managing around it, you are accepting volatility you may not have anticipated.
When big ASX news breaks, our subscribers know first
The earnings surprise: why the profit number alone does not move the stock
Here is the logic, step by step. Before a company reports, sell-side analysts, the research teams at investment banks and brokerages, publish forecasts for revenue, earnings, margins, and dividends. Those individual forecasts aggregate into what is called the consensus estimate, and the share price you see the day before results already reflects it. The profit figure is baked in.
So the stock’s reaction on the day is not about how much the company earned. It is about the gap between what the company reported and what the market had already priced. A company that delivers exactly what analysts expected will typically see very little movement. A surprise in either direction is what drives the reaction.
ASX confession season, the wave of profit warnings companies release in the weeks before formal results land, is the earliest signal that consensus estimates are misaligned with reality; the May-June 2026 cycle produced warnings across nearly every sector outside mining and energy, pre-positioning the expectations gap before a single result was officially released.
And the surprises are not symmetrical. Misses are punished more harshly than beats are rewarded.
| Outcome | Average result-day move (large-cap ASX) | Asymmetry |
|---|---|---|
| Earnings beat | +3.4% | Misses punished ~2.3x harder than beats rewarded |
| Earnings miss | -7.7% |
That data comes from FactSet’s H1 FY26 wrap of large-cap ASX names. CommSec’s review of February 2026 confirmed the pattern: the largest single-day moves were almost all on disappointments, with several declines exceeding 20%. Avant Capital’s 2025 analysis documented large caps including Woolworths, James Hardie, and CSL seeing single-day drops of 15-30% on disappointments, levels described as not seen in decades.
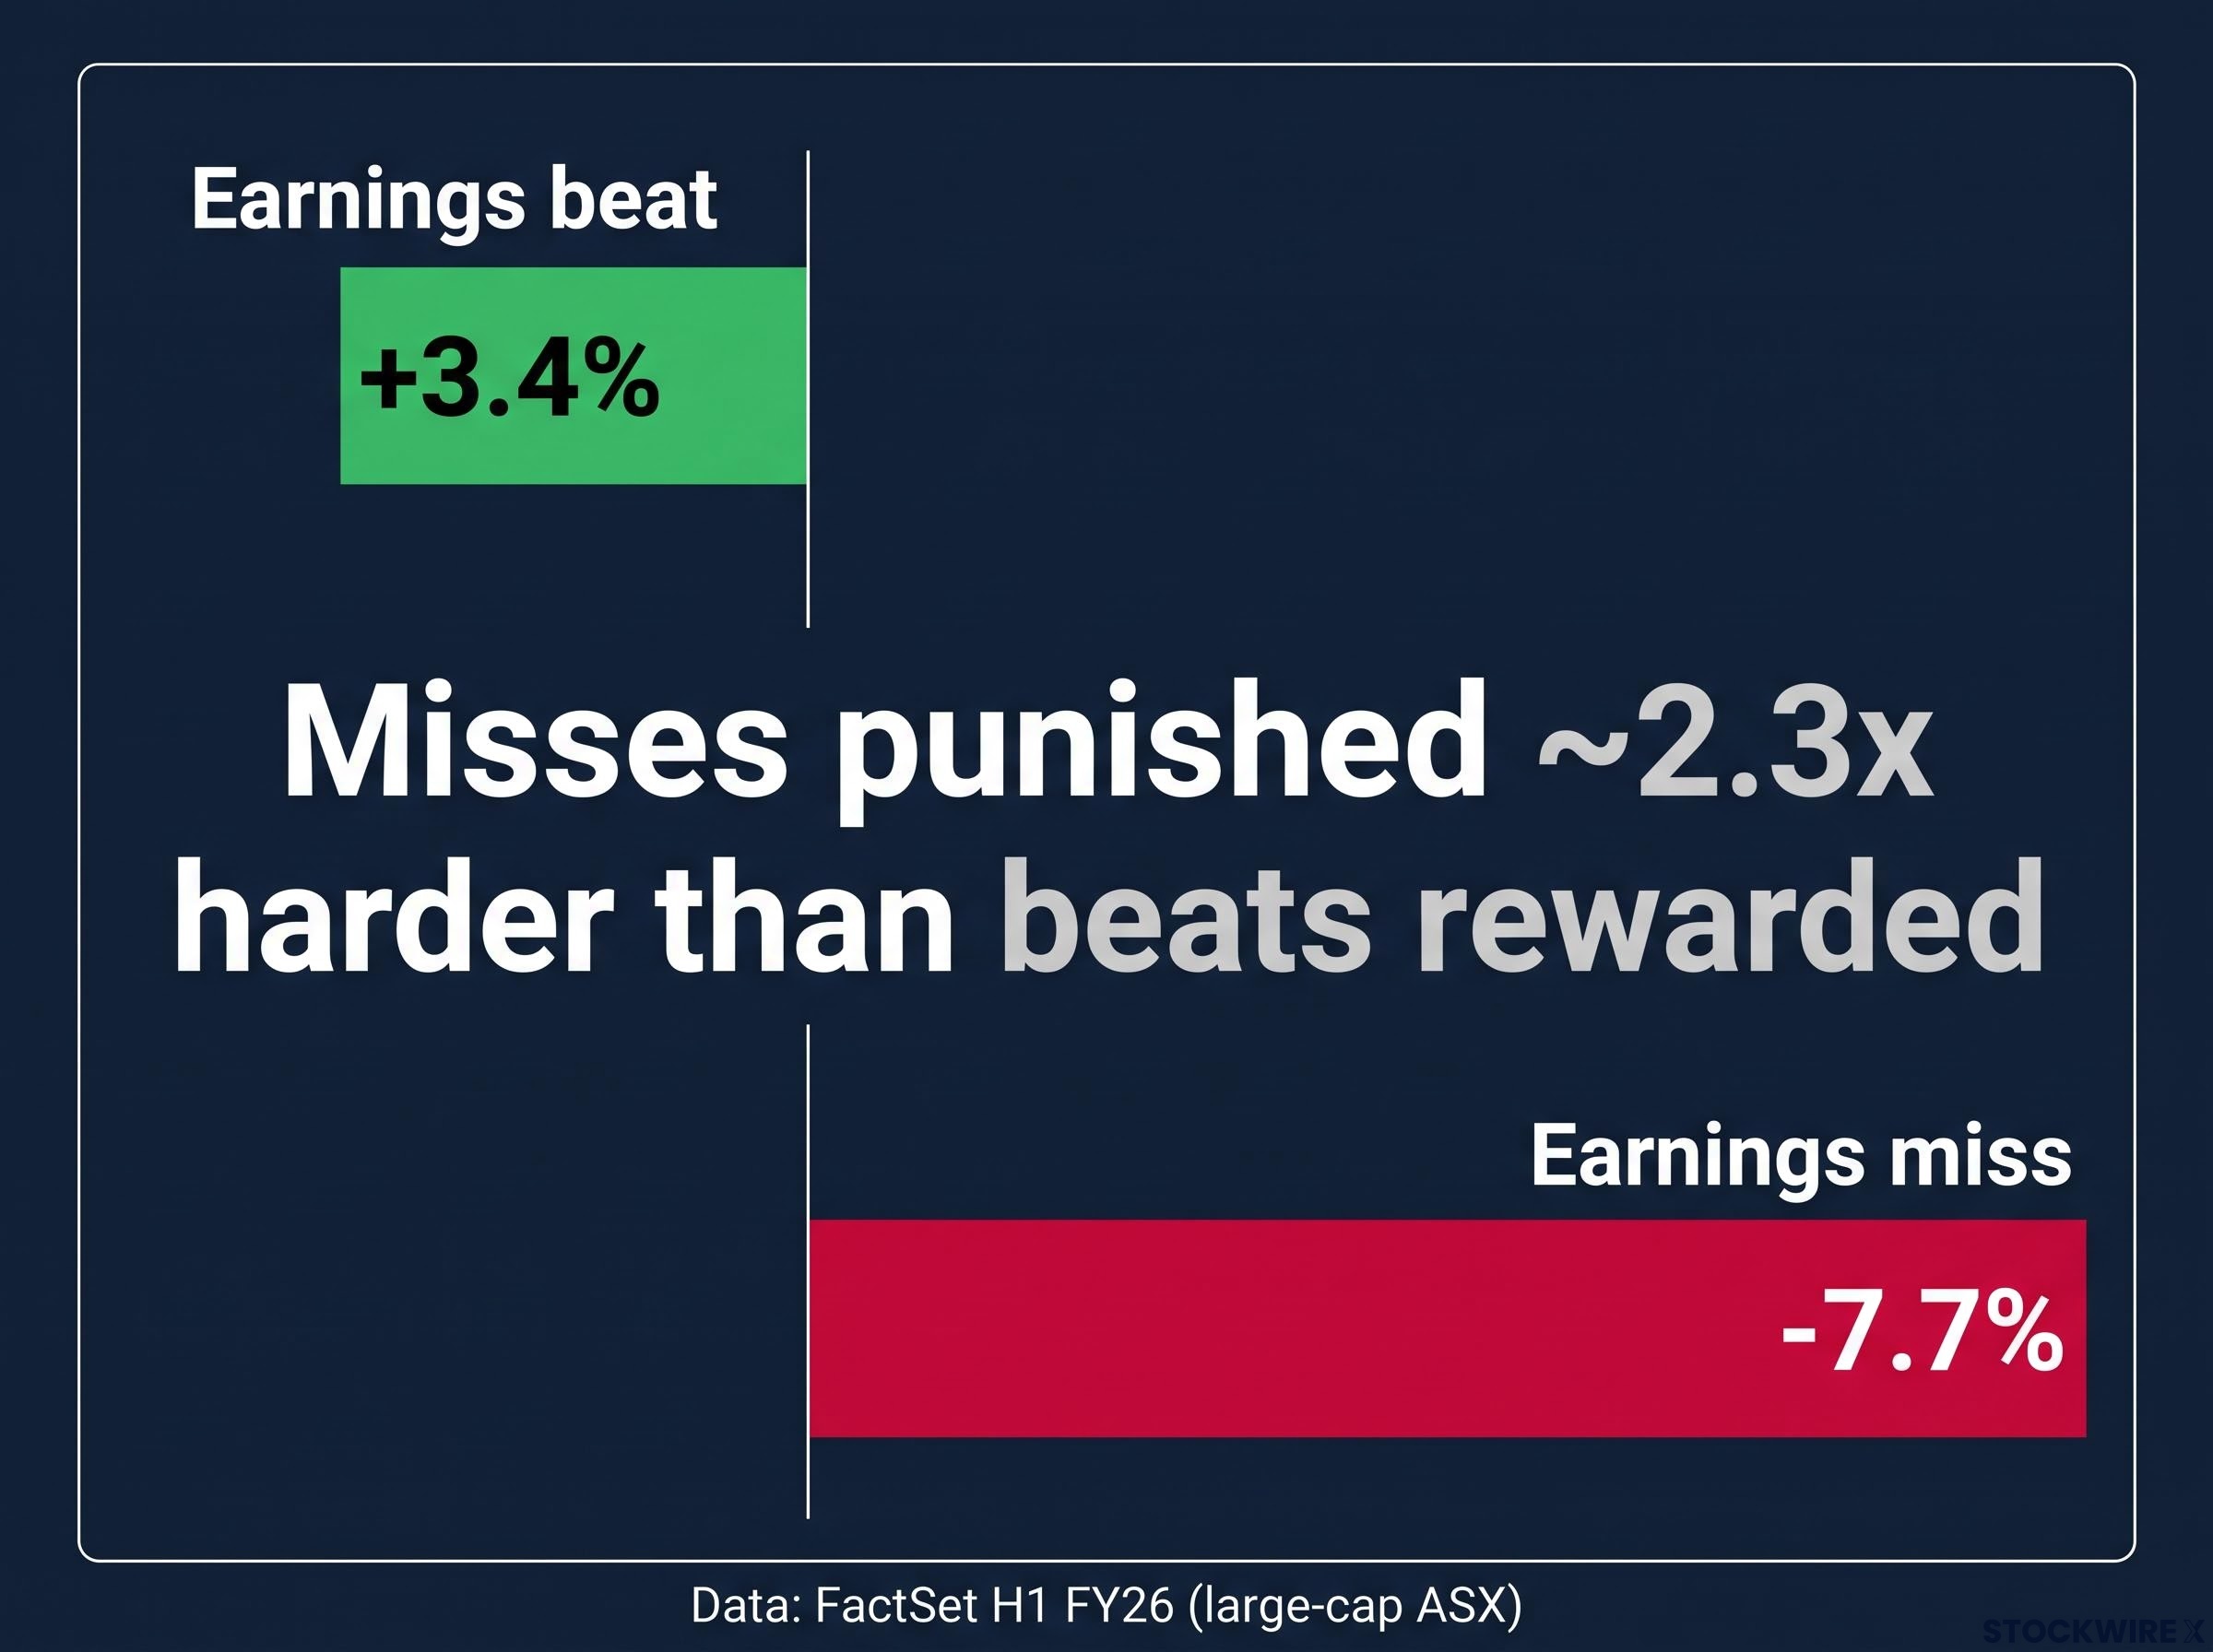
The asymmetry tells you something concrete about position sizing. The cost of holding a stock into a bad result is structurally larger than the reward for holding it into a good one. That changes how rational risk management around reporting season should work.
Woolworths in February 2026: how a defensive stock becomes a volatility event
Woolworths shares surged 12.9% on 25 February 2026, the company’s largest ever recorded single-session gain (Market Index/Kerry Sun).
A supermarket. Not a lithium explorer, not a loss-making tech name. A grocer.
Woolworths’ first-half FY2026 result beat expectations, driven by improving Australian Food sales momentum and disciplined cost management. The earnings beat mattered, but what moved the stock was the trading update. Management’s commentary on the early weeks of the following half signalled that the positive trends were continuing, not fading.
This is where the overhang mechanism comes in. When a stock has been held back by specific, identifiable doubts, in Woolworths’ case, questions about sales momentum, margin sustainability, and competitive pressure from Coles and ALDI, a result that eliminates those doubts does not produce a single-period reaction. It triggers a structural re-rating. The market is not just pricing one good half. It is repricing the forward trajectory.
The same concentrated positioning dynamic that had amplified Woolworths’ downside in prior seasons, Avant Capital documented single-day declines of 15-30% on disappointments among ASX large caps including Woolworths, worked in reverse. When the overhang lifted, the buying was sharp.
In elevated macro uncertainty environments, trading updates and current-half commentary carry more pricing weight than historical profit figures. The profit number tells you what already happened. The trading update tells you whether consensus forward estimates need to move. For Woolworths in February 2026, the trading update was the catalyst that repriced the stock.
This matters for your assumptions about defensive names. Many retail investors carry the belief that blue-chip consumer staples are a safe place to park capital through reporting season. When positioning is concentrated and a specific overhang is resolvable, the volatility is not limited to growth or cyclical names. Defensive stocks can move just as hard.
CBA and BHP in February 2026: what a banking beat and a dividend surprise actually look like
The same expectations-gap mechanism produced outsized moves in Commonwealth Bank and BHP during February 2026, but through completely different channels. Understanding the distinction tells you that “beat” is not a single thing.
CBA delivered a first-half FY2026 result that came in above what the market had anticipated, with robust growth in its loan book, resilient revenue performance, and credit losses remaining well controlled. Shares advanced 6.8% on 11 February 2026, then a further 5.4% the following session, a two-day move of over 12% (Market Index/Kerry Sun). The reaction was driven by earnings quality: the profit beat was clean, supported by the metrics that matter most for bank valuations, specifically net interest margin stability and loan loss provisioning.
BHP’s result operated through a different mechanism entirely. The earnings beat was modest. What moved the stock to a new all-time high was the dividend.
- Underlying attributable profit up more than 20% to approximately US$6.2 billion
- Underlying EBITDA up 25% to US$15.5 billion
- Interim dividend of US$0.73 per share, approximately 44-50% above the prior corresponding period, at a 60% payout ratio
Copper contributed 51% of Group Underlying EBITDA, the first time copper has exceeded 50% of group earnings, reinforcing the market’s repricing of BHP’s earnings quality away from pure iron ore dependence.
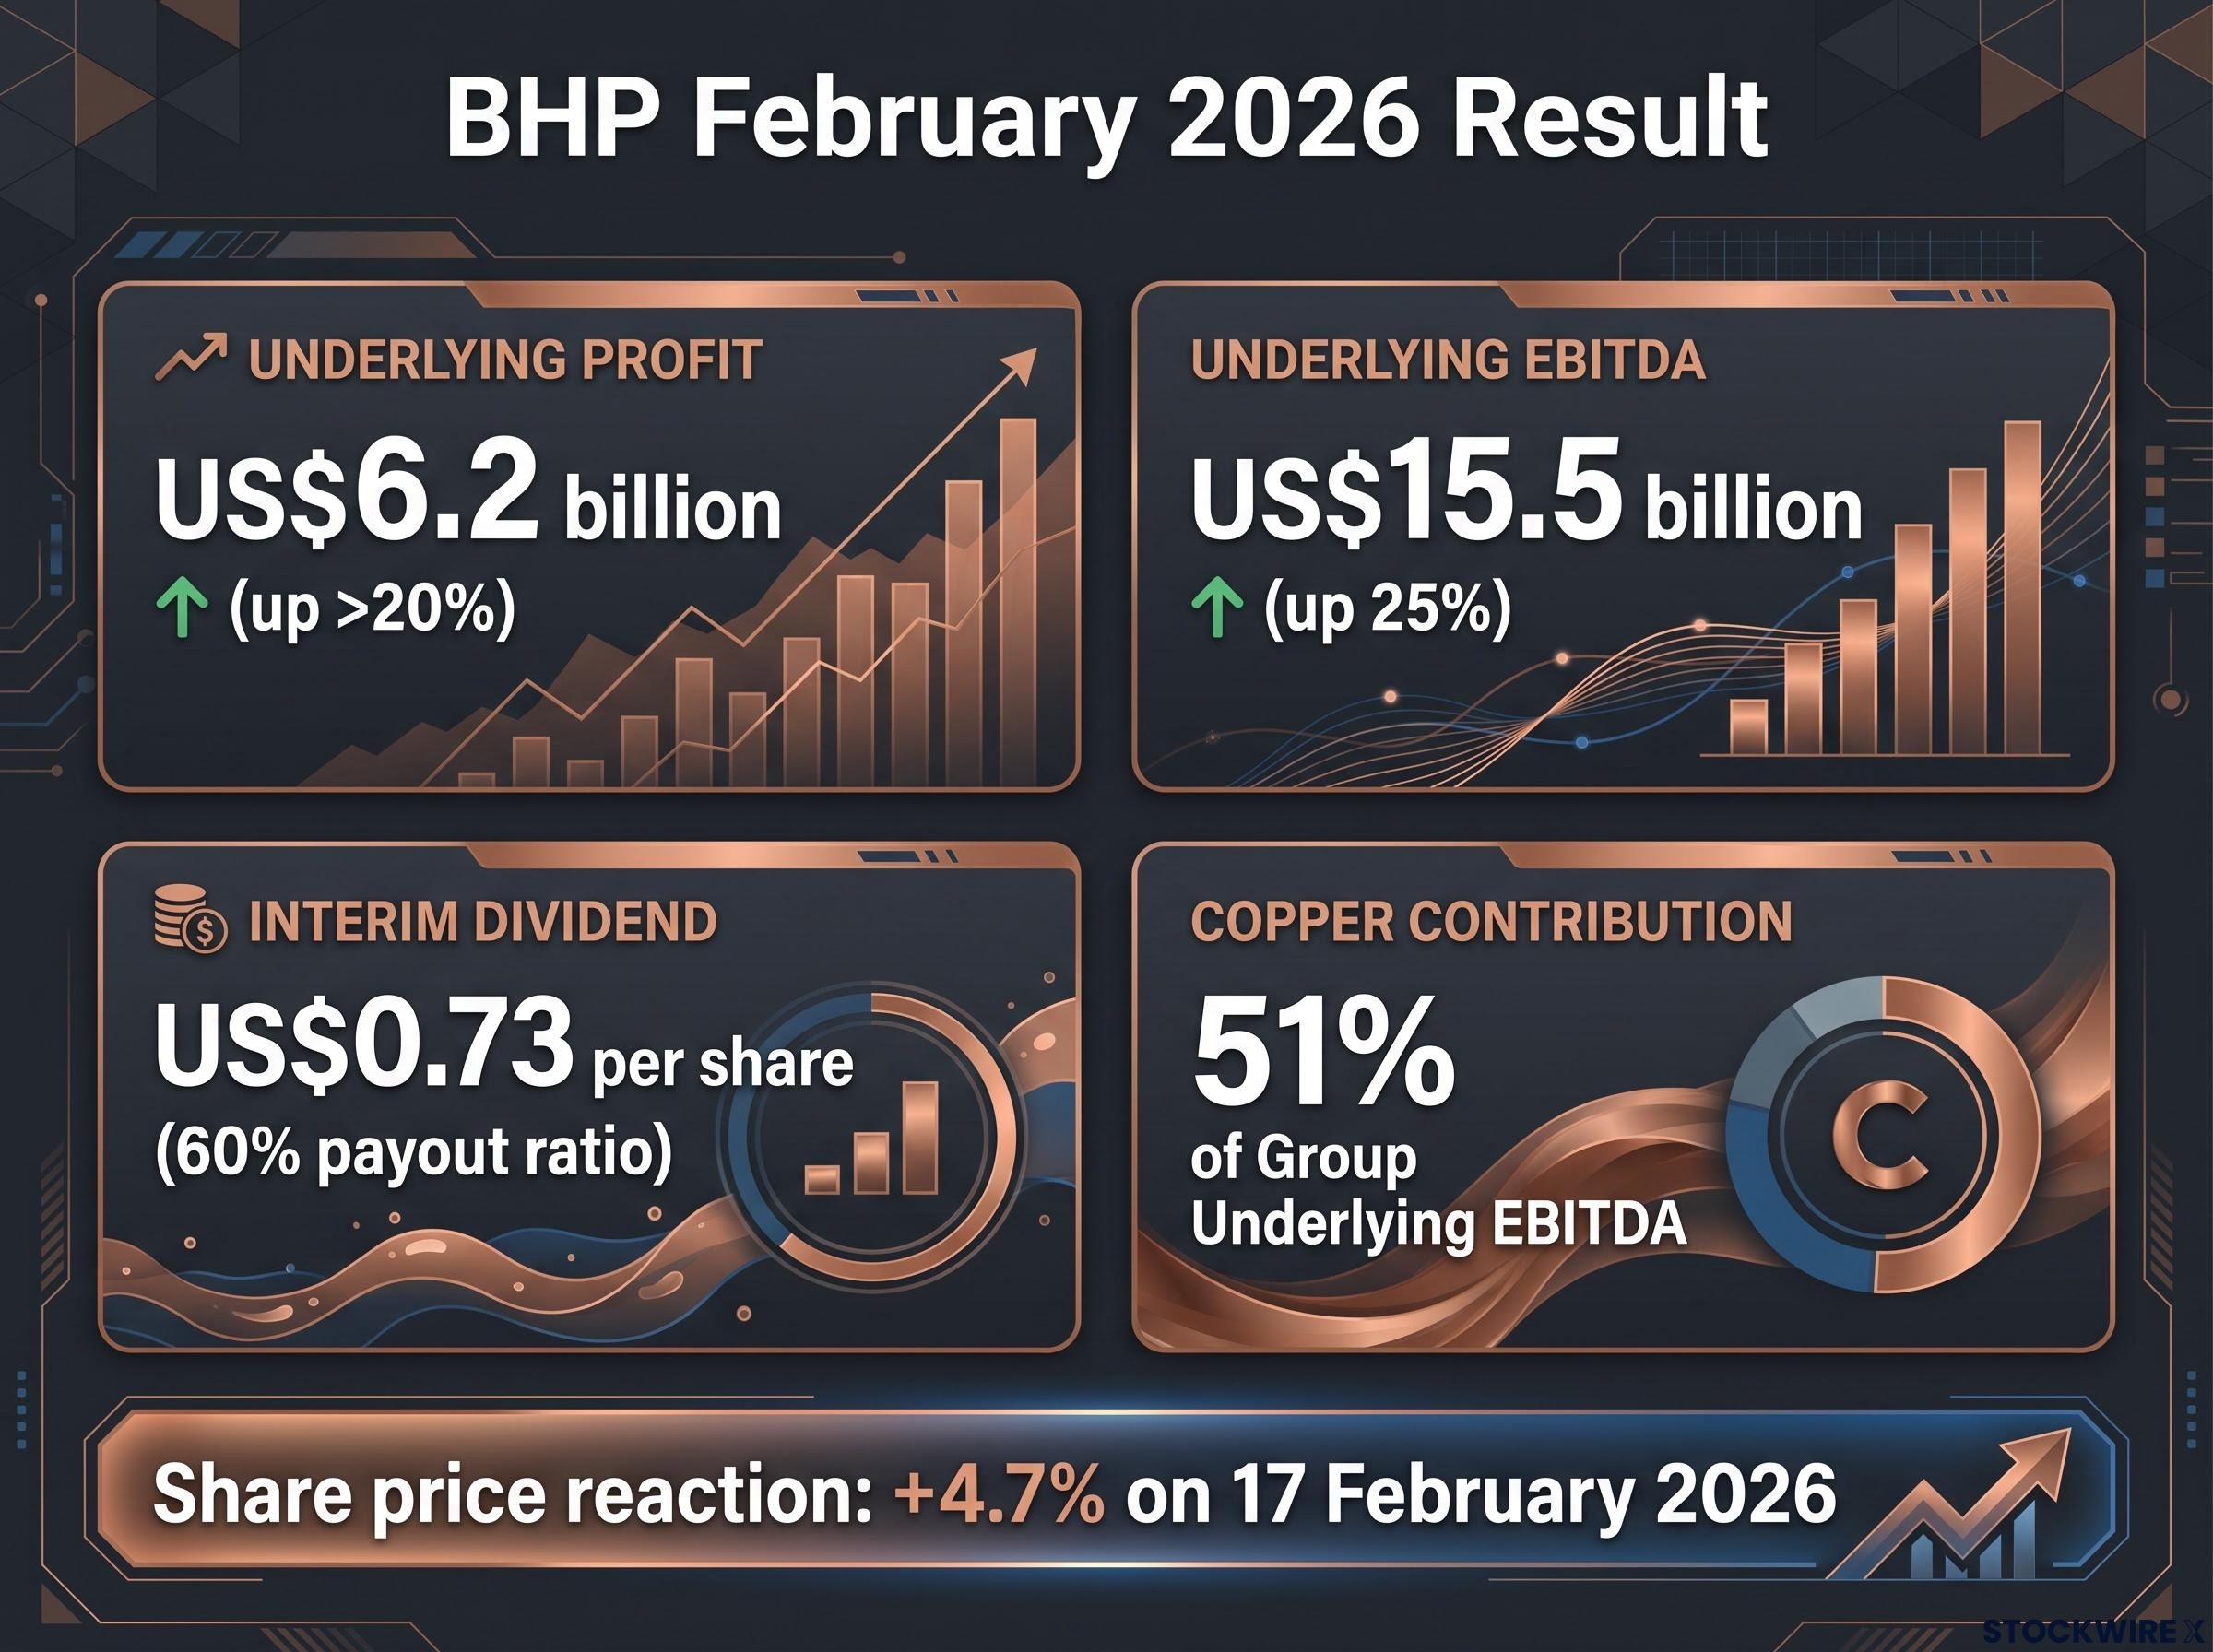
On 17 February 2026, BHP shares advanced 4.7% to post a fresh all-time high, capping a result that combined a modest earnings beat with a dividend well ahead of consensus (Market Index/Kerry Sun).
The dividend surprise illustrates a dynamic that matters specifically for Australian investors. In an income-heavy equity market dominated by superannuation, a payout above consensus forces a structural repricing. Income-oriented holders and super funds must re-rate the stock to a higher price to keep the yield aligned with their required return. That repricing can move a stock 4-5% in a single session regardless of how the earnings headline reads.
Dividend mechanics help explain why a payout above consensus forces a structural repricing rather than simply rewarding existing holders: when the stock price falls by approximately the dividend amount on the ex-dividend date, income-oriented super funds must reprice the stock higher before the distribution to maintain their required yield, amplifying the pre-result buying pressure.
The CBA and BHP cases together show you that earnings season reactions are multi-dimensional. The profit beat matters. But the dividend line and the earnings quality narrative can each independently drive a re-rating.
What actually drives the size of the market’s reaction: a framework for reading results
The three case studies illustrate three distinct catalysts that drive re-ratings during reporting season. They are not interchangeable, and recognising which one is in play before a result drops changes how you read the pre-result share price.
The first is the earnings beat: a reported profit that exceeds consensus estimates, repricing the company’s near-term earnings trajectory. CBA is the example.
The second is the dividend surprise: a payout that exceeds consensus, forcing income-oriented holders to reprice the stock to maintain yield alignment. BHP is the example.
The third is trading-update overhang resolution: forward-looking commentary that eliminates a specific source of market doubt, triggering a structural re-rating rather than a single-period reaction. Woolworths is the example.
Behind all three, algorithmic trading compresses the initial reaction into milliseconds. The first move on a result is frequently algorithmic, driven by systems that parse releases and trade off keywords and numbers before human investors have finished reading the summary. The institutional position-rebuilding that follows, as fund managers update their models and resize holdings, extends the move across one to two sessions after the initial gap.
CommSec data from February 2026 confirms the baseline: approximately half of monitored companies moved at least 5% on result day, and roughly 20% moved at least 10%. The FactSet asymmetry of +3.4% for beats versus -7.7% for misses frames why the downside of being wrong is structurally larger than the upside of being right.
The equity risk premium on the ASX 200 sat at approximately 80 basis points heading into the August 2026 season, a historically thin buffer that means even moderate earnings misses from consumer-facing names can produce outsized index reactions rather than the contained single-stock moves a more generously valued market would absorb.
Here is a practical checklist for approaching any result:
- What is the consensus expectation for earnings and revenue?
- How does the reported result compare to that consensus?
- Did the dividend meet, beat, or miss consensus?
- What does the trading update say, and does it resolve or create new uncertainty?
Knowing the three catalyst types before a result is announced gives you a structured lens for evaluating the pre-result share price. You can assess whether the current valuation adequately prices each direction of risk, rather than simply hoping for the best.
Positioning yourself for the next reporting season, not just the last one
The next major ASX reporting window is already here: August 2026, when most companies with June financial year-ends release their full-year results. Everything in this article applies directly to the weeks ahead.
ASX reporting season August 2026 arrives with its own structural tension: analysts are forecasting 12% earnings growth, the strongest collective result in nearly four years, yet investor sentiment has collapsed to the 95th percentile of all historical survey readings, a combination that amplifies the expectations-gap mechanism described throughout this article.
The practical takeaways from February 2026 are specific and repeatable:
- Know the consensus before the result. Consensus EPS, revenue, and dividend forecasts are available through broker platforms and data services. The share price already reflects these expectations; the reaction is driven by the gap.
- Read the trading update as carefully as the profit line. Forward-looking commentary and current-half updates frequently drive the larger part of the price reaction, particularly in uncertain macro environments.
- Treat dividends as a separate surprise variable. In Australia’s income-heavy equity market, a dividend above or below consensus is a distinct repricing catalyst, independent of the earnings result.
- Size your positions for binary risk. Single-session moves of 5-10% in large caps, and 12-15% or more in extreme cases, are documented baseline outcomes across recent seasons, not exceptional events.
Most retail investors do not need to actively trade around results. But understanding the binary risk structure is non-negotiable for managing existing positions. If you hold a concentrated position into a reporting day, you are making a deliberate decision to accept that the stock may move 5-10% in either direction before lunch.
The elevated volatility of recent seasons is not a phase that has passed. August 2025 was the most volatile reporting season in at least a decade. February 2026 continued the trend, with the highest rate of three-standard-deviation moves since JPMorgan began tracking. The structural forces behind it, algorithmic trading, concentrated institutional positioning, elevated macro uncertainty, remain in place.
The investors who navigate this well are not the ones who predict results correctly. They are the ones who understand the mechanism, size accordingly, and read the right lines in the release.
This article is for informational purposes only and should not be considered financial advice. Investors should conduct their own research and consult with financial professionals before making investment decisions. Past performance does not guarantee future results.