At today’s NAB share price, generating $1,000 in annual passive income requires somewhere between $16,800 and $24,000 in capital. The gap between those two figures comes down to a single factor most investors overlook: the franking credit. Understanding how it works changes the entire investment case.
NAB is one of the most widely held dividend stocks on the ASX, and its share price has climbed roughly 16% since June 2026. That move matters because it directly affects how much capital a new buyer needs to deploy to hit a specific income target. With the stock trading near $41.25, the entry price question is unusually live right now.
Here is the exact framework for working out what NAB needs to pay you, what you need to invest to receive it, and whether the current price makes that calculation attractive or demanding. You can apply this to any income target, not just $1,000.
The baseline number: what $1,000 in NAB dividends actually costs
Start with the simplest version. Based on the FY27 projected dividend of $1.72 per share (sourced from Commsec analyst forecasts), here are the three inputs you need:
- Dividend per share: $1.72 (FY27 forecast, fully franked)
- Shares required: $1,000 ÷ $1.72 = approximately 582 shares
- Capital required: 582 × $41.25 = approximately $24,000
That $24,000 figure is the headline answer most investors stop at. It assumes you are counting only the cash dividend that hits your brokerage account, with no consideration of franking credits.
For context, the FY26 forecast dividend sits at $1.70 per share, representing a 1.2% year-on-year increase into FY27. The growth is modest, but consistency is the point here, not acceleration.
The $24,000 figure is the higher of the two calculations. The more useful number, the one that accounts for the tax already paid on your behalf, comes next.
When big ASX news breaks, our subscribers know first
What franking credits actually do to the calculation
A franking credit represents corporate tax that NAB has already paid on the profits from which your dividend is funded. When NAB earns a profit and pays 30% corporate tax on it, the remaining amount flows to you as a cash dividend. The franking credit is a receipt for that tax payment, passed through to you as the shareholder.
The 30/70 formula underpins all franking credit calculations: dividing the cash dividend by 0.70 yields the grossed-up value, while multiplying by 30/70 isolates the credit itself, a mechanic that applies identically whether you hold 100 NAB shares or 10,000.
This matters because it changes how much your dividend is worth for tax purposes. Here is how the gross-up works, step by step.
You take the cash dividend of $1.72 and divide it by (1 minus the corporate tax rate): $1.72 ÷ 0.70 = approximately $2.46 per share. That $2.46 is the grossed-up value, which represents the full pre-tax income your dividend is worth.
Now the arithmetic shifts. To reach $1,000 on a grossed-up basis, you need $1,000 ÷ $2.46 = approximately 407 shares. At $41.25 per share, that requires approximately $16,800 in capital.
| Income Method | Shares Required | Capital Required | Dividend Per Share (Effective) |
|---|---|---|---|
| Cash dividend only | ~582 | ~$24,000 | $1.72 |
| Including franking credits (grossed-up) | ~407 | ~$16,800 | $2.46 |
The franking credit difference: approximately $7,200 less capital required to reach the same $1,000 income target when you account for the tax NAB has already paid on your behalf.
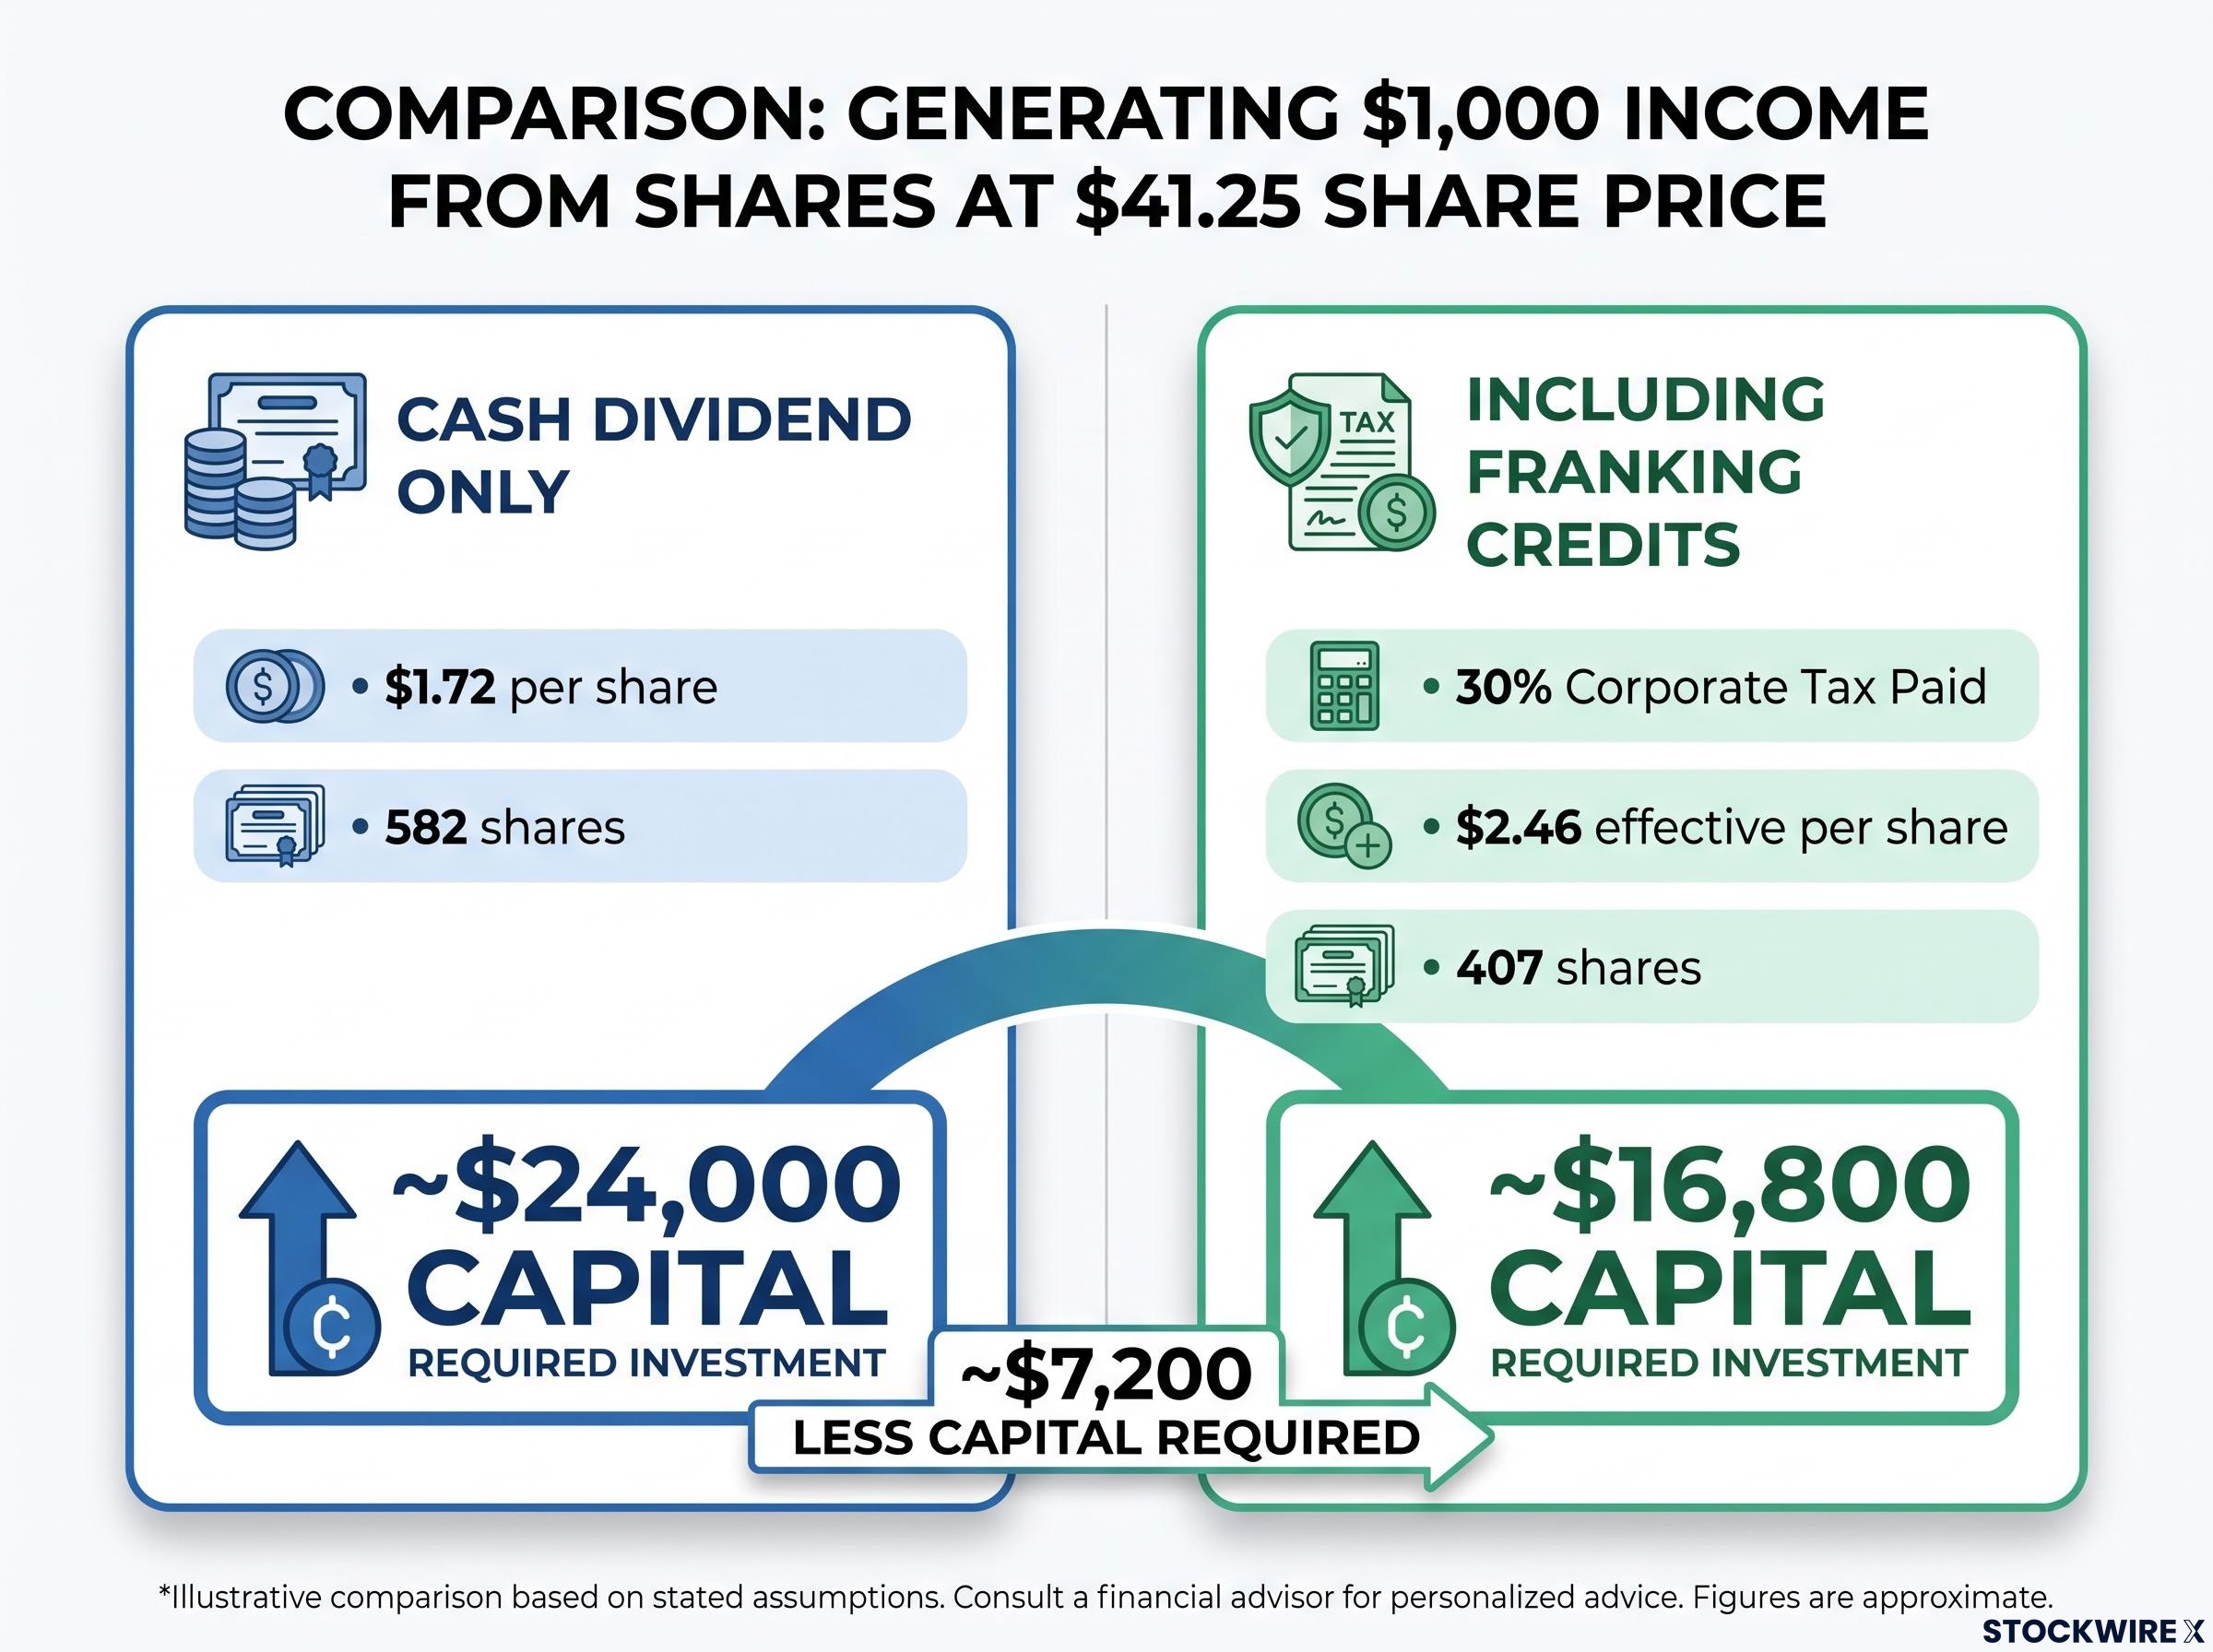
That $7,200 gap is what franking credits are worth in practical terms to an Australian resident investor targeting $1,000 in annual income from NAB. But whether you can fully capture that benefit depends on something personal: your tax rate.
Why your tax rate determines which calculation is right for you
The grossed-up figure of $2.46 per share is a comparison tool, not a cash-in-hand promise. What you actually receive after tax depends on where you sit on the marginal tax rate scale.
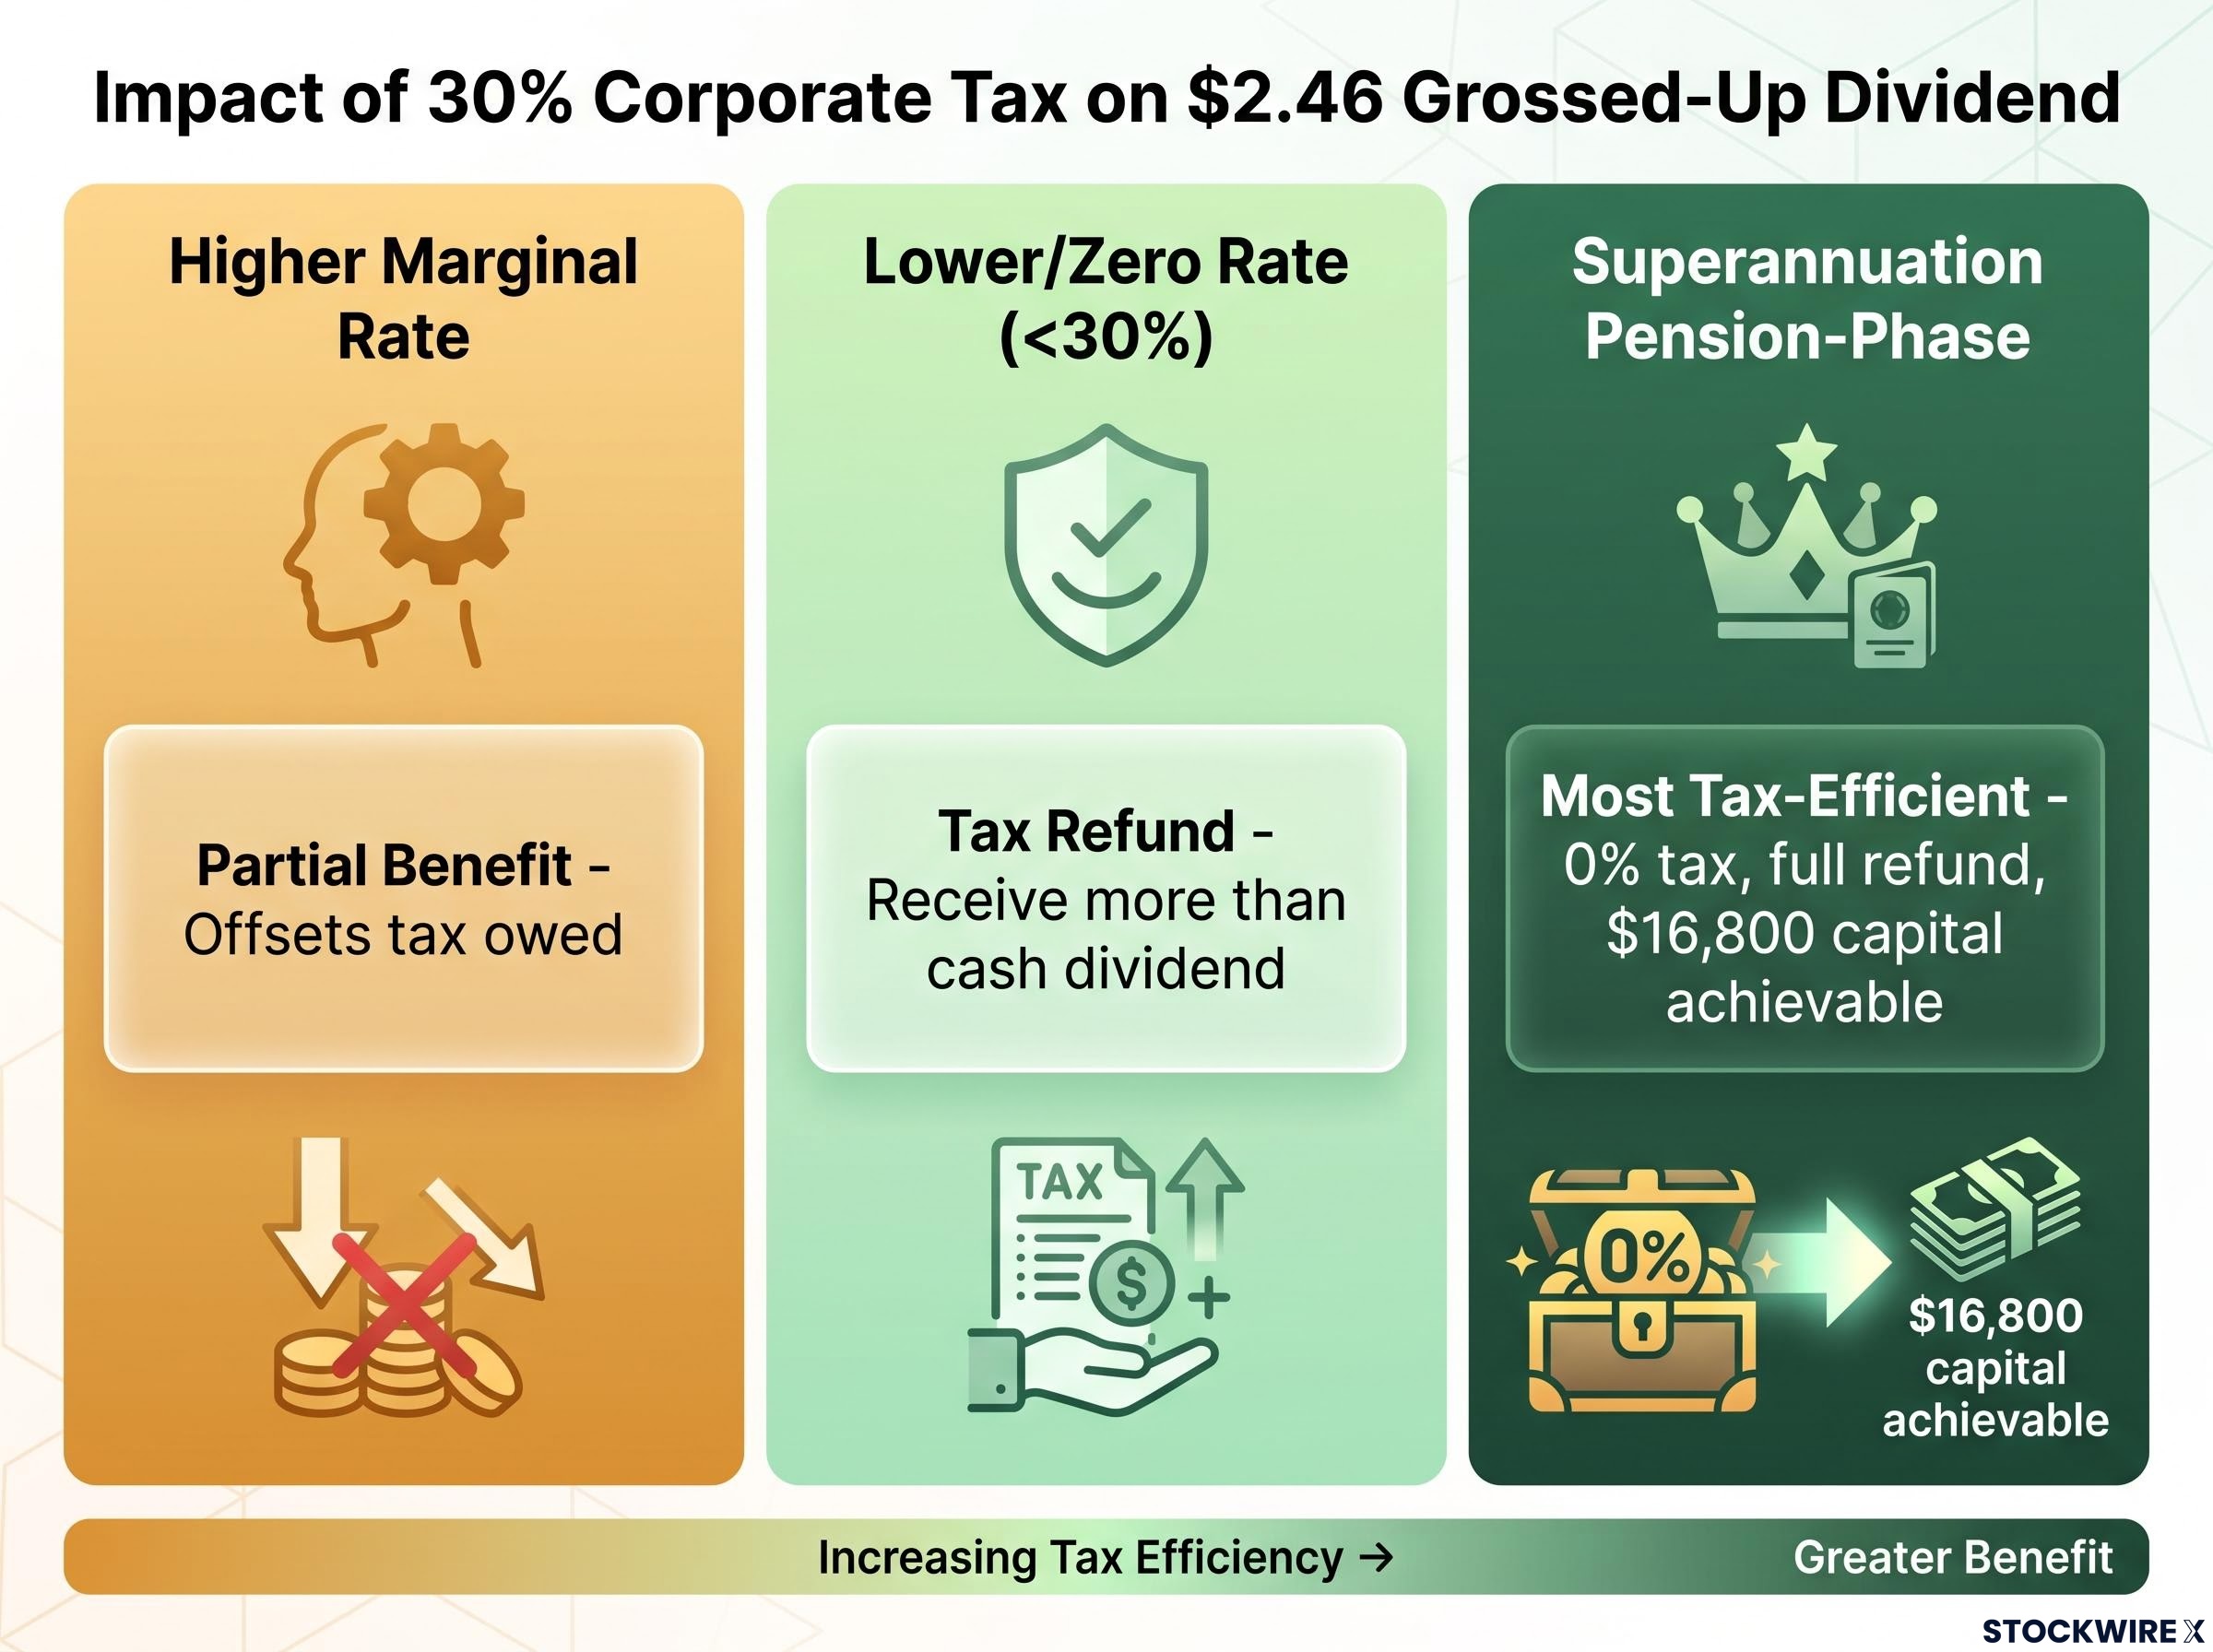
- Higher marginal rate taxpayers: Your franking credits offset the tax you owe on dividend income. You still pay tax, but less than you would without the credits. The benefit is real but partial.
- Lower-rate or zero-rate taxpayers: If your marginal tax rate is below the 30% corporate rate, the difference comes back to you as a tax refund. You receive more than the cash dividend alone.
- Superannuation pension-phase investors: This is the most tax-efficient scenario. Pension-phase super funds pay no tax on investment income, which means the full franking credit is refundable. The entire grossed-up value converts to real money in your hands.
For a pension-phase superannuation investor, franking credits convert a portion of the dividend’s tax value into genuine additional cash at tax return time. That makes the $16,800 capital figure genuinely achievable rather than theoretical.
ASFA’s dividend imputation guidance confirms that superannuation funds in the pension phase face a zero tax rate on investment income, meaning any franking credits attached to dividends become fully refundable rather than merely offsetting a tax liability.
If you are not sure which scenario applies to you, a conversation with a tax professional is worth the cost. The difference between the three scenarios can shift your required capital by thousands of dollars.
How NAB’s 16% price run-up changes the entry calculation
Share price and dividend yield move in opposite directions. When the share price rises and the dividend stays the same, your effective yield as a new buyer compresses. You need more capital to generate the same income.
NAB’s price has climbed approximately 16% since June 2026, which means the yield available to a buyer today is lower than it was two months ago. The current forward yield sits at approximately 4.1-4.3%, reflecting that compression.
Comparing NAB’s grossed-up yield against unfranked alternatives like term deposits or international ETFs requires adjusting each figure to the same pre-tax basis; without that adjustment, a 4.3% fully franked yield and a 4.3% unfranked yield look identical but deliver meaningfully different after-tax outcomes.
Analyst consensus price target: $38.56, derived from nine recent analyst ratings compiled via CMC Invest, implying a potential decline of more than 6% from the current price.
That target suggests the stock may already be trading above what analysts collectively consider fair value. Here is what the price sensitivity looks like in practice:
- At $41.25 per share: you need approximately $24,000 (cash only) or $16,800 (grossed-up) to hit $1,000
- At $38.56 per share: both capital requirements drop, and the effective yield improves because you are paying less for the same dividend stream
An investor buying at $41.25 is paying a premium over the analyst consensus target. That means the capital figures calculated throughout this article represent the more demanding version of the equation, not the most favourable one. A pullback toward $38.56 would reduce the capital required and improve your entry yield simultaneously.
What NAB’s dividend track record tells you about income reliability
Forecast figures are only as useful as your confidence in them materialising. NAB’s recent dividend history provides grounding.
- 2026 interim dividend: $0.85 per share, 100% franked
- FY26 full-year forecast: $1.70 per share (fully franked)
- FY27 full-year forecast: $1.72 per share (fully franked)
The $0.85 interim payment is exactly consistent with the $1.70 full-year forecast for FY26, which in turn supports the $1.72 FY27 projection. Since the COVID-disrupted year of 2020, NAB has built a record of steady, fully franked payouts that have edged progressively higher across the current decade. In weaker economic conditions, households typically keep up with loan repayments before cutting back on other spending, providing a degree of structural protection for NAB’s ability to sustain its dividend. No company can guarantee its dividend, but NAB operates at a scale that few other ASX-listed banks can match, which reinforces the relative reliability of its payout history.
The consistency between the recent interim payment and the full-year forecast tells you the $1.72 FY27 projection is grounded in observable data, not purely speculative. That matters when you are deciding whether to commit $16,800 or $24,000 to a single stock.
What the numbers mean for investors weighing NAB at today’s price
The capital required to generate $1,000 in annual passive income from NAB sits in a range: approximately $16,800 on a grossed-up basis (if your tax situation supports full franking credit benefit) to approximately $24,000 on a cash-dividend-only basis. Both figures assume an entry price around $41.25 and an FY27 dividend of $1.72 per share.
The capital required to live off dividends scales directly with the target income level: at a 5.5% grossed-up portfolio yield, reaching $50,000 in annual income requires roughly $910,000, while $100,000 in annual income requires approximately $1,820,000, figures that put the $16,800-$24,000 NAB calculation in broader portfolio context.
The current valuation introduces a timing variable. With the analyst consensus target at $38.56, waiting for a pullback would reduce your capital requirement and improve your effective yield simultaneously. At today’s price, the forward yield sits at approximately 4.1-4.3%; at a lower entry point, the same dividend buys you a better return on capital deployed.
The framework presented here is a tool for thinking clearly about the trade-off between NAB’s reliable dividend history, the franking credit benefit, and the current entry price. It is not a recommendation to buy or sell. Your personal tax rate, your income target, and your view on whether the current price offers sufficient value are the variables only you can weigh.
This article is for informational purposes only and should not be considered financial advice. Investors should conduct their own research and consult with financial professionals before making investment decisions. Past performance does not guarantee future results. Financial projections are subject to market conditions and various risk factors.