
In February 2026, JPMorgan made a high-conviction call: European equities were underowned, undervalued, and poised to outperform a U.S. market increasingly concentrated in AI mega-caps. Six months later, the bank raised its year-end index targets and reaffirmed its overweight stance. The call has held.
The thesis was built on five converging pillars: earnings recovery from a low base, reasonable valuations relative to growth prospects, improving macro momentum, a supportive ECB rate backdrop, and the structural underownership of European equities by global investors. Each pillar pointed in the same direction simultaneously, which is precisely why the call carried institutional weight. Understanding how that multi-factor framework performed through H1 2026 gives you a more rigorous basis for second-half allocation decisions than a simple price-chart review.
Here is the framework for evaluating whether the remaining upside case is earnings-driven, re-rating-driven, or rotation-driven, and what that distinction means for how you size and structure European exposure heading into the rest of the year.
How JPMorgan built its European overweight in five pillars
The February 2026 thesis rested on five reinforcing signals, each drawn from a different analytical domain:
- Earnings recovery: Approximately 20% Eurozone earnings growth expected in 2026 after a 2025 contraction, powered by a low base.
- Relative valuation: European equities valued at a notable discount to U.S. peers, with dividend yields and buyback programmes offering shareholder return characteristics that U.S. growth benchmarks could not replicate.
- Macro momentum: By early 2026, the Citi Economic Surprise Index (CESI) for the Eurozone had reached a two-year peak, while PMI data and credit growth were both trending positively.
- ECB policy support: Rate headwinds from 2023-2024 were expected to decline, with lower bond yields providing a valuation tailwind through reduced discount rates.
- Structural underownership: Global investors were materially underexposed to Europe, creating a mechanical flow tailwind once fundamentals began to confirm.
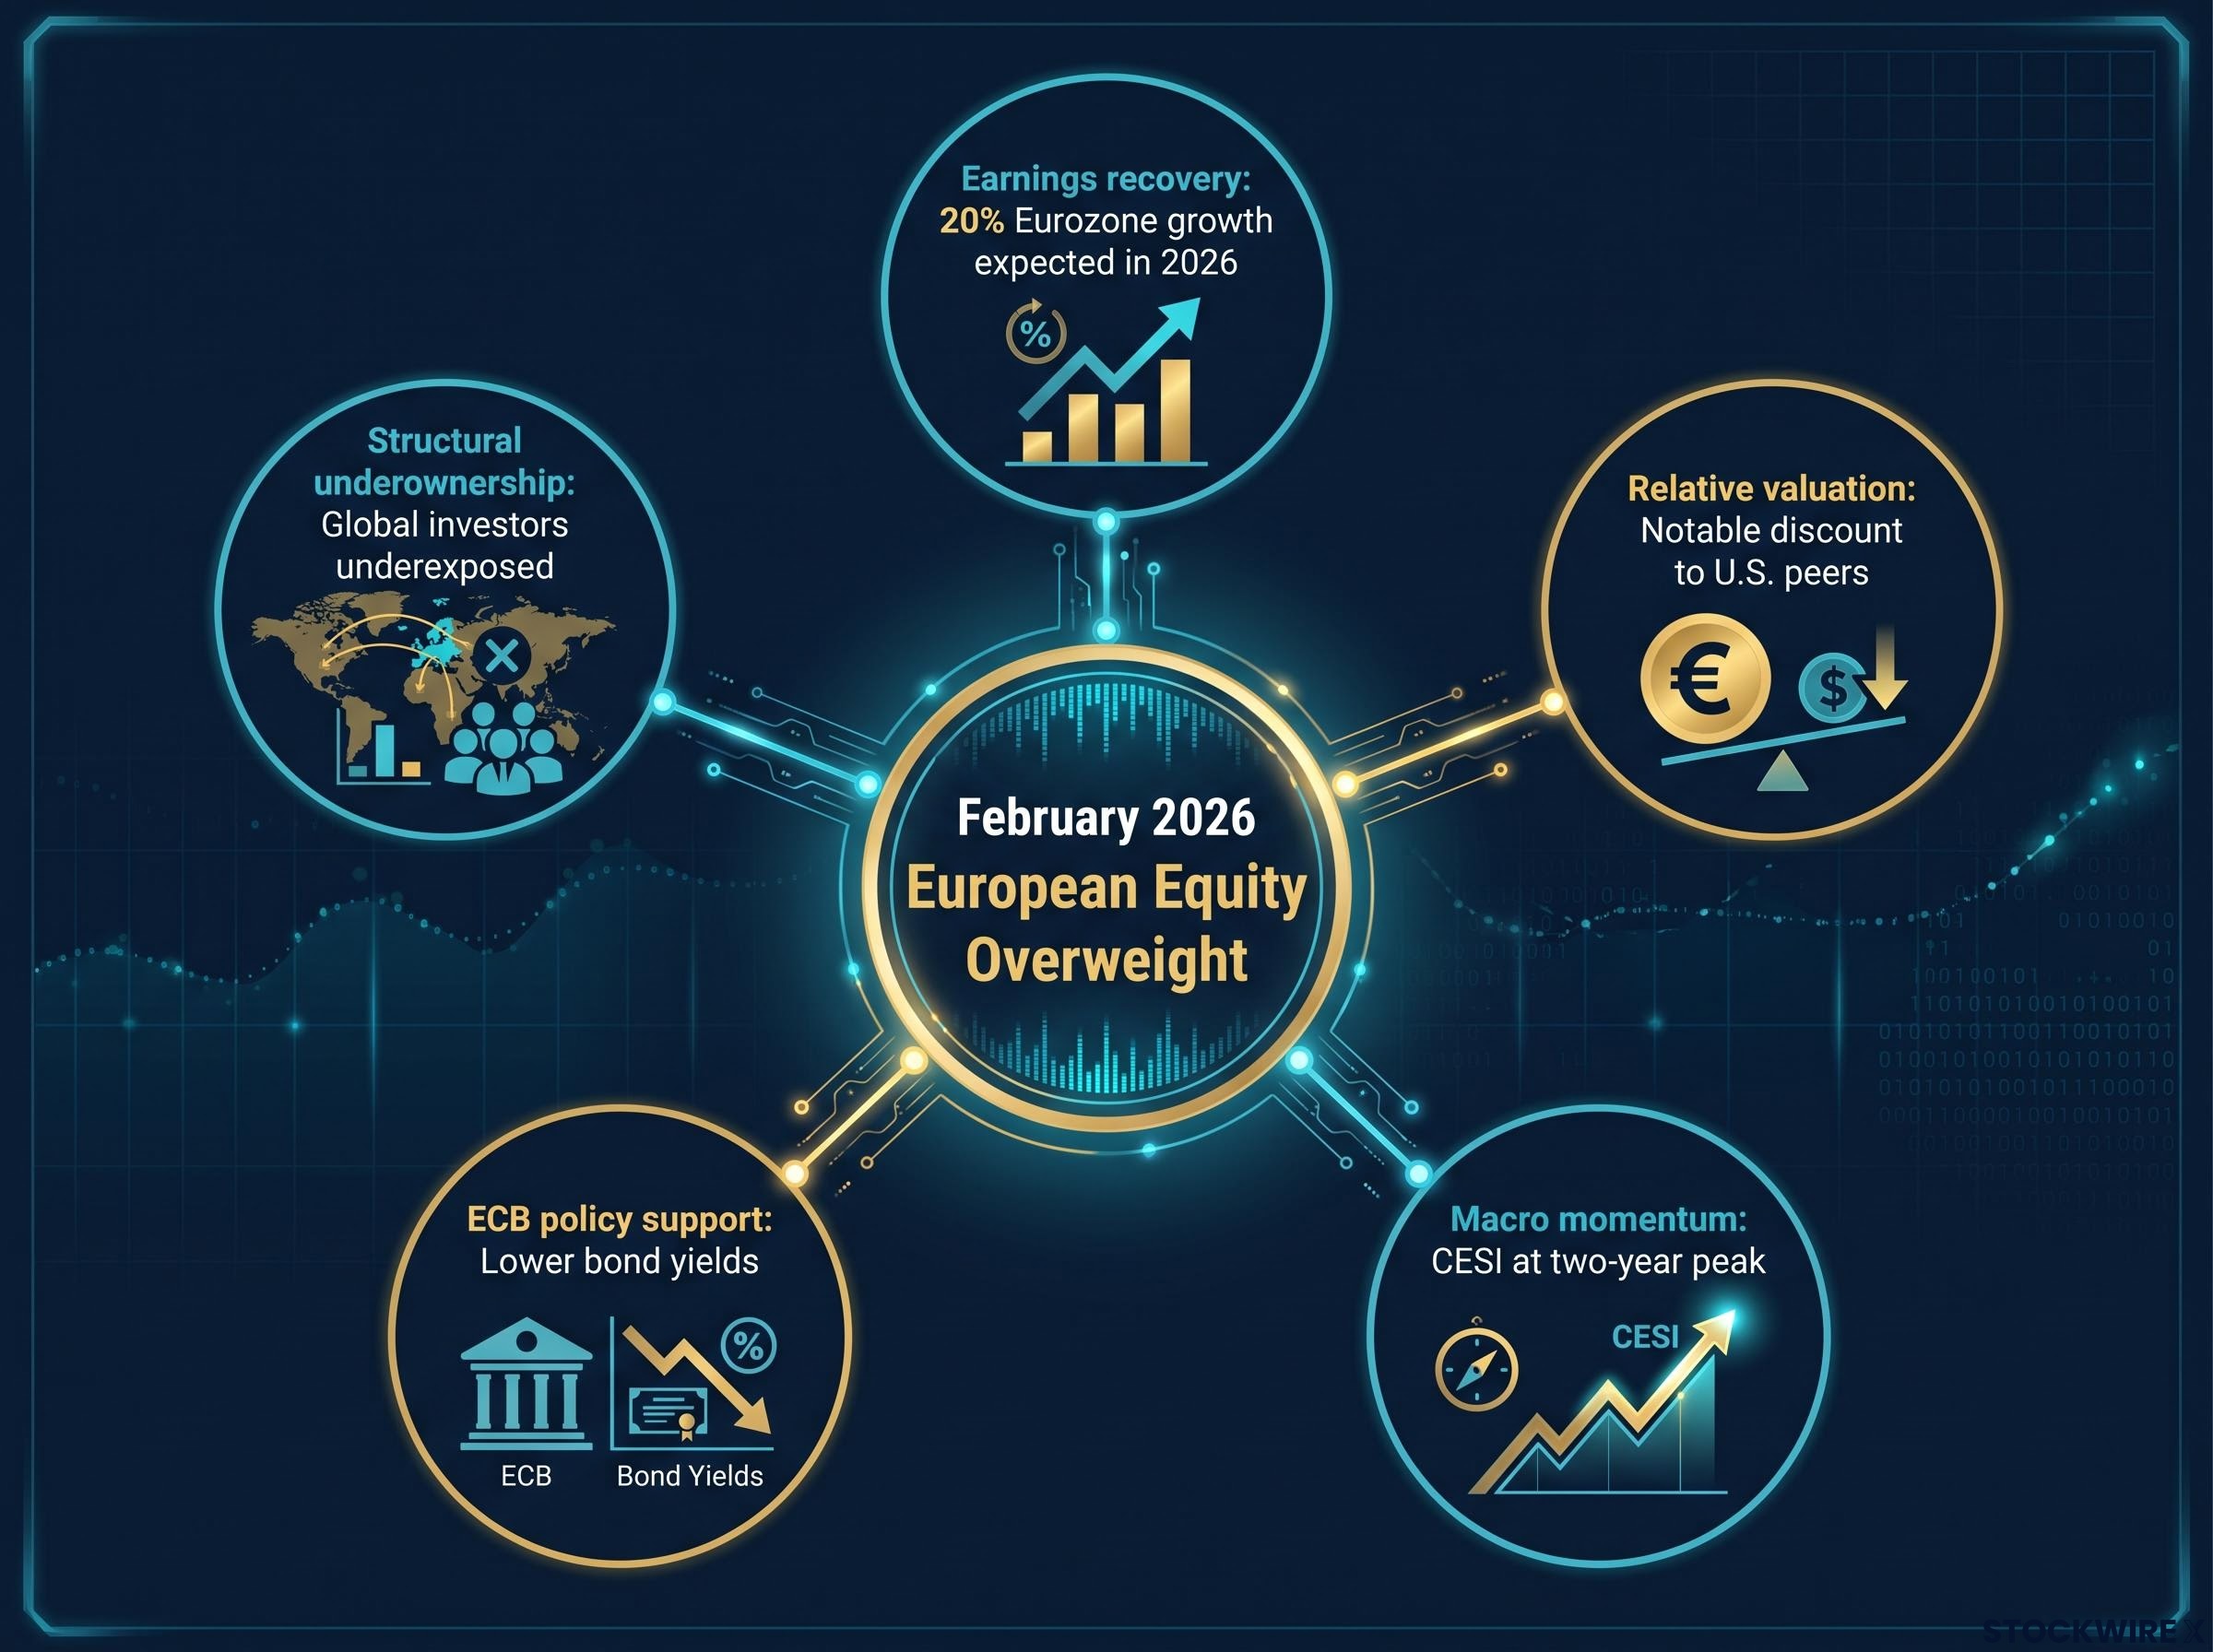
The call’s weight came from convergence. Any one of these pillars in isolation is a thesis fragment. Five independent variables pointing the same direction is a structural argument, and the early results supported it: in 2025, Eurozone equities had posted roughly 7% outperformance over U.S. equities in local currency total return terms, and by early 2026 that gap had extended to approximately 12% for Europe versus around 9% for the U.S. year-to-date.
Why underownership was the fifth and often overlooked pillar
Fundamental improvement alone does not move prices unless capital follows. The positioning data showed global allocators were structurally underweight Europe, which meant even modest earnings beats or macro confirmation could trigger outsized inflows. This is the mechanism that converts a sound analytical case into actual returns: the gap between where capital sits and where fundamentals say it should sit.
The structural underownership of European equities by global allocators is quantifiable: MSCI EAFE trades at roughly a 50-55% forward P/E discount to the S&P 500 information technology sector, a spread near multi-decade extremes that historically precedes underperformance by the dominant cohort in subsequent years.
When big ASX news breaks, our subscribers know first
What European equities and shareholder returns actually look like
The MSCI Europe index is a fundamentally different asset class from the U.S. benchmarks most investors track daily. Its sector composition skews toward banks, industrials, energy, and consumer staples rather than the technology mega-caps that dominate the S&P 500. That composition shapes both the return profile and the income characteristics.
European equities structurally deliver higher dividend yields than their U.S. counterparts. The value sectors at the heart of the index, including financials and energy, return cash to shareholders as a core part of their capital allocation. For income-oriented investors, that yield is not a bonus; it is a defining feature of the asset class.
The valuation picture requires precision. “Cheap relative to the U.S.” is not the same as “cheap in absolute terms.” As of June 2026, MSCI Europe traded at approximately 14.9x forward price-to-earnings (P/E), the ratio of a company’s share price to its expected earnings per share, which JPMorgan described as “not stretched on an absolute basis.” A separate JPMorgan Guide to the Markets placed the figure at 15.4x versus a 30-year historical average of 14.3x.
JPMorgan described MSCI Europe valuations as “not stretched on an absolute basis” as of June 2026.
| Metric | Value | Historical context |
|---|---|---|
| MSCI Europe forward P/E (June 2026) | 14.9x | Described as “not stretched on an absolute basis” |
| MSCI Europe forward P/E (Guide to the Markets) | 15.4x | Versus 30-year average of 14.3x |
| 30-year average forward P/E | 14.3x | Long-run valuation anchor |
| Global valuation dispersion | 78th percentile | Gap between high and low valuations over 30 years |
A forward P/E of 14.9-15.4x versus a 14.3x long-run average tells you that modest re-rating has already occurred. Future returns from here are more likely to be earnings-driven than multiple-expansion-driven, which directly affects how patient you need to be with entry timing and how you should size the position.
The MSCI Europe Index factsheet for June 30, 2026 records a forward P/E of 15.00x, corroborating the 14.9-15.4x range cited across JPMorgan research and confirming that modest re-rating has occurred without pushing valuations into stretched territory.
Scoring the thesis against H1 2026 outcomes
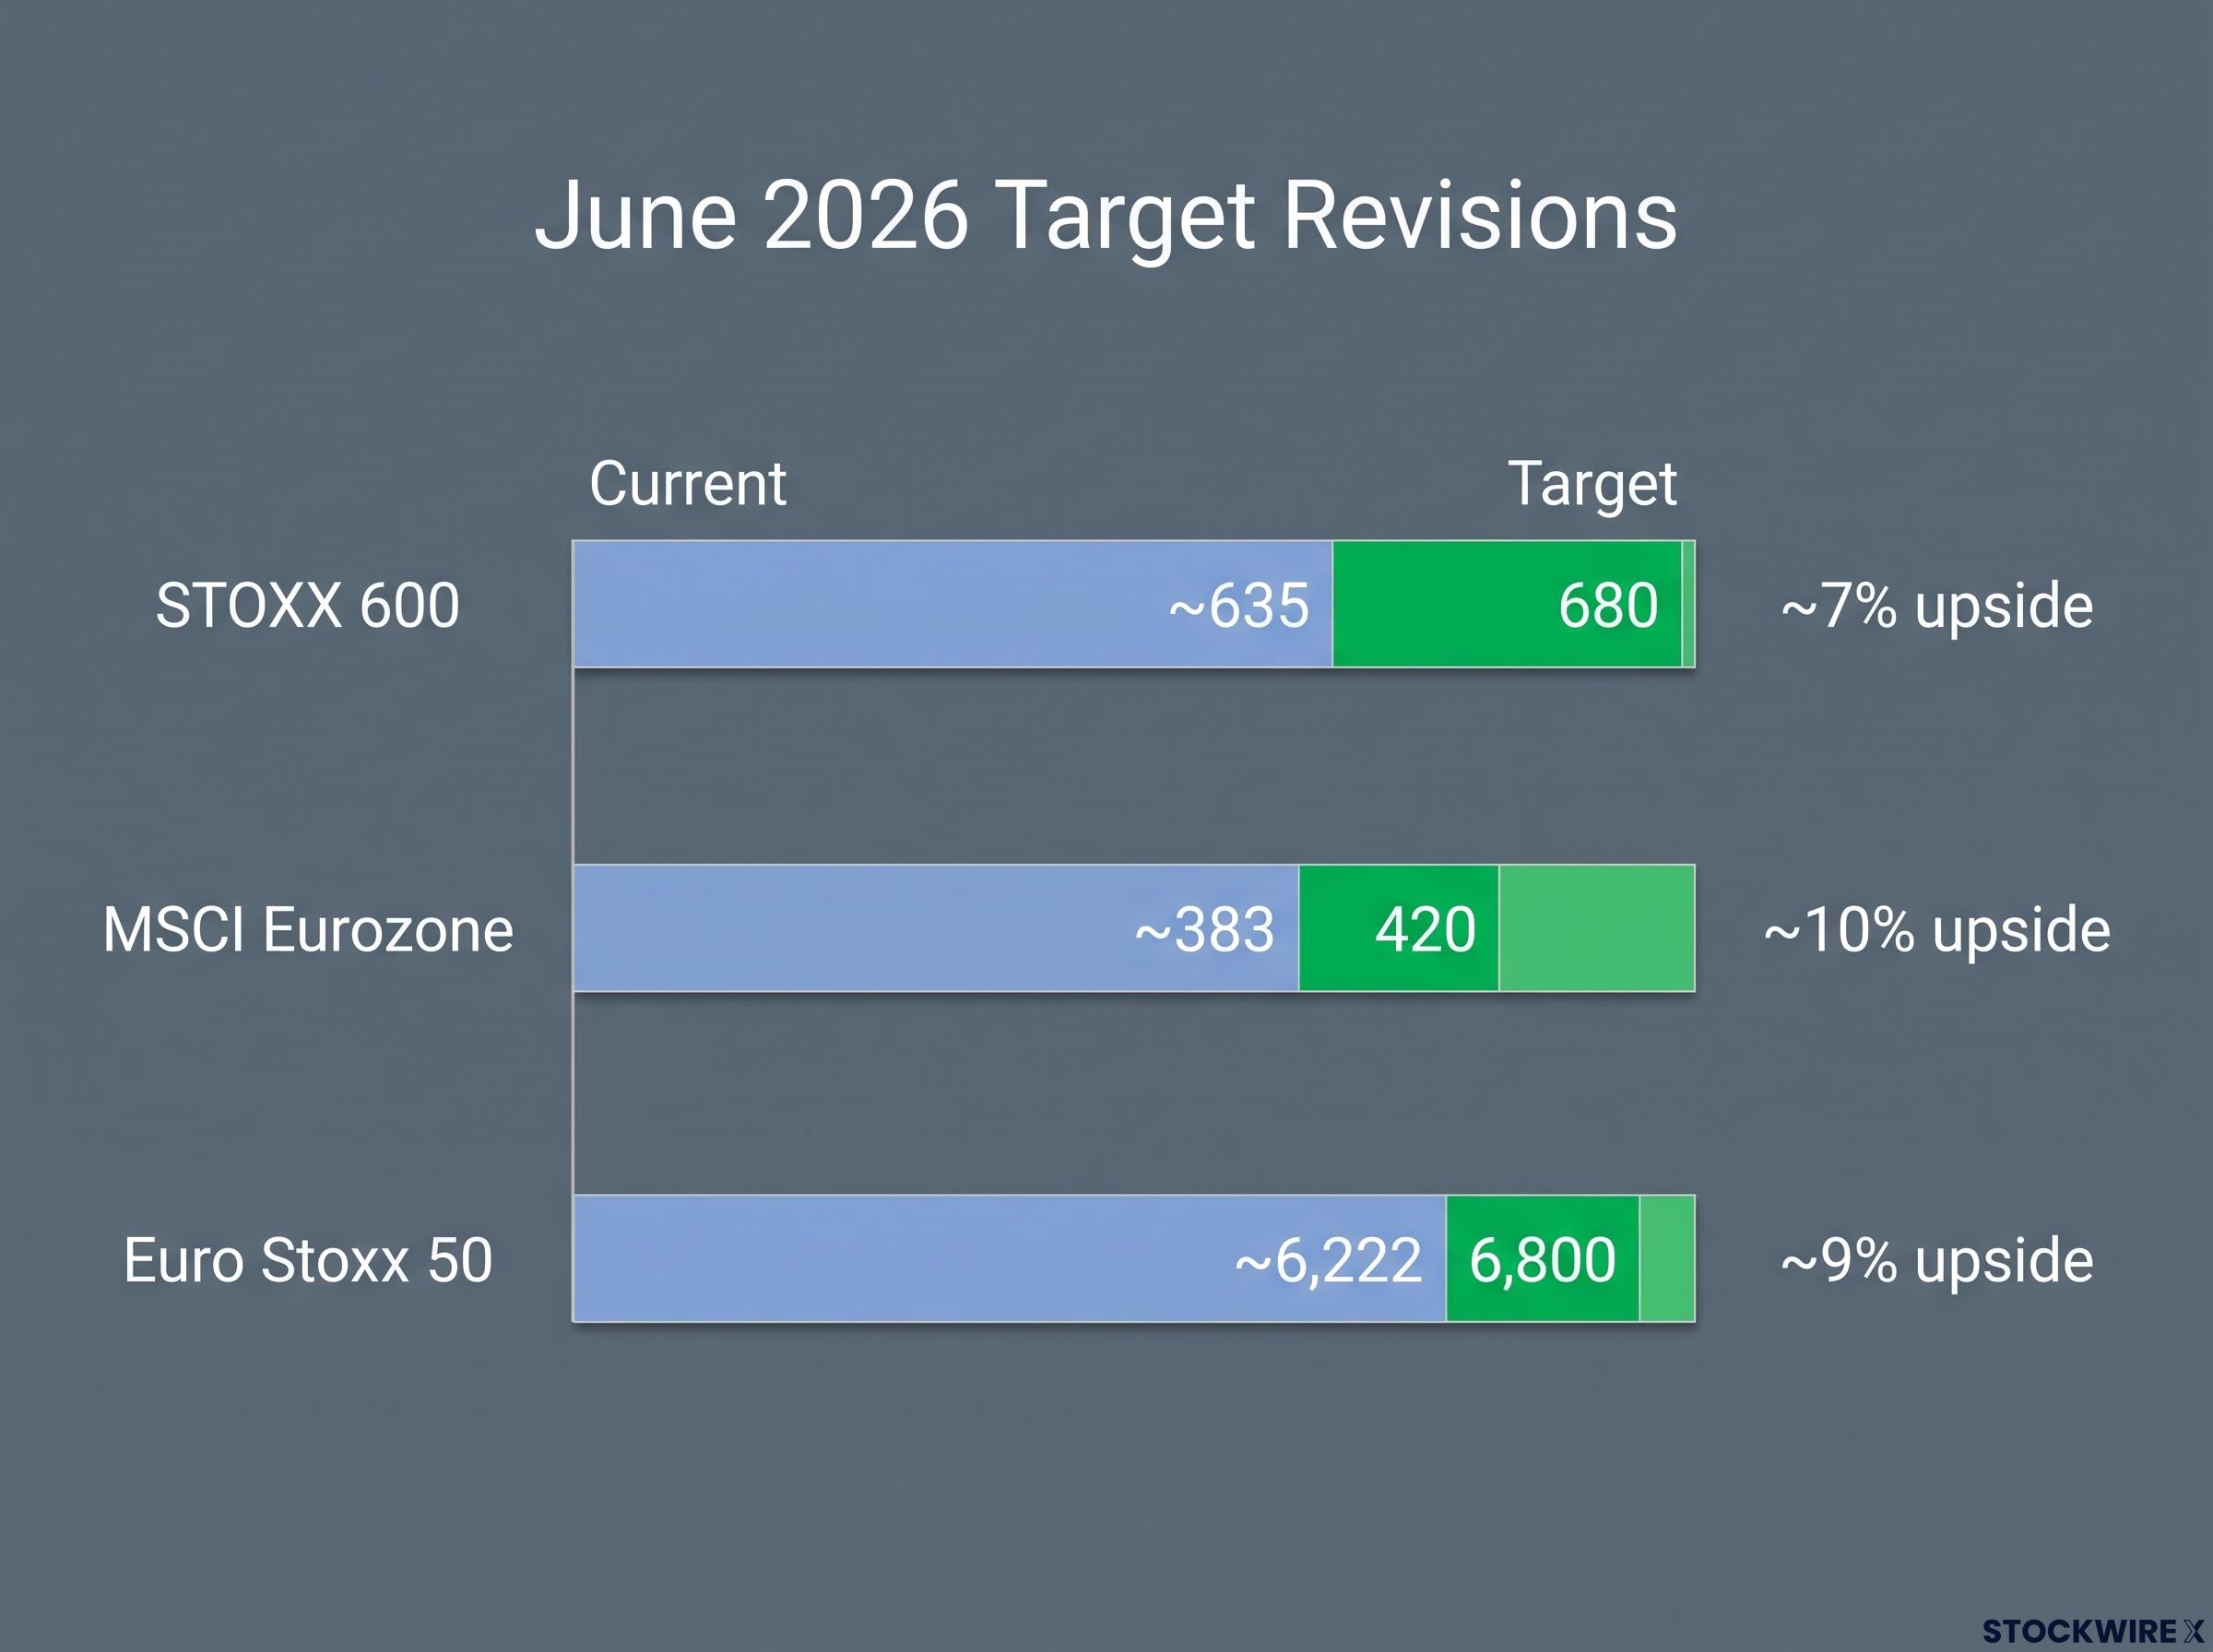
By June 2026, JPMorgan‘s original STOXX 600 target of 630 (which had implied 12% upside) had already delivered 13%. Rather than declaring victory, the bank raised targets across key European indices:
- STOXX 600: Raised to 680, implying approximately 7% upside from approximately 635.
- MSCI Eurozone: Raised to 420, implying approximately 10% upside from approximately 383.
- Euro Stoxx 50: Raised to 6,800, implying approximately 9% upside from approximately 6,222.
The macro tailwinds JPMorgan cited in the June revision were specific and verifiable:
- Lower bond yields, easing financing conditions and supporting equity multiples.
- Reduced tariffs, benefiting export-oriented European firms.
- A deeper-than-expected fall in oil prices, supporting industrial margins.
- A pickup in China’s economy, boosting European exporters with significant Asia exposure.
European bank stocks delivered the single most compelling sector-level validation: up 45% in U.S. dollar terms in H1 2026, combining earnings delivery with cyclical rotation evidence.
The fact that JPMorgan raised targets rather than stepping aside tells you the bank sees remaining fundamental justification for continued exposure, not just momentum. That is a materially different signal for how to hold European positions through H2.
| Pillar | Original expectation | H1 2026 outcome | Status |
|---|---|---|---|
| Earnings recovery | ~20% Eurozone earnings growth in 2026 | Banks +45% (USD); broad earnings strength confirmed | Intact |
| Relative valuation | Reasonable pricing with re-rating potential | 14.9-15.4x fwd P/E; modest re-rating, not stretched | Partially consumed |
| Macro momentum | Improving PMIs, credit impulse, positive surprises | CESI at two-year high; tailwinds cited in target upgrade | Confirmed |
| ECB policy support | Rate headwinds declining; dovish surprise possible | Lower bond yields explicitly supporting equity valuations | Confirmed |
| Underownership / rotation | Global investors structurally underexposed | Rotation underway; JPMorgan says investors still underexposed | Partially realised |
Where sector rotation stands and what it signals about the thesis
The index-level story is encouraging. The sector-level evidence is where the rotation thesis either holds or falls apart.
JPMorgan‘s current positioning within Europe is specific. Sectors where the bank is constructive:
- Banks: “Should also trade well, as they are leveraged to PMIs and to credit growth.”
- Industrials and mining: Benefiting from global activity improvements and the China pickup.
- Semiconductors: Cyclical and structural drivers extending beyond U.S. mega-cap AI names.
- Consumer plays: Constructive on long beta as the economic cycle remains resilient.
Sectors where JPMorgan is cautious:
- Business services, software, and media: Viewed as less attractive after strong prior runs.
- Defence: “Still not excited” after a period of outperformance.
JPMorgan characterises banks as assets that “should also trade well, as they are leveraged to PMIs and to credit growth.”
The 45% gain in European bank stocks in H1 is not just a return figure. It is evidence that the rotation from concentrated U.S. growth into European value cyclicals actually moved capital. Global valuation dispersion sitting at the 78th percentile over 30 years reinforces why value themes remain analytically compelling. JPMorgan‘s Private Bank notes that “strong, broad-based earnings growth including and beyond AI underlines conviction that stock markets will reach new highs in 2026,” which is the structural backdrop enabling European cyclicals to participate rather than watch from the sidelines.
For investors exploring how other institutional views align with or diverge from JPMorgan’s framework, our full explainer on the rotation into European equities covers Barclays’ parallel case for rotating out of semiconductor momentum into underowned European markets, including the ECB timing considerations shaping that call.
Risks the thesis has not yet fully tested
The scorecard reads well. That does not mean the remaining path is obstacle-free. Four risk categories deserve specific attention:
- Trade and tariff uncertainty: Export-oriented European firms remain exposed to renewed trade friction, even as growth has generally stabilised. JPMorgan‘s own research flags trade policy uncertainty as a residual risk.
- Earnings durability: After a powerful recovery from a low base, the analytical challenge shifts from whether earnings can recover to whether they can sustain at higher absolute levels. The easy base effects are now behind us.
- Internal JPMorgan differentiation: Some strategists in video commentary noted a preference for staying “a bit more defensive on Europe,” maintaining a tilt toward Asia and emerging markets even within a broadly constructive international equity stance. The rotation thesis is endorsed but not as a one-way bet.
- Currency exposure: Returns quoted in euro terms can differ materially from what dollar-based investors actually receive.
The three earnings season watchpoints Goldman Sachs identifies — AI cost savings on the income statement, energy cost pass-through across industrial supply chains, and competitive exposure to Chinese rivals — are precisely the variables that will confirm or undercut JPMorgan’s earnings delivery assumption heading into H2.
Currency exposure and the gap between local and USD-denominated returns
The 45% gain in European bank stocks was cited in U.S. dollar terms. That figure partially reflects EUR/USD amplification. When the euro strengthens against the dollar, European equity returns measured in USD get a boost on top of the underlying local-currency performance. This works symmetrically in the other direction: EUR/USD weakness would dampen dollar-denominated returns even if the underlying European index performance held steady.
For investors entering or adding to European exposure now, the key risk is not that the thesis was wrong but that the most powerful phase of the initial re-rating has passed. The remaining return path depends on earnings delivery holding up under macro and trade pressures that have not yet fully resolved.
What the scorecard tells investors positioning for H2 2026
The five-pillar framework delivers a clear forward view. The earnings pillar remains intact, with JPMorgan still expecting approximately 20% Eurozone earnings growth in 2026. The valuation pillar is partially consumed but not exhausted. The macro and policy pillars have been positively confirmed. And the positioning pillar, arguably the most mechanically powerful, has only partially unwound.
JPMorgan notes that global investors remain underexposed to Europe as of June 2026, suggesting the positioning tailwind has further to run.
JPMorgan‘s regional stance reflects this assessment: Eurozone at overweight, U.S. at neutral, UK at neutral. The residual case rests primarily on earnings delivery rather than further multiple expansion, which is a distinction worth internalising. It means the thesis can still work, but through a different mechanism than the one that powered H1 returns.
| Pillar | H1 status | H2 outlook | Primary dependency |
|---|---|---|---|
| Earnings recovery | Intact | Needs sustained delivery at higher base | Macro stability and revenue growth |
| Relative valuation | Partially consumed | Floor, not catalyst | Earnings growth exceeding multiple compression |
| Macro momentum | Confirmed | Extended but trade-risk dependent | PMI trajectory and China demand |
| ECB policy support | Confirmed | Supportive absent inflation shock | Bond yield stability |
| Underownership / rotation | Partially realised | Scope for further normalisation | Global allocation shifts |
An overweight on Eurozone equities with global investors still structurally underexposed tells you that the positioning tailwind has not fully unwound. Mechanical inflows from allocation normalisation alone could sustain returns even if macro conditions remain only stable rather than actively improving. That is the case for maintaining exposure, even after H1 delivered as much as it did.
The broader lesson from scoring this call is structural: multi-factor convergence theses work because they have more than one mechanism to deliver returns. When one mechanism (valuation re-rating) partially exhausts itself, others (earnings growth, positioning normalisation) can carry the thesis forward. That framework applies well beyond European equities, and it is the most useful thing investors can take from this exercise.
For readers wanting to apply the business cycle framework behind JPMorgan’s sector calls more systematically, our dedicated guide to sector rotation strategy covers how institutional capital repositions across cycle phases, including the Relative Rotation Graph tools used to identify which sector moves are trend and which are noise.
This article is for informational purposes only and should not be considered financial advice. Investors should conduct their own research and consult with financial professionals before making investment decisions. Past performance does not guarantee future results. Financial projections are subject to market conditions and various risk factors.