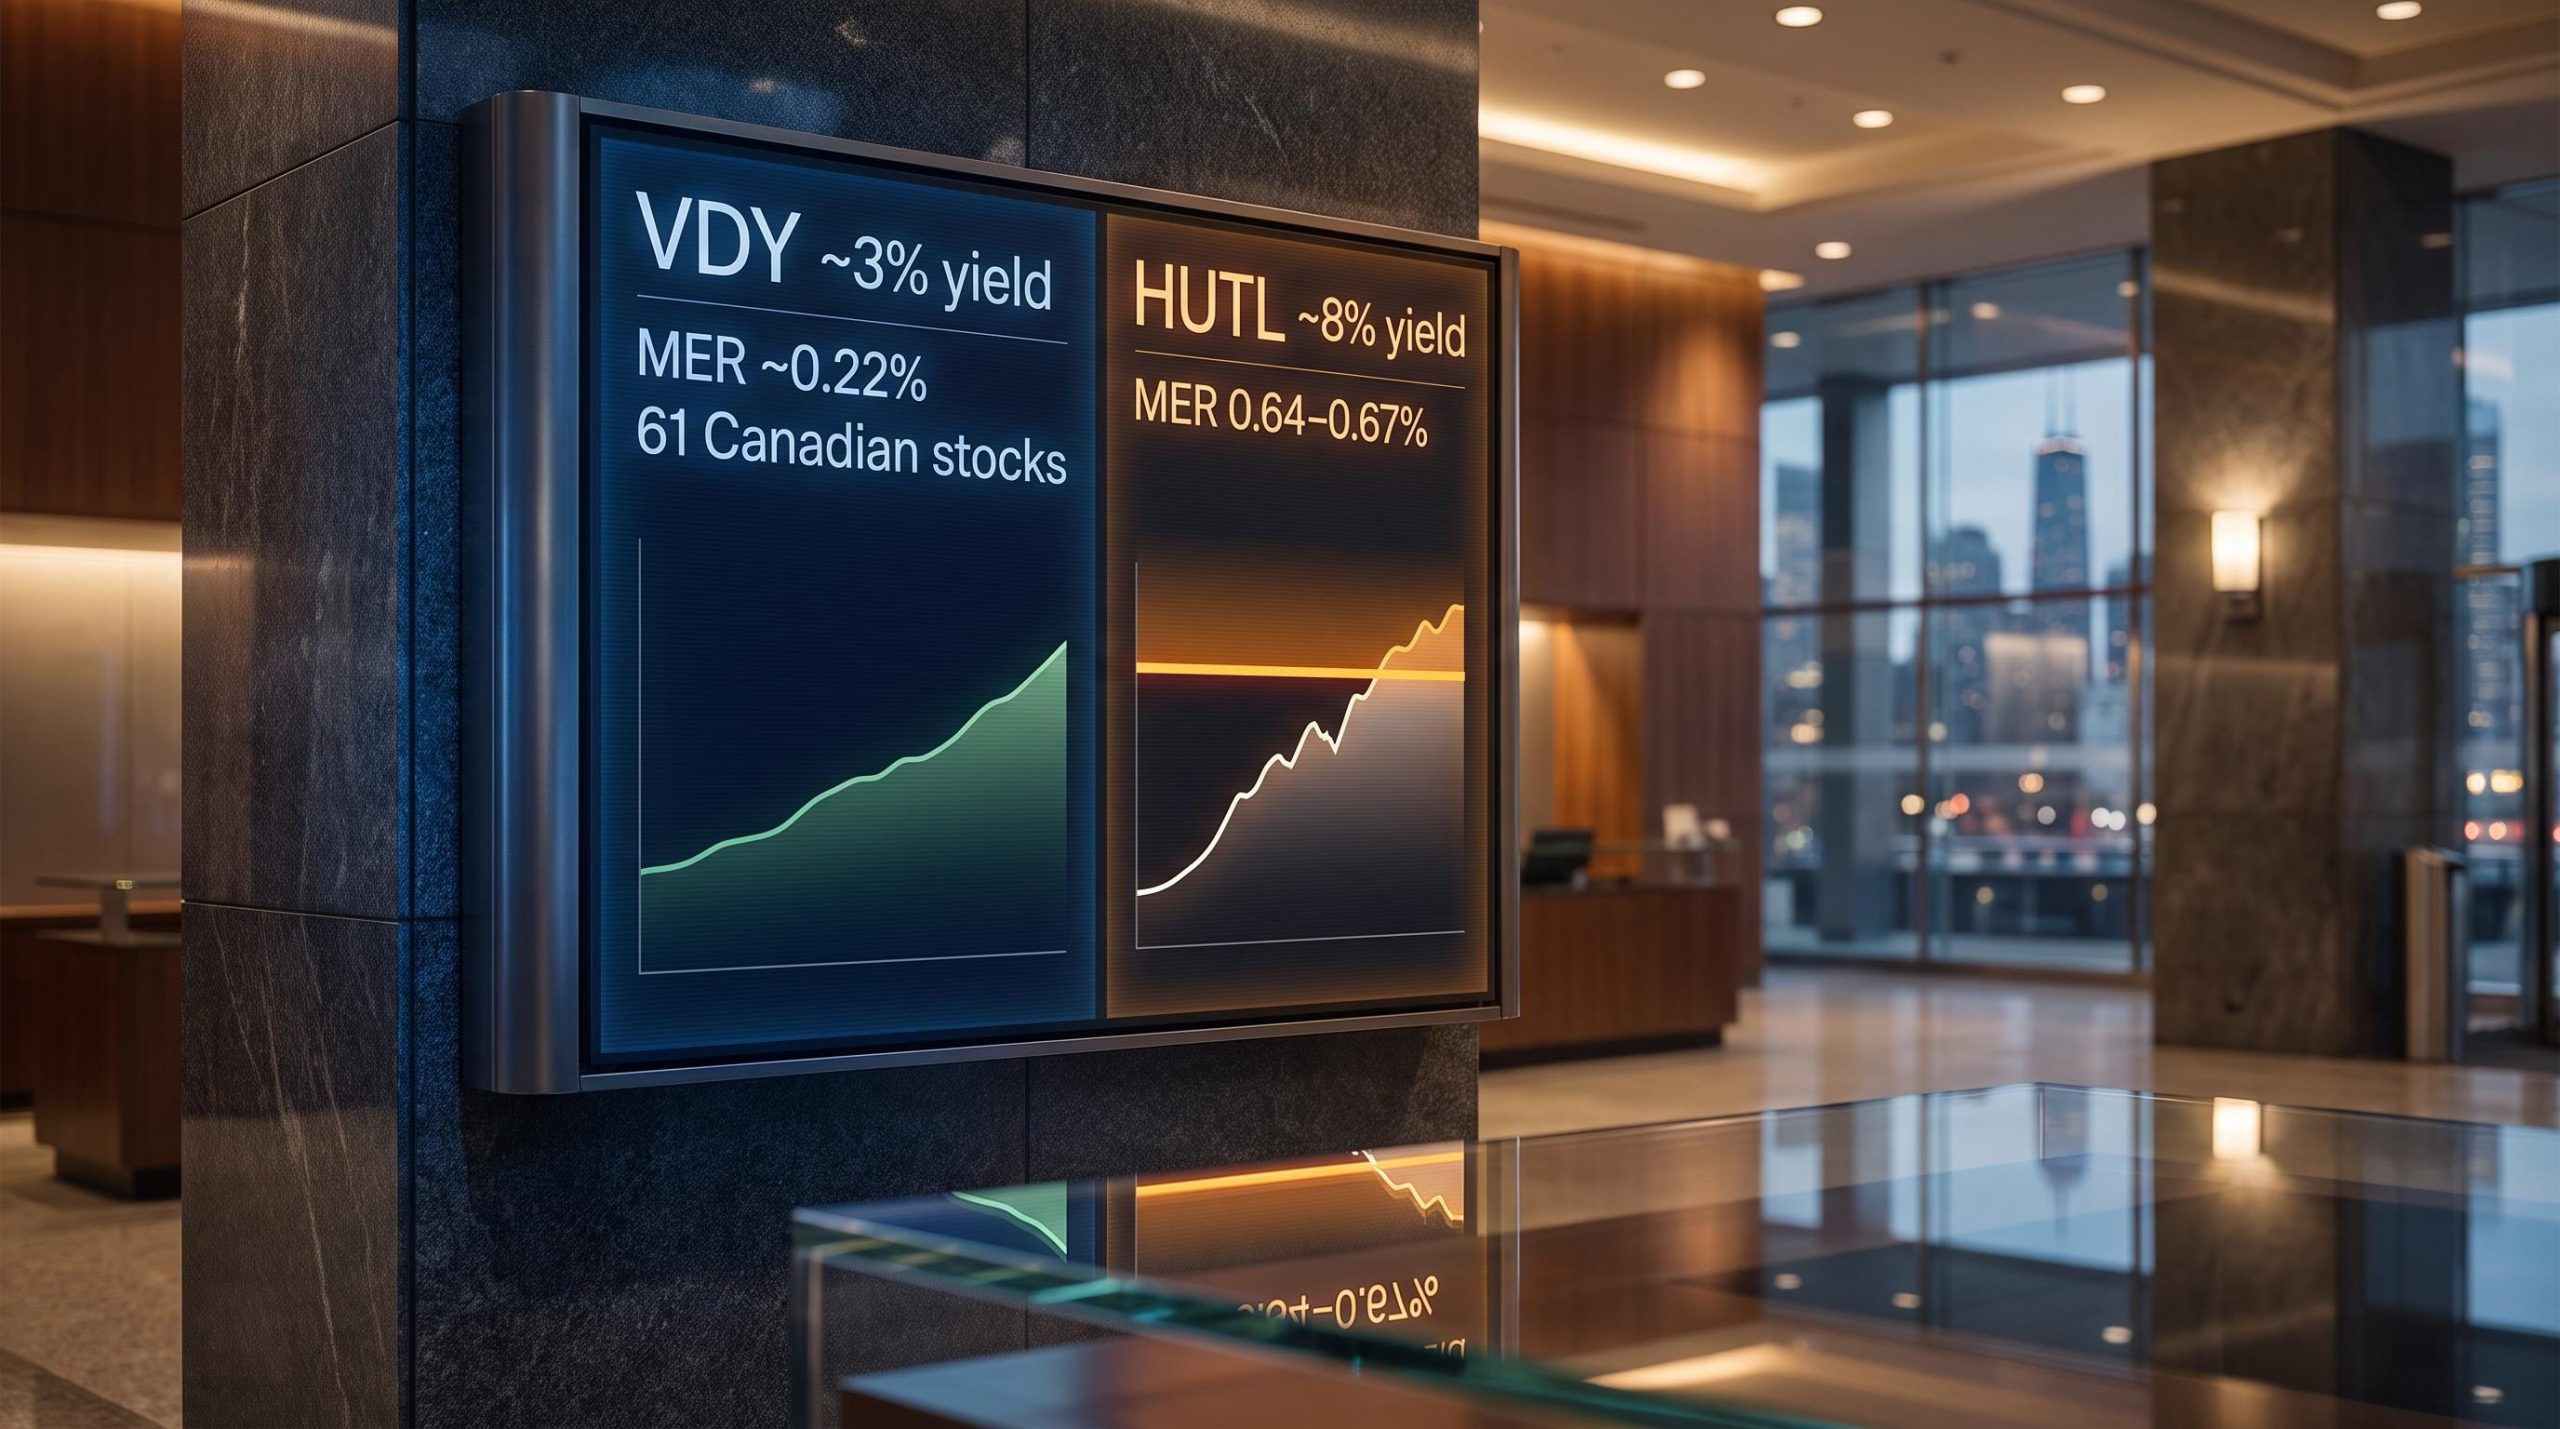
HUTL pays roughly 8%. VDY pays roughly 3%. The gap between those two numbers is not a free lunch.
Both ETFs are popular with Canadian income investors, both distribute monthly, and both show up in the same portfolio conversations. But the choice between them is not a performance contest. It is a structural question about what role you want income to play in your portfolio, and the answer depends on mechanics most headline comparisons skip entirely.
Here is how to tell which one fits your situation, based on your actual life stage, account type, and cash-flow requirements, not the bigger number on a screener.
What each ETF actually is (and why the structural gap matters)
The first thing to understand is that VDY and HUTL are not two versions of the same product. They are two different machines built for two different jobs.
Three architectural distinctions separate them:
- Management style: VDY is passive and index-tracking. HUTL is rules-based and actively managed with a CAD hedge.
- Asset exposure: VDY holds Canadian equities across financials, energy, and pipelines. HUTL holds global utilities companies across North America, the UK, and beyond.
- Income mechanism: VDY passes through corporate dividends only. HUTL layers an active covered call overlay on top of its dividend income, generating option premiums as a second income source.
Every other difference, yield level, fee level, upside participation, tax character, traces back to these three.
| Feature | VDY | HUTL | Implication for investor |
|---|---|---|---|
| Structure | Passive, index-tracking | Rules-based, actively managed, CAD-hedged | HUTL carries higher complexity and higher fees |
| Holdings count | 61 Canadian stocks | 30 global utilities (equally weighted) | HUTL is more concentrated but globally diversified |
| Geographic focus | Canada | ~30% USA, 21% Canada, 16% UK, 33% other | VDY is a Canadian-sector bet; HUTL spreads globally |
| Primary sectors | Financials (>50%), energy, pipelines | Electric utilities, telecoms, oil & gas transport | VDY concentrates in Canadian banks; HUTL in global utilities |
| MER | ~0.22% | ~0.64-0.67% | HUTL costs roughly three times more to hold |
The structural distinction means you are not choosing between two versions of the same thing. You are choosing between two different income mechanisms, and confusing them leads to mismatched expectations about what each fund will do in a rising or falling market.
When big ASX news breaks, our subscribers know first
What covered calls actually do to your returns
The yield gap between these two ETFs, roughly 8% versus 3%, is the number most investors notice first. Understanding where that gap comes from is the analytical task that actually matters.
A covered call strategy works in three steps:
- The fund holds stock in its portfolio (in HUTL’s case, 30 global utilities companies).
- The fund writes call options on those holdings and collects the premium income upfront.
- If the stock rises past the option’s strike price, the fund’s upside on that position is capped. The premium is kept regardless.
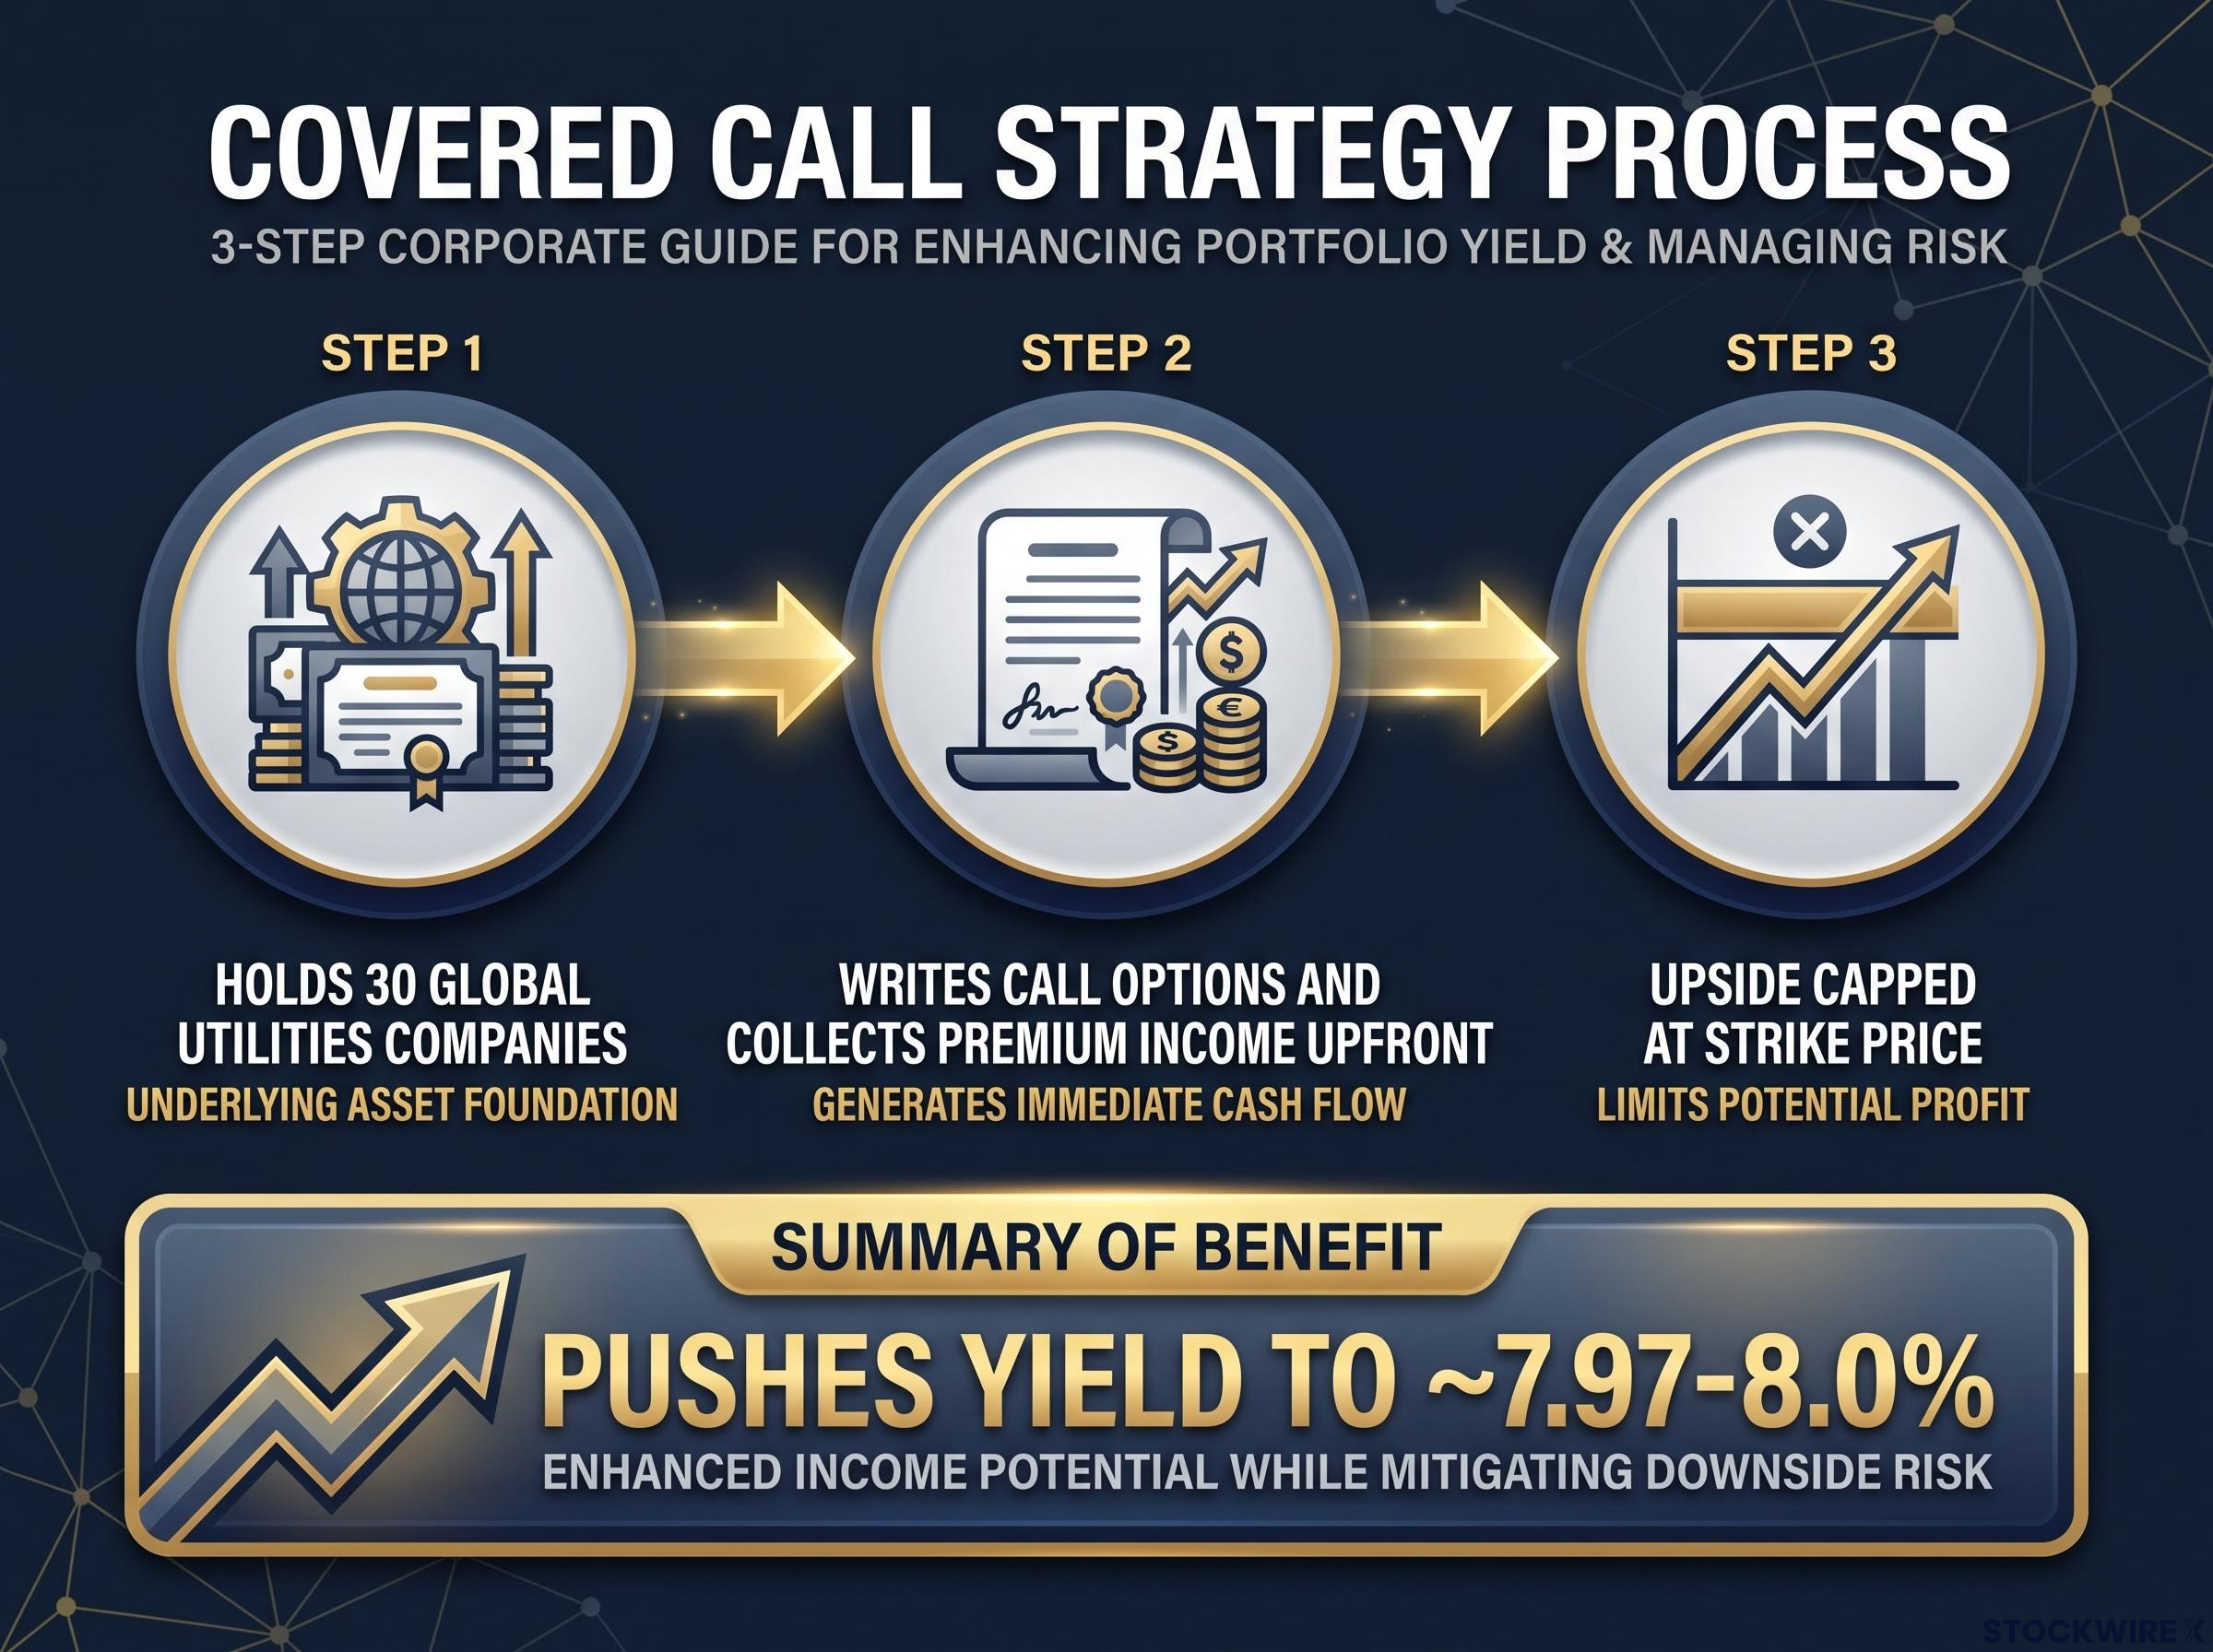
That premium income is what pushes HUTL’s yield to approximately 7.97-8.0%. It is real income. But it comes with a specific cost: in flat or declining markets, the premium cushions your returns. In strong bull markets, the fund may not fully capture the price appreciation because positions can be called away at the strike price.
The higher MER (approximately 0.64-0.67% versus 0.22%) reflects this active options management layer. You are paying for the infrastructure that generates the premium income.
Inflated headline yields at fund launch are a documented pattern in the Canadian covered call ETF space: JEPQ.TO launched at 48% and JEPI.TO at approximately 24%, both driven by mechanical annualisation of an elevated first distribution rather than any sustainable income edge, and both normalised within months.
HUTL’s approximately 8% yield versus VDY’s approximately 3% is not evidence of superior generosity. It is the structural cost of capped upside.
What this means for you is straightforward: a higher yield from HUTL is not evidence of superior management. It is compensation for accepting a ceiling on gains in exchange for elevated current income. If you do not understand the ceiling, you are making an incomplete assessment of what the yield is worth.
The tax layer most investors skip
Nominal yield and after-tax yield can diverge meaningfully, and the divergence depends on two variables: what type of account holds the ETF and what kind of income the fund is distributing.
VDY distributions are largely classified as eligible Canadian dividends. In a non-registered account, these qualify for the Canadian dividend tax credit, which is one of the most tax-efficient forms of investment income available to individual Canadian investors.
HUTL distributions are a mixed composition: eligible dividends, capital gains, return of capital (ROC), and potentially foreign income. The exact split varies year by year. Return of capital is not taxable in the year you receive it, but it reduces your adjusted cost base, which is the purchase price used to calculate capital gains when you eventually sell. That creates a deferred tax liability on disposition. Investors should review their T3 slips annually to understand how much of HUTL’s headline yield was taxable and in what form.
Covered call ETF tax treatment in Canada splits a single distribution into up to five T3 categories, each taxed at a different rate; two funds with identical headline yields can deliver materially different after-tax returns depending on the ROC and foreign income mix.
| Factor | VDY | HUTL |
|---|---|---|
| Distribution type | Largely eligible Canadian dividends | Mixed: eligible dividends, capital gains, ROC, foreign income |
| Tax treatment (non-registered) | Dividend tax credit applies | Varies by component; ROC defers tax but reduces cost base |
| Account where it matters most | Non-registered (tax credit advantage) | Non-registered (mixed income is less tax-efficient) |
In registered accounts (RRSP, TFSA, RRIF), the tax-character distinction is largely neutralised because income is sheltered regardless of its classification.
Headline yield does not equal after-tax yield. The gap between them depends on what type of account holds the ETF and what kind of income the fund is distributing.
For you as an investor holding HUTL in a non-registered account, the effective after-tax yield may be meaningfully lower than the nominal 8% headline figure. Comparing it directly to VDY’s eligible-dividend yield without adjusting for tax character is an apples-to-oranges exercise. An investor in a high marginal bracket may find VDY’s lower nominal yield delivers comparable or superior after-tax income.
Which investor profile fits which ETF
The selection question is not which ETF is better in the abstract. It is which income mechanism matches your current life stage and cash-flow requirements.
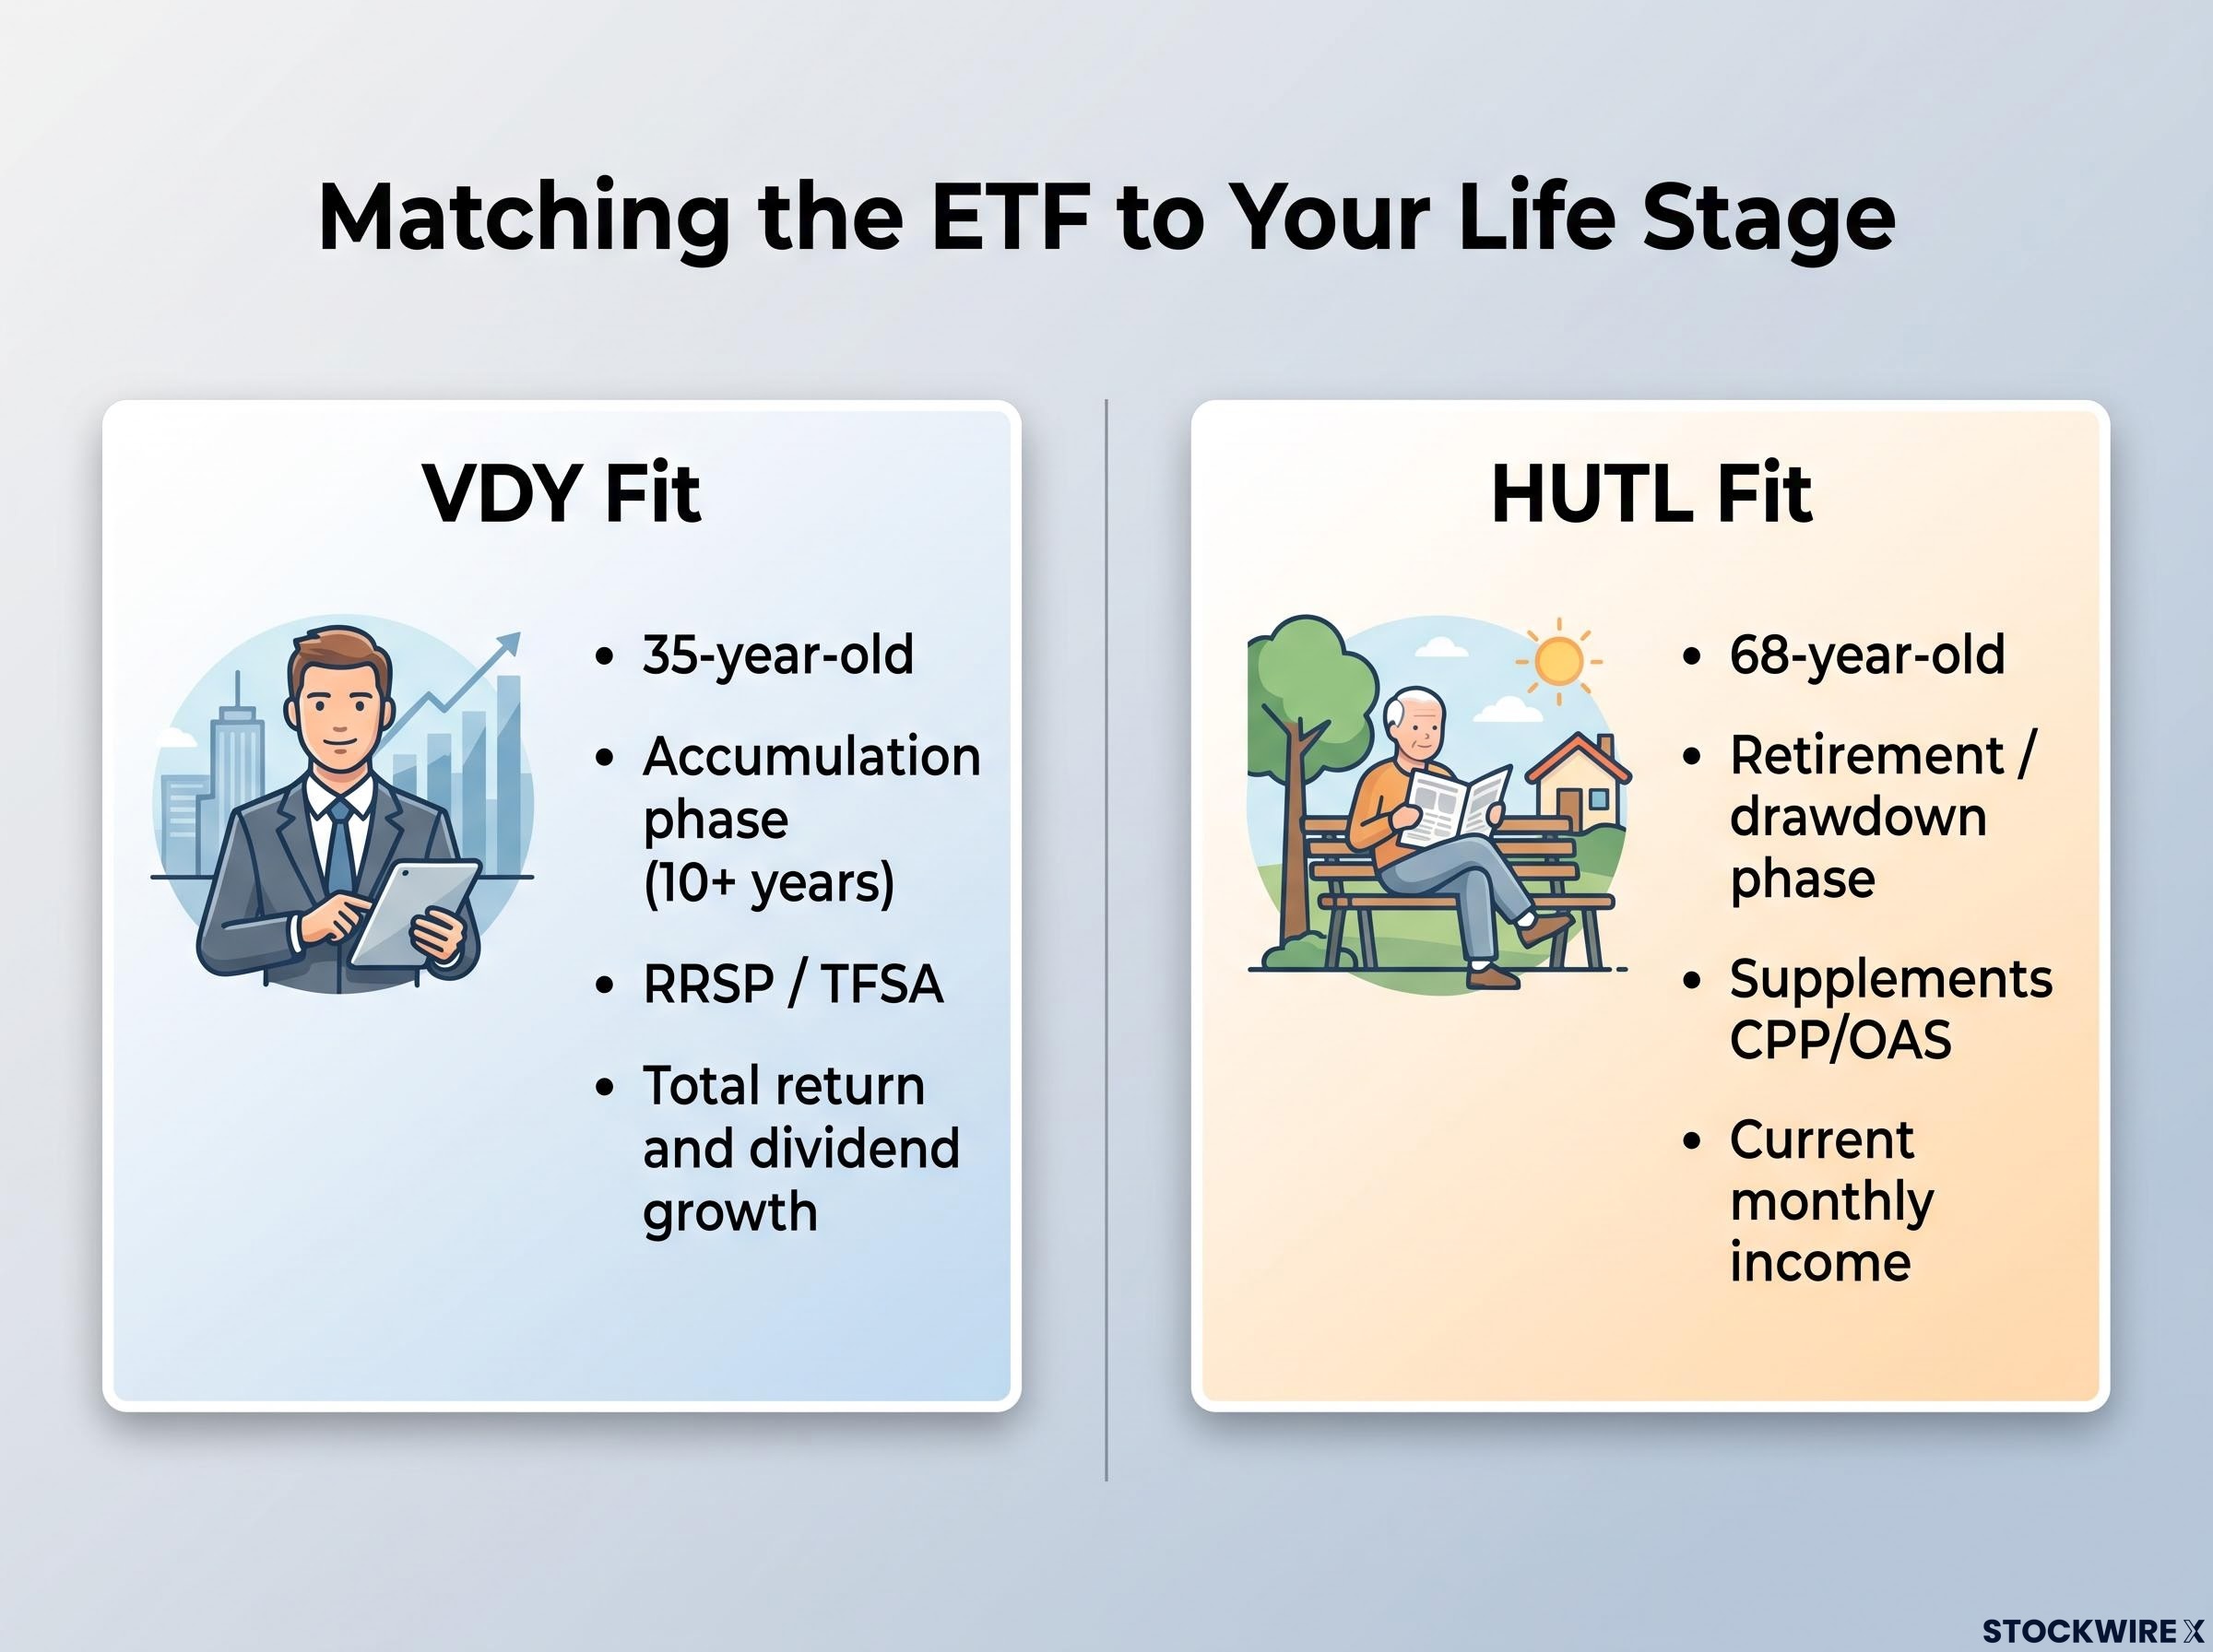
VDY fits if you:
- Have a long time horizon and are in an accumulation phase
- Hold primarily in registered accounts (RRSP, TFSA)
- Want full equity upside participation
- Prioritise low fees and passive simplicity
- Accept Canadian financial sector concentration (more than 50% in financials, with Royal Bank at approximately 14-16% and TD at approximately 10-11%)
HUTL fits if you:
- Are retired or approaching retirement with a current income need
- Hold in a non-registered account and need monthly cash flow
- Want to supplement CPP/OAS payments with predictable distributions
- Accept capped upside in exchange for higher monthly income
- Are comfortable with options complexity and active management
A 35-year-old building wealth and a 68-year-old drawing income can both be right about their ETF choice simultaneously. The criteria are different because the situations are different.
The case for holding both
Holding both ETFs in the same portfolio is a legitimate approach, but only when each occupies a distinct and deliberate position in your overall structure. One way to frame it: HUTL generates the monthly distributions, and those distributions are then channelled into a lower-cost, full-upside vehicle such as VDY or a broad index fund. The elevated income from HUTL does the near-term work; the reinvestment target does the long-term compounding. For this to function as intended, HUTL needs to be treated as a focused income sleeve rather than a foundational holding, since over-weighting a capped-upside structure limits the portfolio’s ability to participate in sustained market advances. Before committing capital to either fund, you should be able to state plainly what job each ETF is being hired to do.
A core-satellite structure formalises the ‘hold both’ approach the article describes: low-cost, full-upside ETFs occupy the core at 60-80% of the portfolio, while covered call ETFs like HUTL function as satellites generating current income without capping the portfolio’s long-run compounding engine.
The five variables that should drive your decision
Five selection variables, taken together, point toward a portfolio fit. None is decisive in isolation.
| Decision variable | Points toward VDY | Points toward HUTL |
|---|---|---|
| Primary objective | Total return and dividend growth | Current monthly income |
| Time horizon | Long accumulation phase (10+ years) | Shorter horizon or income-drawdown phase |
| Account type | Registered (RRSP, TFSA) or non-registered (dividend tax credit advantage) | Registered (tax character neutralised) or income-focused non-registered |
| Concentration comfort | Comfortable with Canadian financial sector dominance | Prefer global utilities diversification |
| Fee sensitivity | Low-fee priority (~0.22% MER) | Willing to pay ~0.64-0.67% for income overlay |
The comparison is not a permanent verdict. The appropriate ETF choice at 40 may differ from the appropriate choice at 65 as your objectives shift. The framework above is a tool for that ongoing reassessment, not a one-time answer.
At three times the MER, HUTL’s fee drag is not trivial over a decade-long holding period, and the yield premium must more than compensate for it after tax and after capped upside.
For most investors, the fee differential alone does not decide the question. But it compounds meaningfully over long holding periods. If you choose HUTL for the yield without pricing in the fee drag and the upside ceiling, you are making an incomplete calculation.
NAV erosion is the silent counterweight to elevated distributions: a fund that pays 8% while gradually declining in unit price can produce a total return materially below what a lower-yielding, price-appreciating fund delivers over the same period, a dynamic that fee drag compounds further.
Matching the ETF to the moment in your investment life
The yield gap between VDY and HUTL is a structural tradeoff, not a performance verdict. VDY fits the building phase: lower cost, full upside, tax-efficient dividends compounding over decades. HUTL fits the drawdown phase: elevated monthly income, predictable cash flow, upside traded for current distributions. Both can coexist in a portfolio when the roles are clearly defined before capital is allocated.
As your objectives evolve, so should the weighting between these two instruments. The five-variable framework above is the tool for that ongoing reassessment. Use it whenever your situation changes, not just once.
This article is for informational purposes only and should not be considered financial advice. Investors should conduct their own research and consult with financial professionals before making investment decisions. Past performance does not guarantee future results.