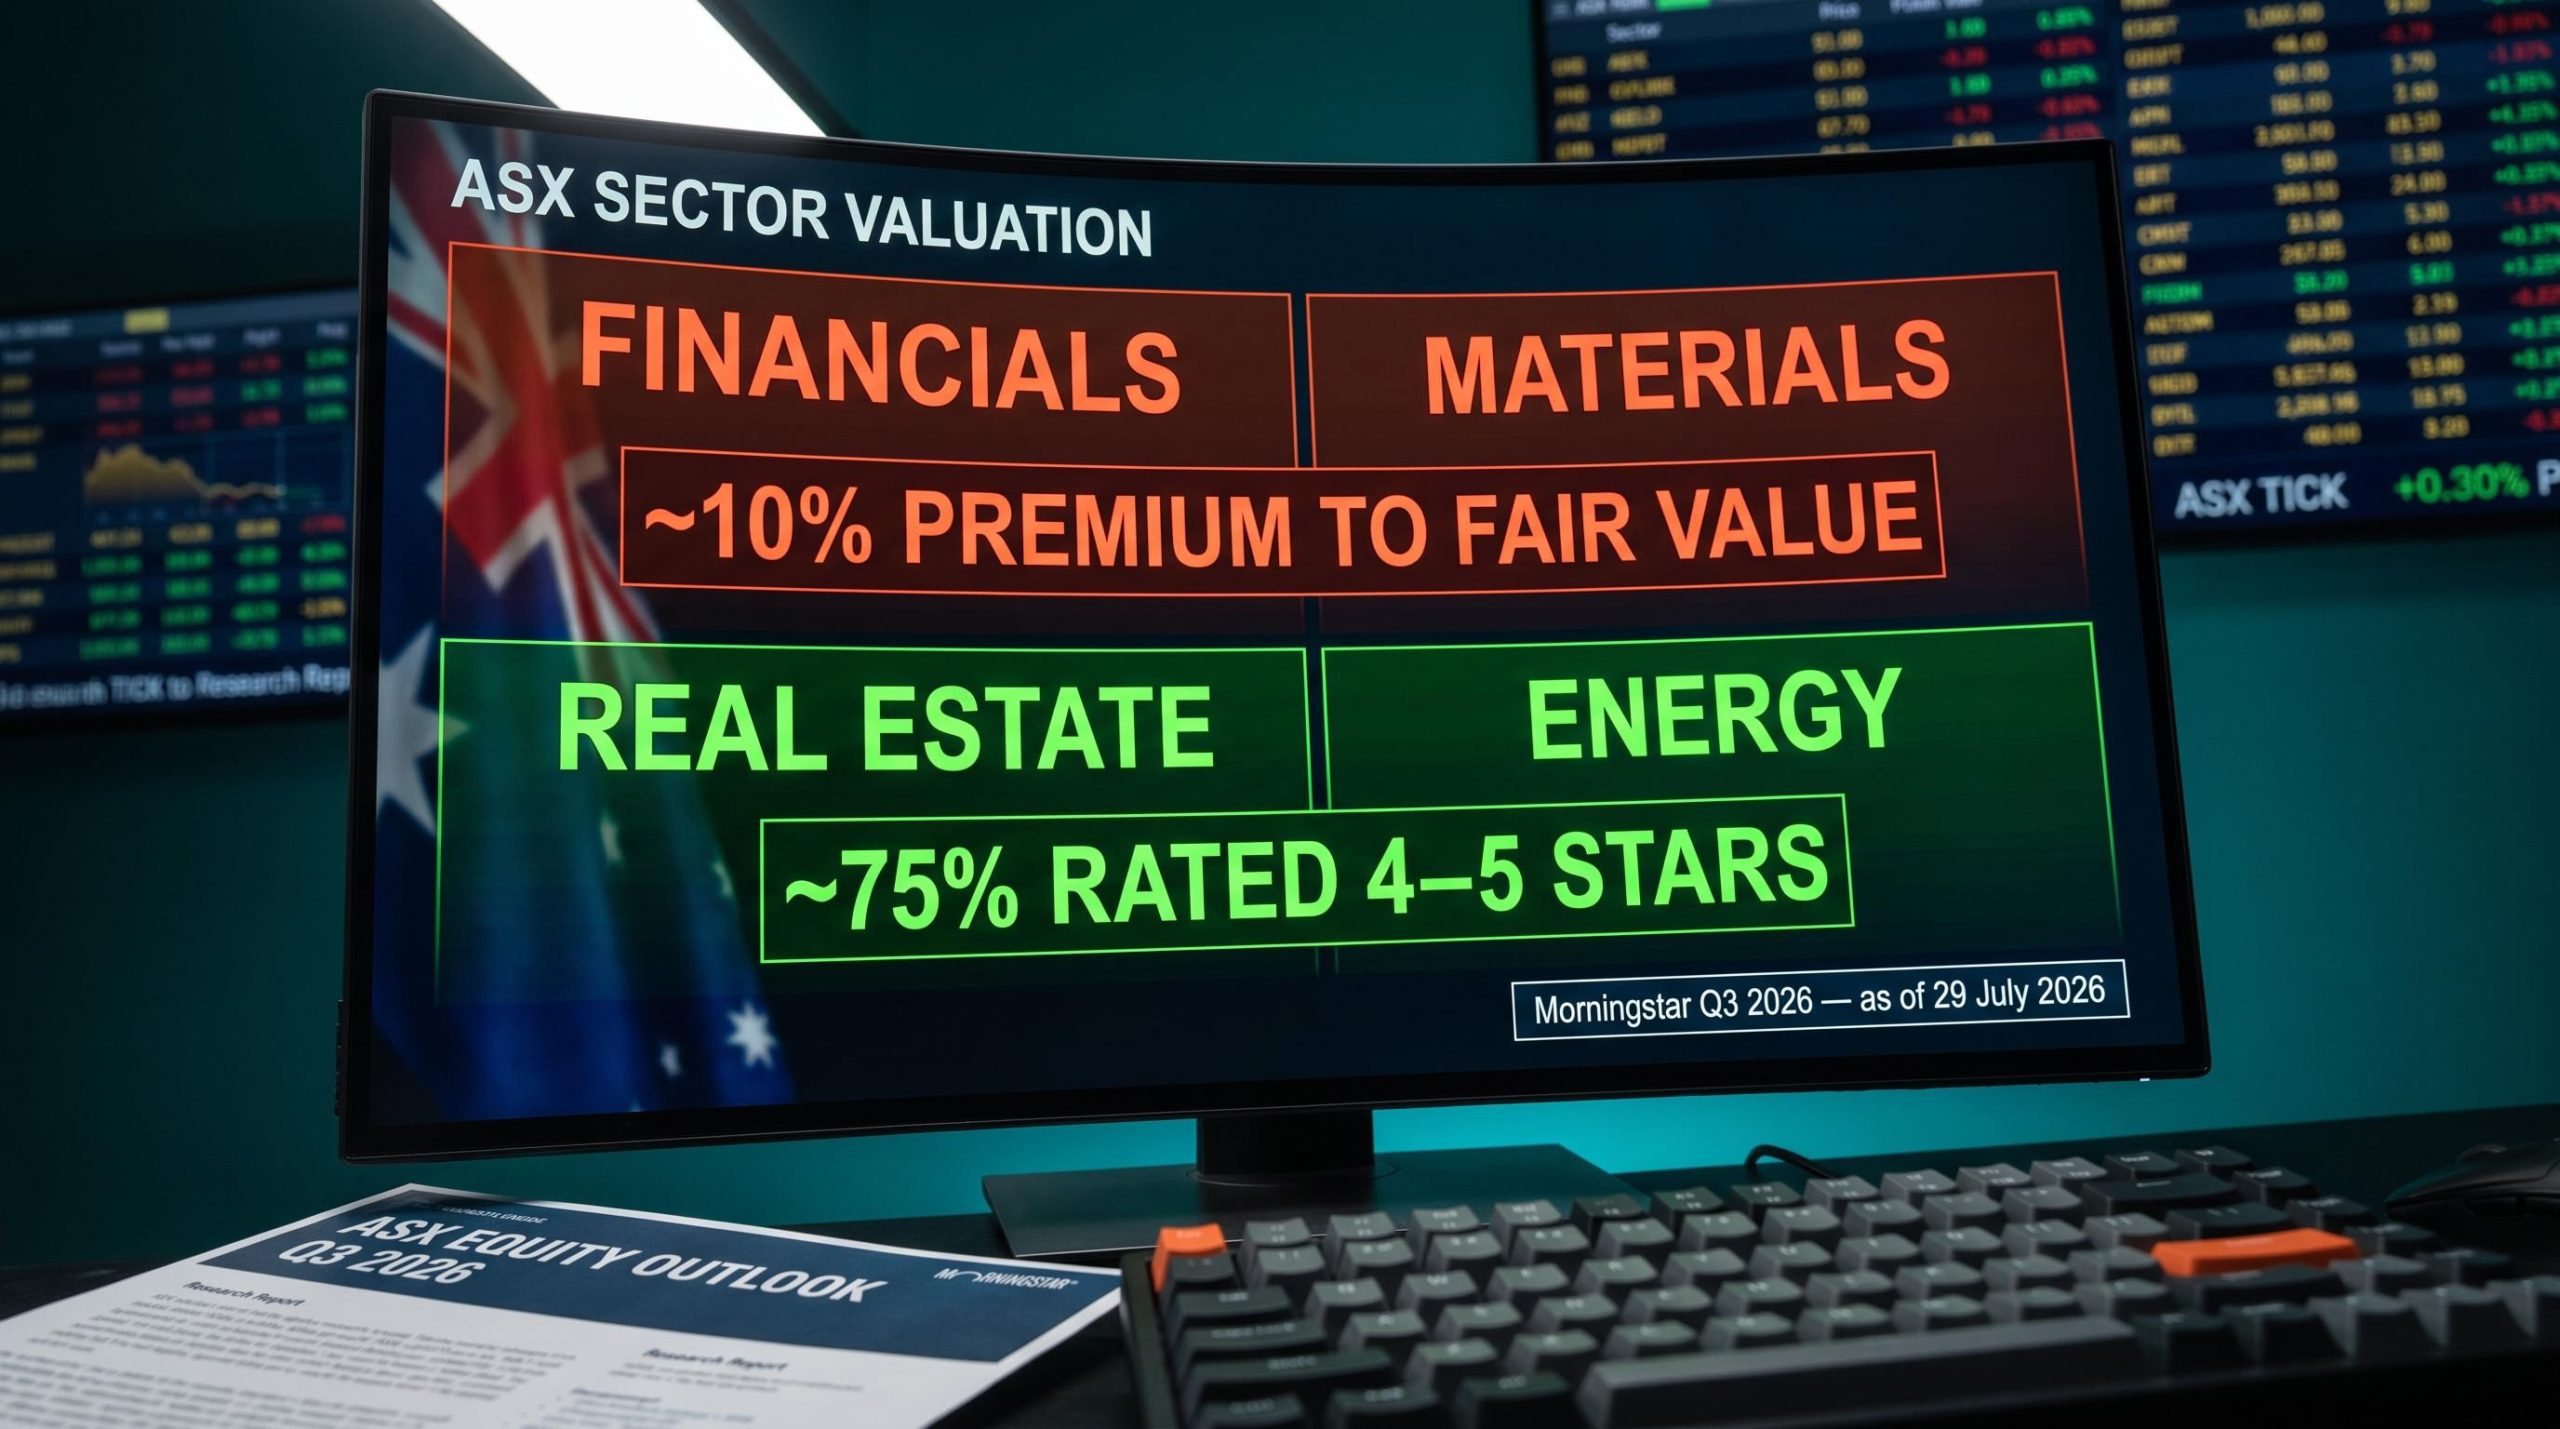
Morningstar’s Q3 2026 Australian equity outlook, published two days ago, contains a finding most ASX investors will not read past the headline: the index looks expensive, but that verdict applies almost entirely to the stocks sitting at the top.
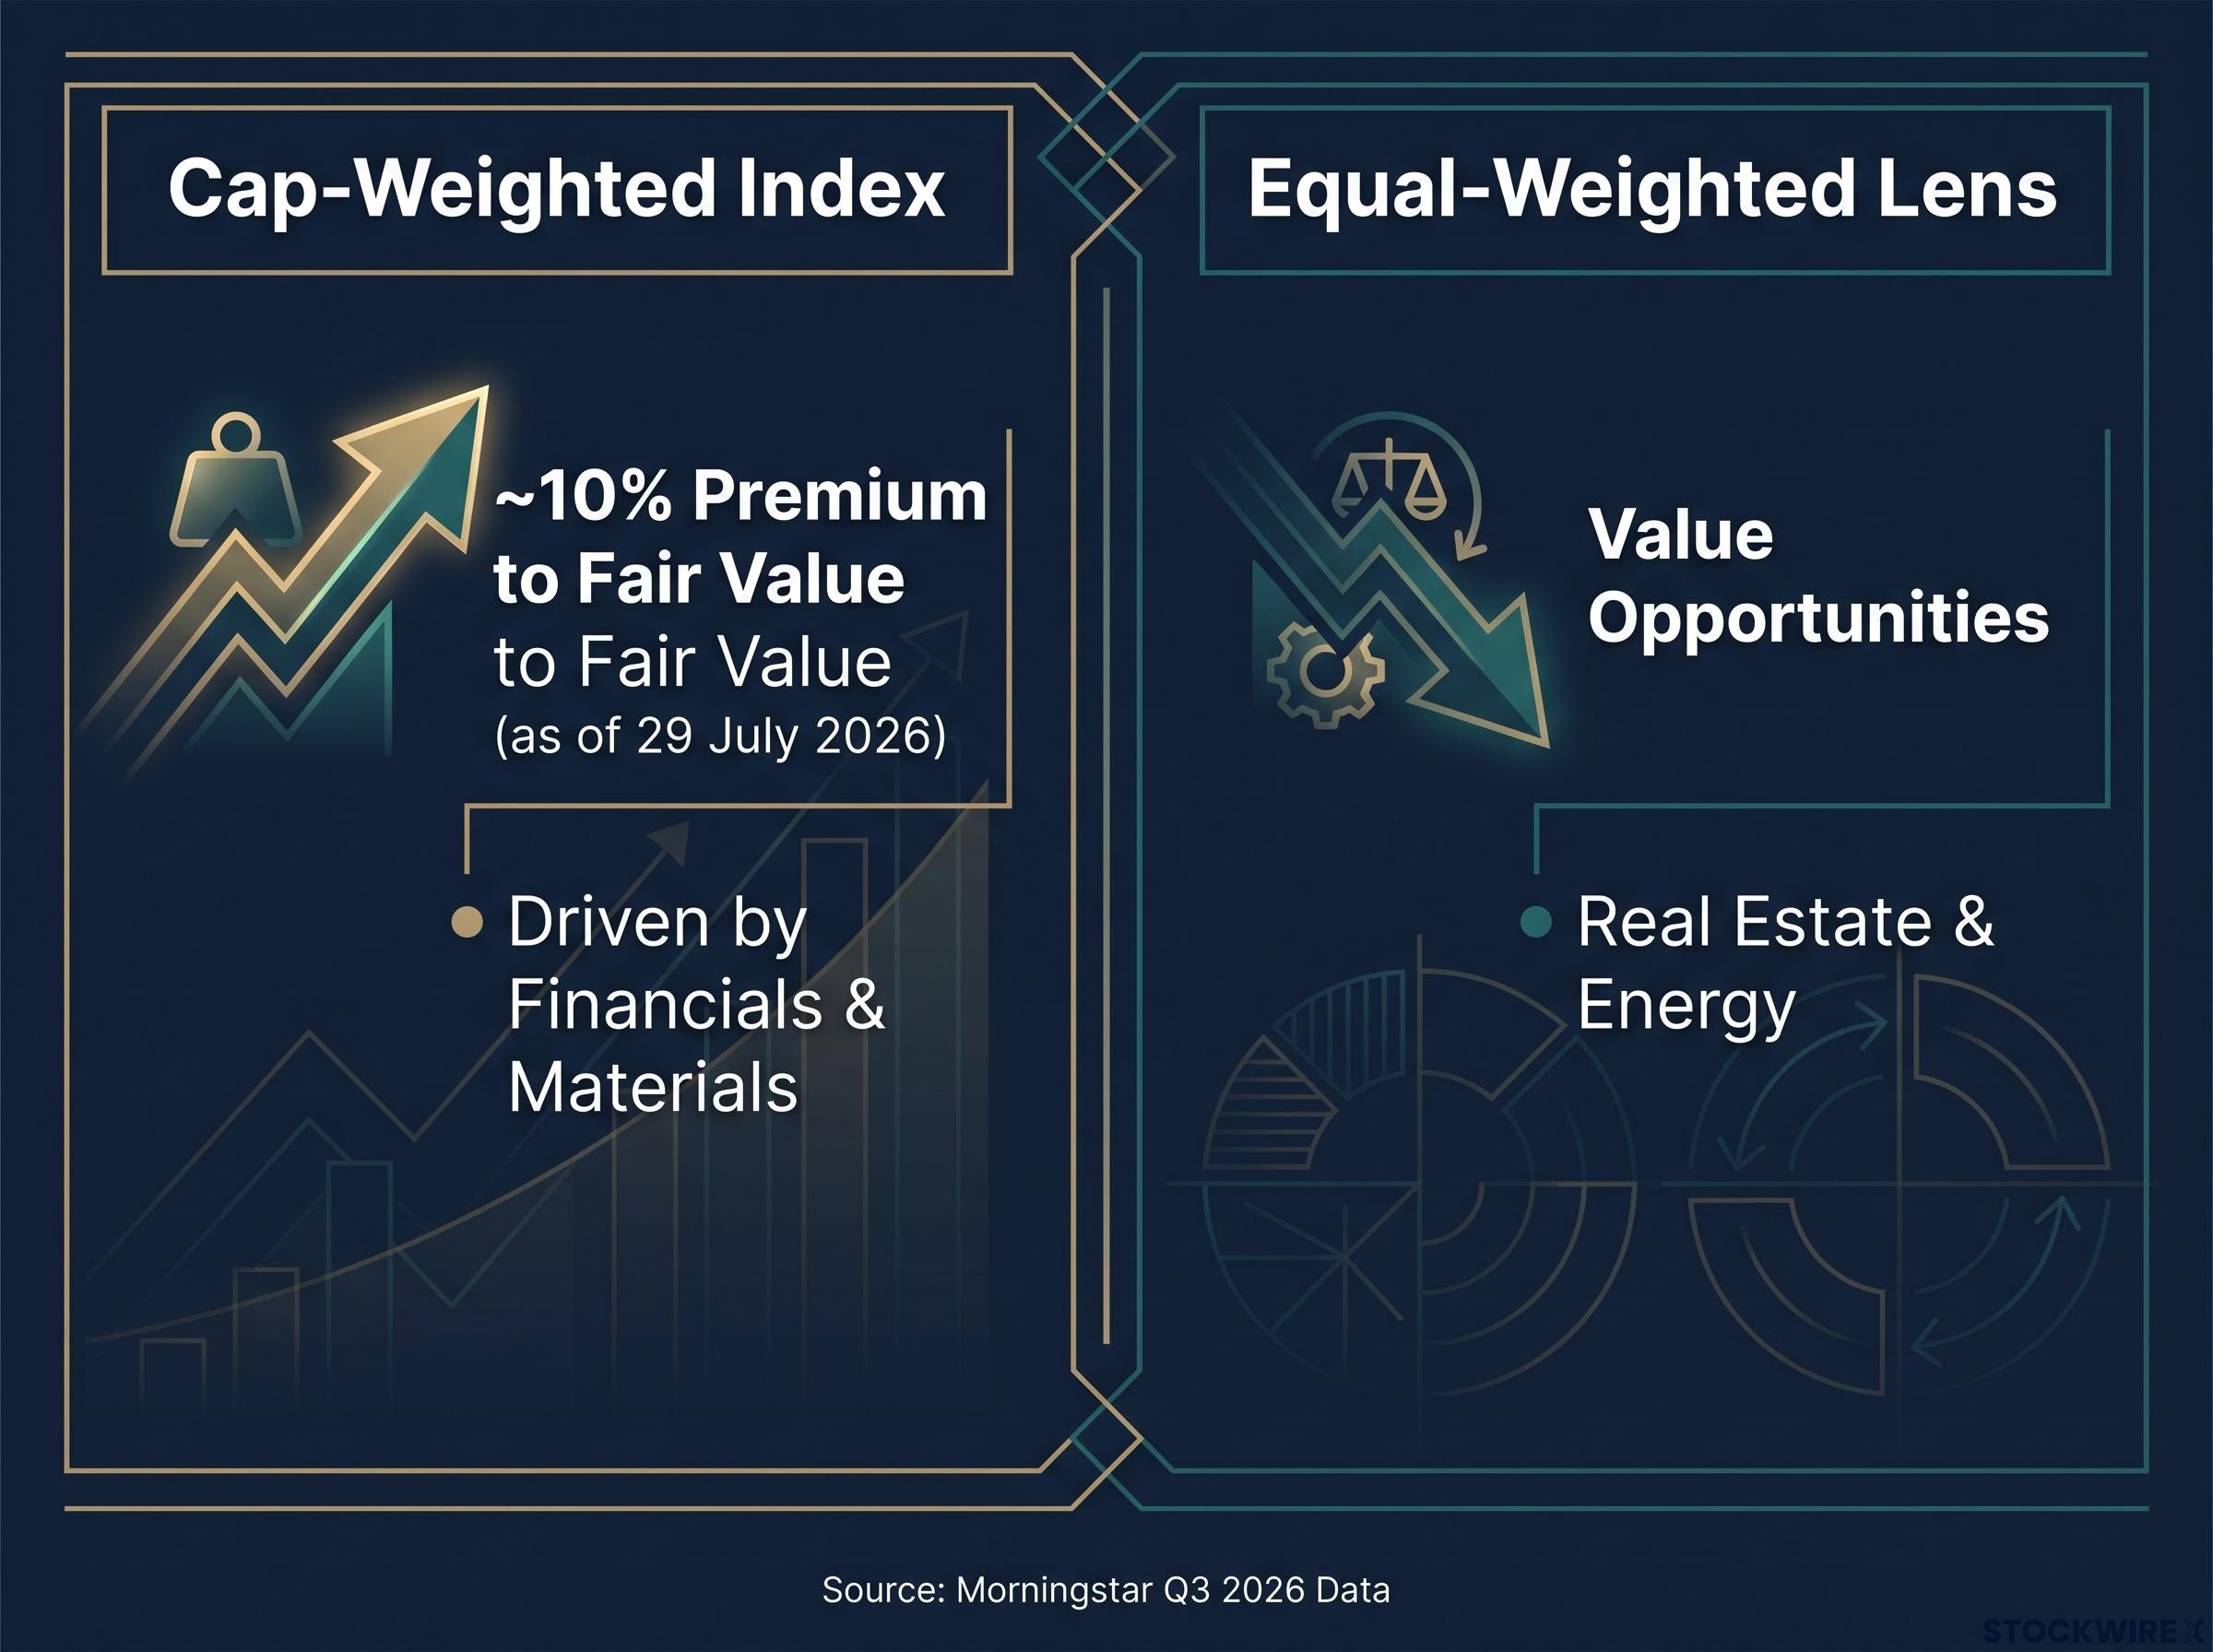
When analysts price the ASX using market-cap weights, the largest names, major banks, BHP, large dividend payers, dominate the aggregate reading. The result is a valuation figure that is accurate for the top of the market and nearly irrelevant for everything below it. Morningstar’s data, current as of 29 July 2026, shows the cap-weighted index trading at roughly a 10% premium to fair value. Switch to an equal-weighted lens and a materially different picture emerges: real estate, energy, and selected healthcare and consumer names are trading at or below estimated fair value.
Here is what that data actually tells you about where undervalued ASX stocks are sitting right now, which sectors hold the most concentrated opportunity, and what quality filter you would need to apply before acting on any of it.
Why the ASX looks expensive when it may not be
A market-cap-weighted index like the S&P/ASX 200 gives progressively more weight to companies as they grow larger. By design, the top 10-20 names dominate the index’s behaviour and its aggregate valuation. When analysts calculate a single fair value figure using cap weights, they are effectively asking how expensive the biggest stocks are, not how expensive the median ASX company is.
The structural gap between cap-weighted and equal-weighted ETFs is what makes the headline ASX valuation figure misleading for most retail investors; the top 10 ASX 200 companies account for nearly half the index, so a single aggregate price-to-fair-value number describes a concentrated subset rather than the broader market.
That distinction matters. According to Tyger Fitzpatrick, Associate Investment Specialist at Morningstar Australia, the ASX trades at approximately a 10% premium to Morningstar’s fair value estimates as of 29 July 2026. Independent analysis of the same underlying data suggests the premium could be higher, closer to 1.23x price-to-fair-value, though the 10% figure is the source-verified number from the original report.
The two most expensive sectors driving that premium:
- Financials, where major banks carry the heaviest index weight
- Materials, where miners have rerated sharply over the past year
The two most attractively priced:
- Real estate, where listed property has repriced with the rate cycle
- Energy, where transition uncertainty has suppressed valuations despite strong earnings
When you see a headline saying the ASX is overvalued, you are reading a verdict shaped almost entirely by the handful of largest stocks. If your portfolio is not concentrated in those names, the headline may not describe your situation at all.
When big ASX news breaks, our subscribers know first
Three structural forces keeping large-caps bid up
The distortion between the index’s headline valuation and the opportunity beneath it is not random. Three structural forces keep capital flowing disproportionately into the largest ASX names regardless of what those stocks are worth.
- Passive and ETF flows. New money into broad ASX exchange-traded funds is allocated by market capitalisation. The biggest stocks mechanically receive the largest inflows. This is a structural feature of index design, not an active investment decision.
- Superannuation liquidity constraints. Large super funds cannot deploy meaningful capital into smaller, less liquid names without moving prices against themselves. Their scale structurally anchors a preference for large-cap stocks, amplifying concentration at the index’s top end.
APRA liquidity risk guidance for superannuation establishes the governance framework that constrains how large funds can allocate capital, reinforcing why institutional scale structurally limits meaningful deployment into smaller, less liquid ASX names.
- Franking credit demand. Australia’s dividend imputation system makes fully franked dividends particularly attractive for super funds and self-managed super funds (SMSFs). This tax efficiency reinforces demand for large, fully franked dividend payers independent of their underlying valuation.
Franking credit demand is among the most distinctly Australian structural forces elevating large-cap bank valuations, because pension-phase SMSF members receive the credit as a direct ATO cash refund rather than a tax offset, creating an after-tax yield premium that persists independently of whether the underlying share price sits above or below fair value.
The franking credit effect is the most distinctly Australian mechanism at work here. It means the major banks, Telstra, and Wesfarmers attract demand that has nothing to do with whether their share prices sit above or below fair value, and everything to do with the after-tax yield they deliver to retirement savings.
These three forces tell you something useful: a significant portion of the large-cap premium is structurally maintained. The opportunity at the smaller end is unlikely to compress simply by waiting, and may persist longer than market-correction logic would suggest.
Sector by sector, where Morningstar’s fair value analysis points right now
The sector map below draws on Morningstar’s star rating methodology, current as of the Q3 2026 reporting period. Where specific percentages are cited, these refer to Morningstar’s ASX coverage universe, not the entire exchange.
| Sector | Morningstar valuation signal | Approximate share rated 4-5 stars (coverage universe) | Key driver of discount |
|---|---|---|---|
| Real estate | Most attractively priced | ~75% | Over-discounted rate sensitivity in quality REITs |
| Energy | Most attractively priced | ~75% | Transition uncertainty suppressing multiples despite strong earnings |
| Healthcare | Stock-specific undervaluation | Selective | High P/E masks DCF-based value in growth names |
| Consumer discretionary | Stock-specific undervaluation | Selective | P/E stretched versus history but individual mispricing exists |
| Financials | Among most expensive | Low | Structural demand from passive flows and franking |
| Materials | Among most expensive | Low | Strong commodity prices drove rerating from prior undervaluation |
Real estate and energy stand out. Approximately 75% of stocks in each sector carry a 4-star or 5-star rating, the most concentrated opportunity across all sectors assessed. Listed property’s undervaluation reflects markets having over-discounted medium-to-long-term cash flows in quality A-REITs (Australian real estate investment trusts, listed property vehicles that distribute rental income to shareholders). Energy names have not rerated the way miners have, with transition uncertainty suppressing valuations despite strong near-term earnings power.
Healthcare and consumer: opportunity exists but methodology matters
Healthcare trades on relatively high P/E ratios (price-to-earnings, a measure of what investors pay per dollar of current profit) versus its 20-year median, which means it does not look cheap on a simple screening tool. But a discounted cash-flow (DCF) fair value estimate, which projects a business’s future cash flows over its lifetime rather than relying on current earnings alone, can identify undervaluation that multiple screens miss. Growth prospects, competitive position, and cash-flow durability all factor in.
Consumer discretionary looks stretched on P/E versus history, but stock-specific mispricing exists at the DCF level. Both sectors are stock-picking opportunities, not blanket buys.
The quality filter: not all cheap ASX stocks are worth buying
A stock can be cheap because the market has mispriced it, or cheap because the business is structurally weak and the market knows it. The difference between those two situations is everything.
Morningstar’s economic moat ratings are designed to make that distinction. A moat is a durable competitive advantage that protects a company’s profits from competitors over time. Morningstar assigns one of three ratings:
Morningstar’s economic moat framework draws on five distinct sources of competitive advantage: intangible assets, switching costs, network effects, cost advantage, and efficient scale, with companies possessing multiple reinforcing sources considered materially more durable than those relying on a single driver.
- Wide moat: Strong, durable competitive advantages likely to persist for 20 years or more
- Narrow moat: Competitive advantages that may persist for at least 10 years
- No moat: No meaningful competitive advantage protecting the business
Approximately 30% of undervalued ASX stocks in Morningstar’s coverage universe carry either a narrow or wide moat rating. That intersection, undervalued and moat-rated, represents the highest-quality opportunity set: stocks where durable advantages support the likelihood that the market will eventually reprice them closer to fair value.
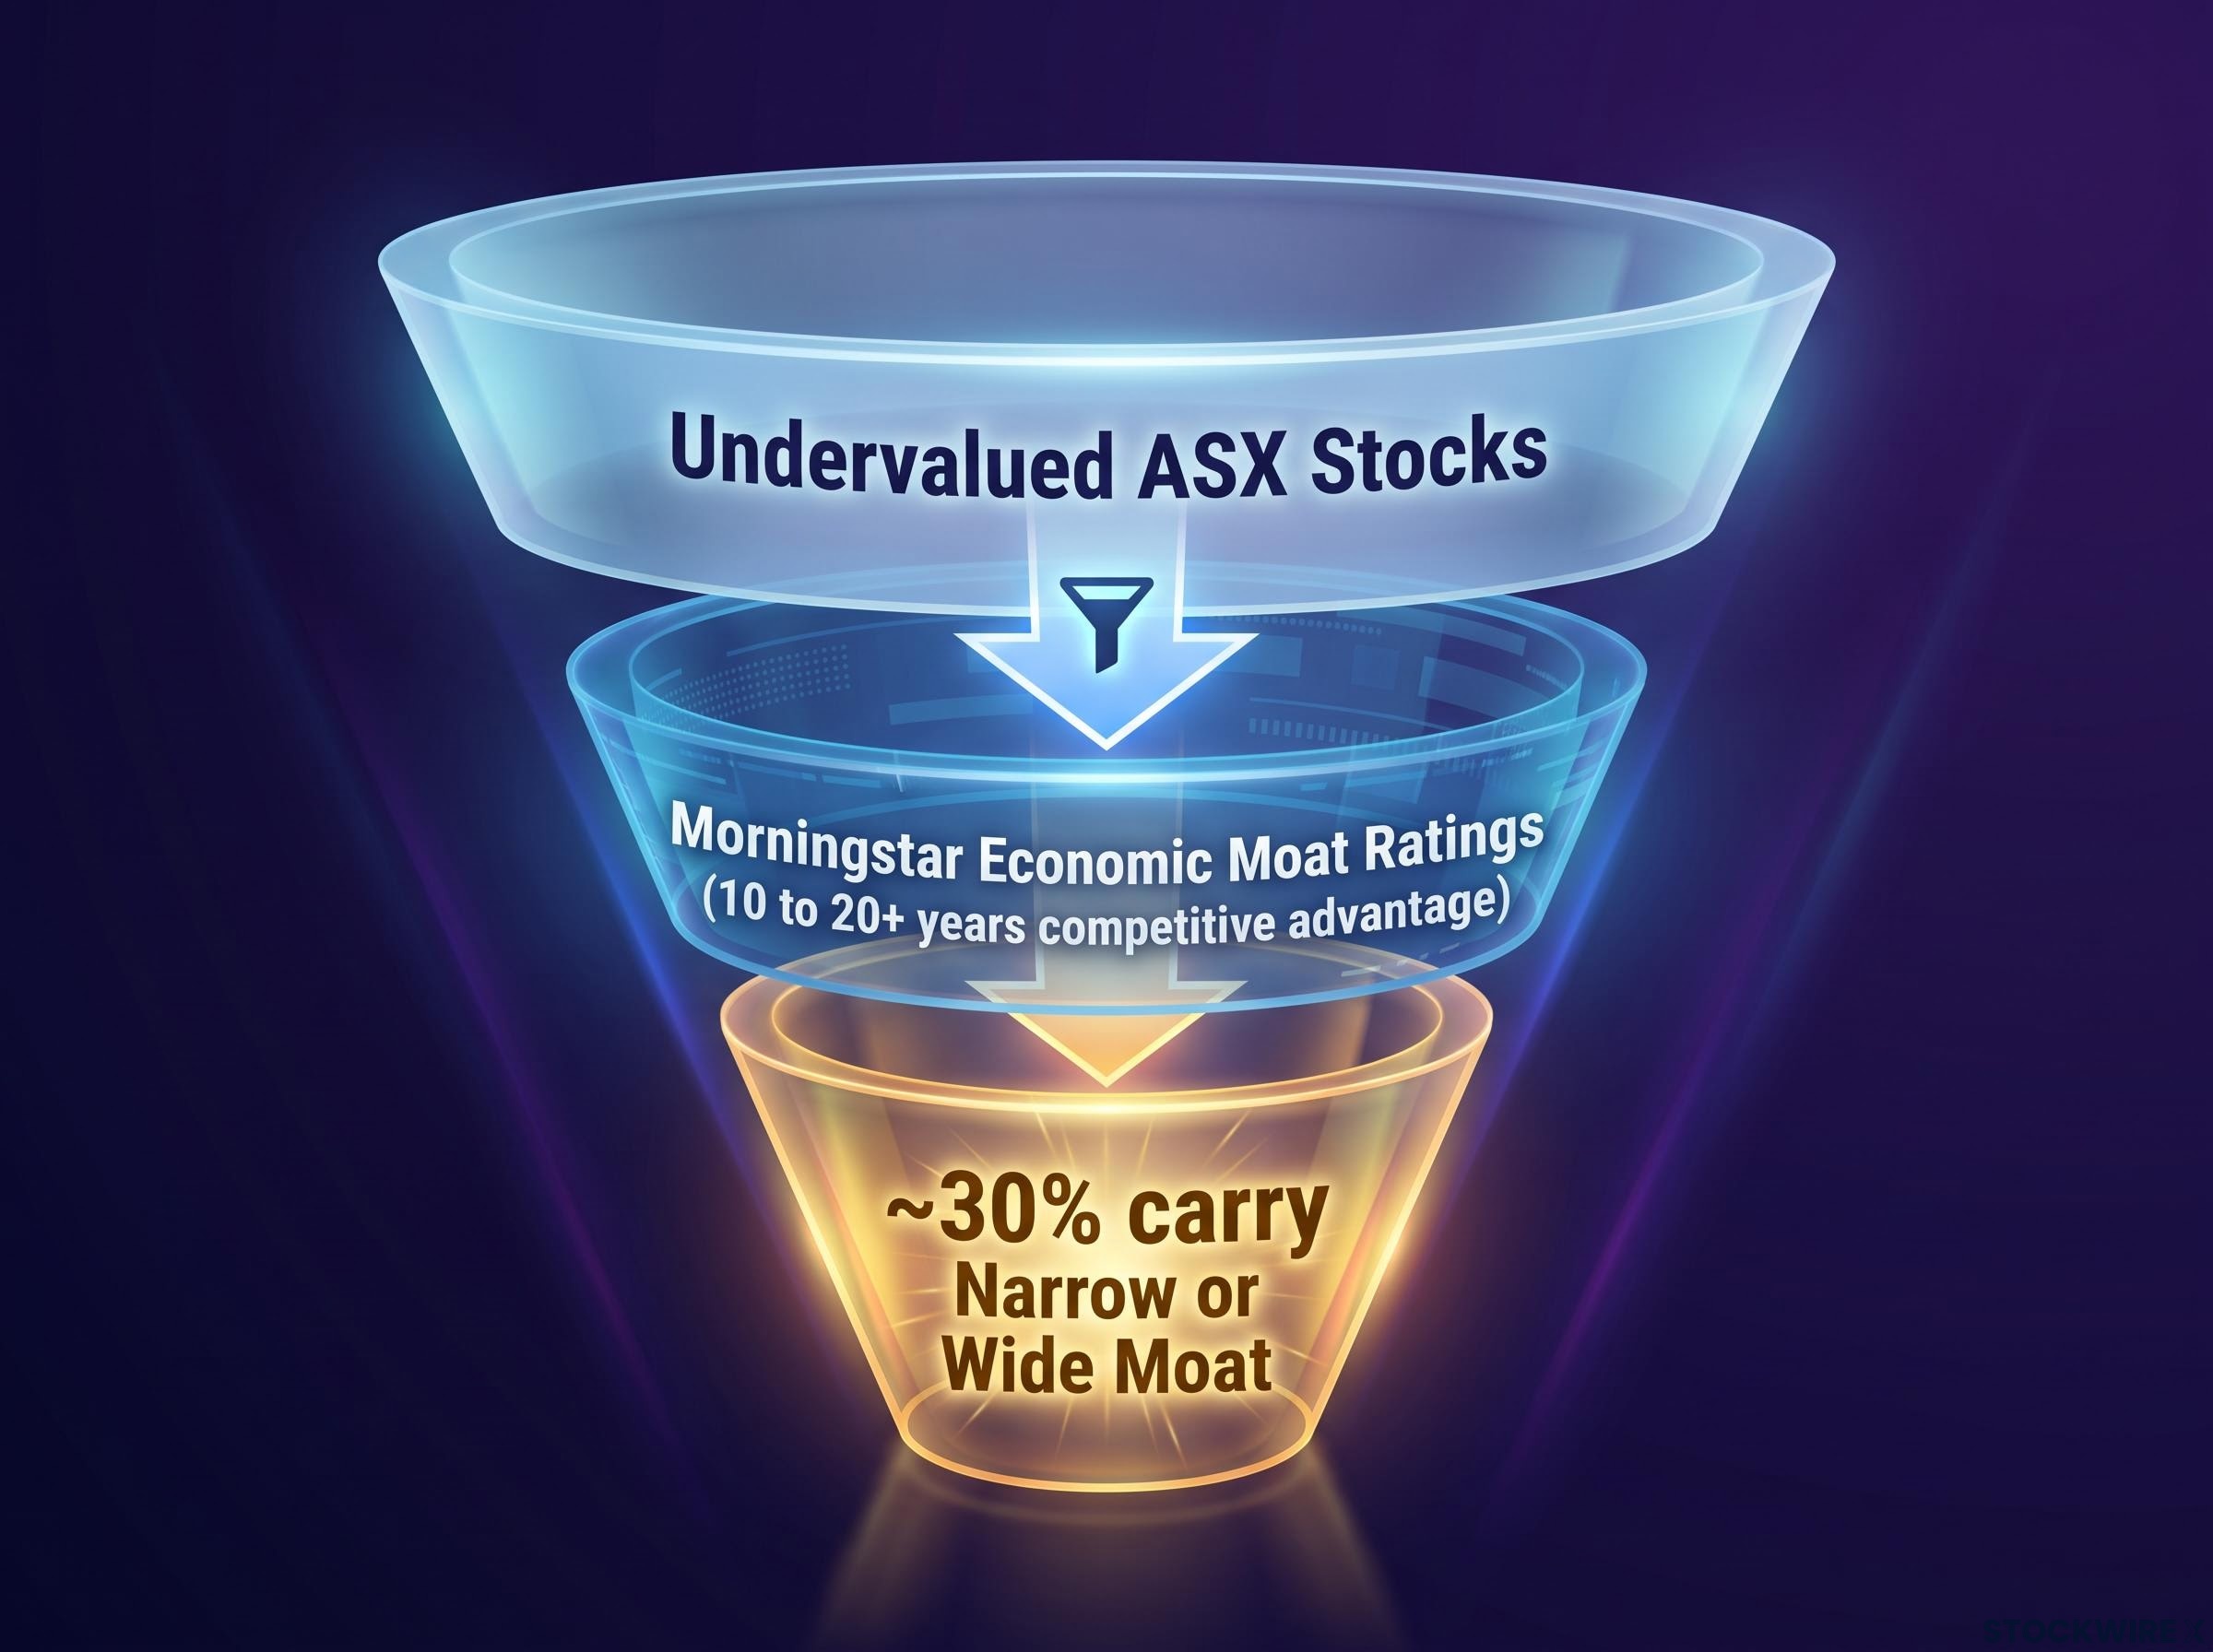
The 30% figure tells you something important. Even within a sector showing broad undervaluation, the majority of individual stocks flagged as cheap do not carry the quality characteristics that make a mispricing thesis high-conviction. Sector-level signals are a starting point, not a buy list. Stock-level moat analysis is the filter before acting.
Why mining’s recent history is the most important warning in this report
The materials sector, predominantly mining, was among the most attractively priced ASX sectors approximately twelve months before the Q3 2026 reporting period.
It is now one of the two most expensive, alongside financials.
Mining’s valuation standing has undergone a dramatic reversal over the past year, moving from among the cheapest sectors to one of the priciest on the ASX. A sustained surge in commodity prices powered that rerating. The sector’s P/E now sits at or slightly above its long-run median, with far less valuation cushion than a year ago.
That reversal carries a structural lesson. Valuation opportunities can close quickly when a sector rerates. Waiting for obvious price momentum as confirmation of value is a strategy that consistently causes investors to arrive after the opportunity has passed.
Mining’s twelve-month reversal tells you the opportunity window in real estate and energy is not permanent. An investor who waits for confirming signals may be pricing themselves out of the thesis entirely.
What this means for how you position your ASX exposure
Passive index investors
A default cap-weighted ASX 200 allocation embeds the valuation premium by design, not by choice. That awareness should shape return expectations. It may also prompt a review of whether a complementary equal-weighted or small-to-mid-cap sleeve would improve the valuation entry point of overall Australian equity exposure.
For passive index investors wanting to reduce embedded exposure to expensive financials and materials names, our full explainer on alternative ASX ETF structures covers MVW, QOZ, and EX20, each addressing a different dimension of ASX 200 concentration and available to retail investors today.
Active stock-pickers
The sector map is useful but only to the sector level. Real estate and energy offer the broadest concentration of undervaluation; healthcare and consumer discretionary require stock-level work. The materials reversal is the relevant caution: chasing momentum in already-rerated mining and financials names is unlikely to replicate the returns of the past year. Moat-based screening is the next step.
SMSF and franking-focused investors
Franking credit demand is part of what makes major banks expensive relative to fair value. Optimising purely for tax efficiency can mean paying a premium you need to earn back before generating real returns. Blending franking-rich large-caps with undervalued, moat-rated smaller names can improve overall portfolio value without abandoning imputation benefits.
Long-term superannuation members
A default cap-weighted Australian equities option embeds the premium discussed throughout this piece. The question worth asking your fund: how much of your Australian equities exposure is concentrated in sectors that Morningstar currently rates as the most expensive on the ASX? The Q3 2026 data strengthens the case for global diversification rather than heavy home-bias concentration in expensive large-cap financials and materials.
What stays relevant as the next rate cycle unfolds
The Q3 2026 Morningstar data marks a specific point in time, not a permanent condition. The opportunity in real estate and energy exists now because the market has priced in a particular rate and transition scenario, and that pricing will shift as those scenarios update. Three variables will determine whether the valuation gaps flagged in this analysis are still open or have already started to close:
- Rate expectations for REITs: A-REITs are structurally rate-sensitive; the undervaluation argument partly depends on markets having over-discounted that sensitivity. If rates remain elevated longer than expected, the discount could persist or deepen rather than reverse.
- Commodity trajectories for energy: Energy’s relative cheapness versus materials depends on the rerating that already occurred in miners not extending to energy names. A sharp commodity price move could change that relationship.
- Structural flow concentration for the large-cap premium: Passive flows, superannuation constraints, and franking demand are not going away in the near term, which means the equal-weighted opportunity at the smaller end is likely to persist as long as those flows continue.
The 75% star-rating figure in real estate and energy is the benchmark against which future repricing can be measured. When those numbers compress, the opportunity is closing.
This article is for informational purposes only and should not be considered financial advice. Investors should conduct their own research and consult with financial professionals before making investment decisions. Past performance does not guarantee future results. Financial projections are subject to market conditions and various risk factors.