Most retail investors read the same annual report a professional analyst reads, yet arrive at a completely different conclusion. The gap is rarely about information. It is about process.
A professional value investment team does not simply scan earnings figures and check a price-to-earnings (P/E) ratio. They build financial models for every company in their investable universe, interview management directly, then independently verify what they were told through conversations with competitors, suppliers, and former staff. Increasingly, they use AI to handle the heavy archival work so that human judgement can focus where it matters. Fundamental Investment Management, the bottom-up value manager led by Anton Tagliaferro and Simon Conn, exemplifies this approach in the Australian market.
Their process is not proprietary magic. It is a repeatable sequence that any investor can understand and, in scaled-down form, apply. Here is what that stock research process actually looks like, from the first financial model to the final margin-of-safety decision, and what you can take from it.
Why professional value investors build financial models before doing anything else
Imagine buying a house without knowing how much it costs to maintain. That is what investing without a financial model looks like. You see the headline earnings, the P/E ratio, maybe a dividend yield, and you assume the numbers behind them are sound. They might not be.
A financial model is not a forecast machine. It is a thinking framework that forces you to make explicit assumptions and see where those assumptions are sensitive. At Fundamental Investment Management, the team dedicates considerable time to constructing financial models across every company in their investable universe, covering not only current holdings but all candidates under consideration. The model is how they decide whether a company is worth holding in the first place.
A professional model typically includes:
- 3-10 years of historical data: revenue broken down by segment, gross and operating margins, earnings per share, debt ratios, interest coverage, working capital metrics, and capital expenditure versus depreciation
- Operating cash flow and free cash flow tracked against reported net income
- Forward scenarios at the segment level: base case, bull case, and bear case for revenue growth, margin evolution, capital expenditure needs, and resulting free cash flow
The structural link the model creates between income statement, balance sheet, and cash flow statement is where the real insight lives. Earnings quality, the degree to which reported profits are backed by actual cash generation, is revealed at those connection points.
What the model is actually testing for
The core diagnostic is straightforward: compare operating cash flow to reported net income over multiple years. When a company consistently reports strong net income while operating cash flow lags behind, something is inflating those earnings. It might be favourable accruals. It might be working capital release.
Growing receivables or inventory relative to revenue is a warning sign the model makes visible. If a retailer reports rising sales but its inventory is growing faster, the model forces you to ask whether those sales are sustainable or whether the company is simply building stock it cannot shift.
Without a model, you cannot make that distinction. You see a flattering P/E ratio and assume it reflects genuine value. The model shows you whether the cash generation underneath supports that assumption, or contradicts it.
When big ASX news breaks, our subscribers know first
The business and management assessment that comes before valuation
Company disclosures are written to persuade. Annual reports are marketing documents with financial data attached. This does not mean management is lying, but it does mean the information you receive is curated, framed, and presented in the most favourable light permissible under disclosure rules. Professionals know this. Their process accounts for it.
Fundamental Investment Management invests significant time engaging directly with company leadership, evaluating the capability of management teams and gaining clarity on their plans for creating shareholder value over the medium to long term, whether through organic growth or acquisitions. They assess management through earnings calls, investor days, shareholder letters, and direct meetings, looking specifically at capital allocation track record, disclosure quality, and consistency of language around risks over time.
Management quality assessment goes beyond earnings call tone: tracking earnings per share, book value per share, and intrinsic value per share over multiple years gives you a verifiable, behaviour-based record of how a team actually allocates capital, which is more reliable than any investor presentation.
Then comes the layer most retail investors cannot easily replicate: third-party verification. Beyond what management communicates to investors, the firm actively gathers independent perspectives from competitors, suppliers, former employees, and customers to determine whether the company’s narrative is borne out in the broader market. The goal is to test whether what management says matches what the market actually experiences.
If a company’s management consistently frames competitive threats as manageable while competitors describe the same market conditions as intensifying, that divergence is a signal worth investigating before any price looks cheap.
You cannot run a full channel-check programme from your desk. But you can approximate it.
| Professional verification source | Retail investor equivalent |
|---|---|
| Direct competitor meetings | Competitor ASX annual reports and earnings call transcripts |
| Supplier and customer interviews | Public customer reviews, industry forums, trade publications |
| Former employee conversations | Glassdoor reviews and LinkedIn commentary |
| Industry expert network calls | Industry association reports and specialist media |
The point is not to replicate the institutional version perfectly. The point is to never take management’s word as the only input into your assessment. Even one competitor’s annual report can reveal whether the market conditions your target company described are consistent with what others in the same industry are experiencing.
The valuation toolkit: how professionals triangulate intrinsic value
You probably already know the P/E ratio. It is the metric most retail investors start with, and many stop there. Professionals treat it as a starting point, not a conclusion. The conviction that a stock is genuinely undervalued comes from multiple methods arriving at a similar range.
Fundamental Investment Management uses three primary valuation approaches:
- Discounted cash flow (DCF): Forecast free cash flow for 5-10 years, add a terminal value representing what the business is worth beyond the forecast period, and discount everything back to today at a risk-appropriate rate. DCF is powerful but highly sensitive to your assumptions about growth rates and discount rates. Professionals treat the output as a range of outcomes, not a precise number.
The terminal value assumption in a DCF model typically drives 60-80% of the total implied value, which means intrinsic value estimation is far more sensitive to your long-run growth assumptions than to the near-term revenue forecasts most retail investors spend the most time refining.
- Relative valuation: Compare the company’s P/E, enterprise value to earnings before interest, taxes, depreciation, and amortisation (EV/EBITDA), price-to-free-cash-flow, and price-to-book against both its sector peers and its own five-year history. A stock trading at a discount to its historical average may be cheap, or the business may have deteriorated. The model from Stage 1 helps you distinguish between the two.
- Sum-of-the-parts (SOTP) and net tangible assets (NTA): For conglomerates or businesses with distinct divisions, value each segment separately and add them up. For asset-backed businesses, compare market price to NTA or book value. This approach catches complexity discounts where a good business is buried inside a mediocre parent.
Margin of safety: the non-negotiable risk control. Professionals buy only when the market price sits at a meaningful discount to their conservative intrinsic value estimate. This buffer protects against forecast error, unforeseen shocks, and the simple reality that your assumptions will never be perfectly right. Fundamental Investment Management only commits to a position when the current share price is judged to be below what the business is genuinely worth. No margin of safety, no purchase.
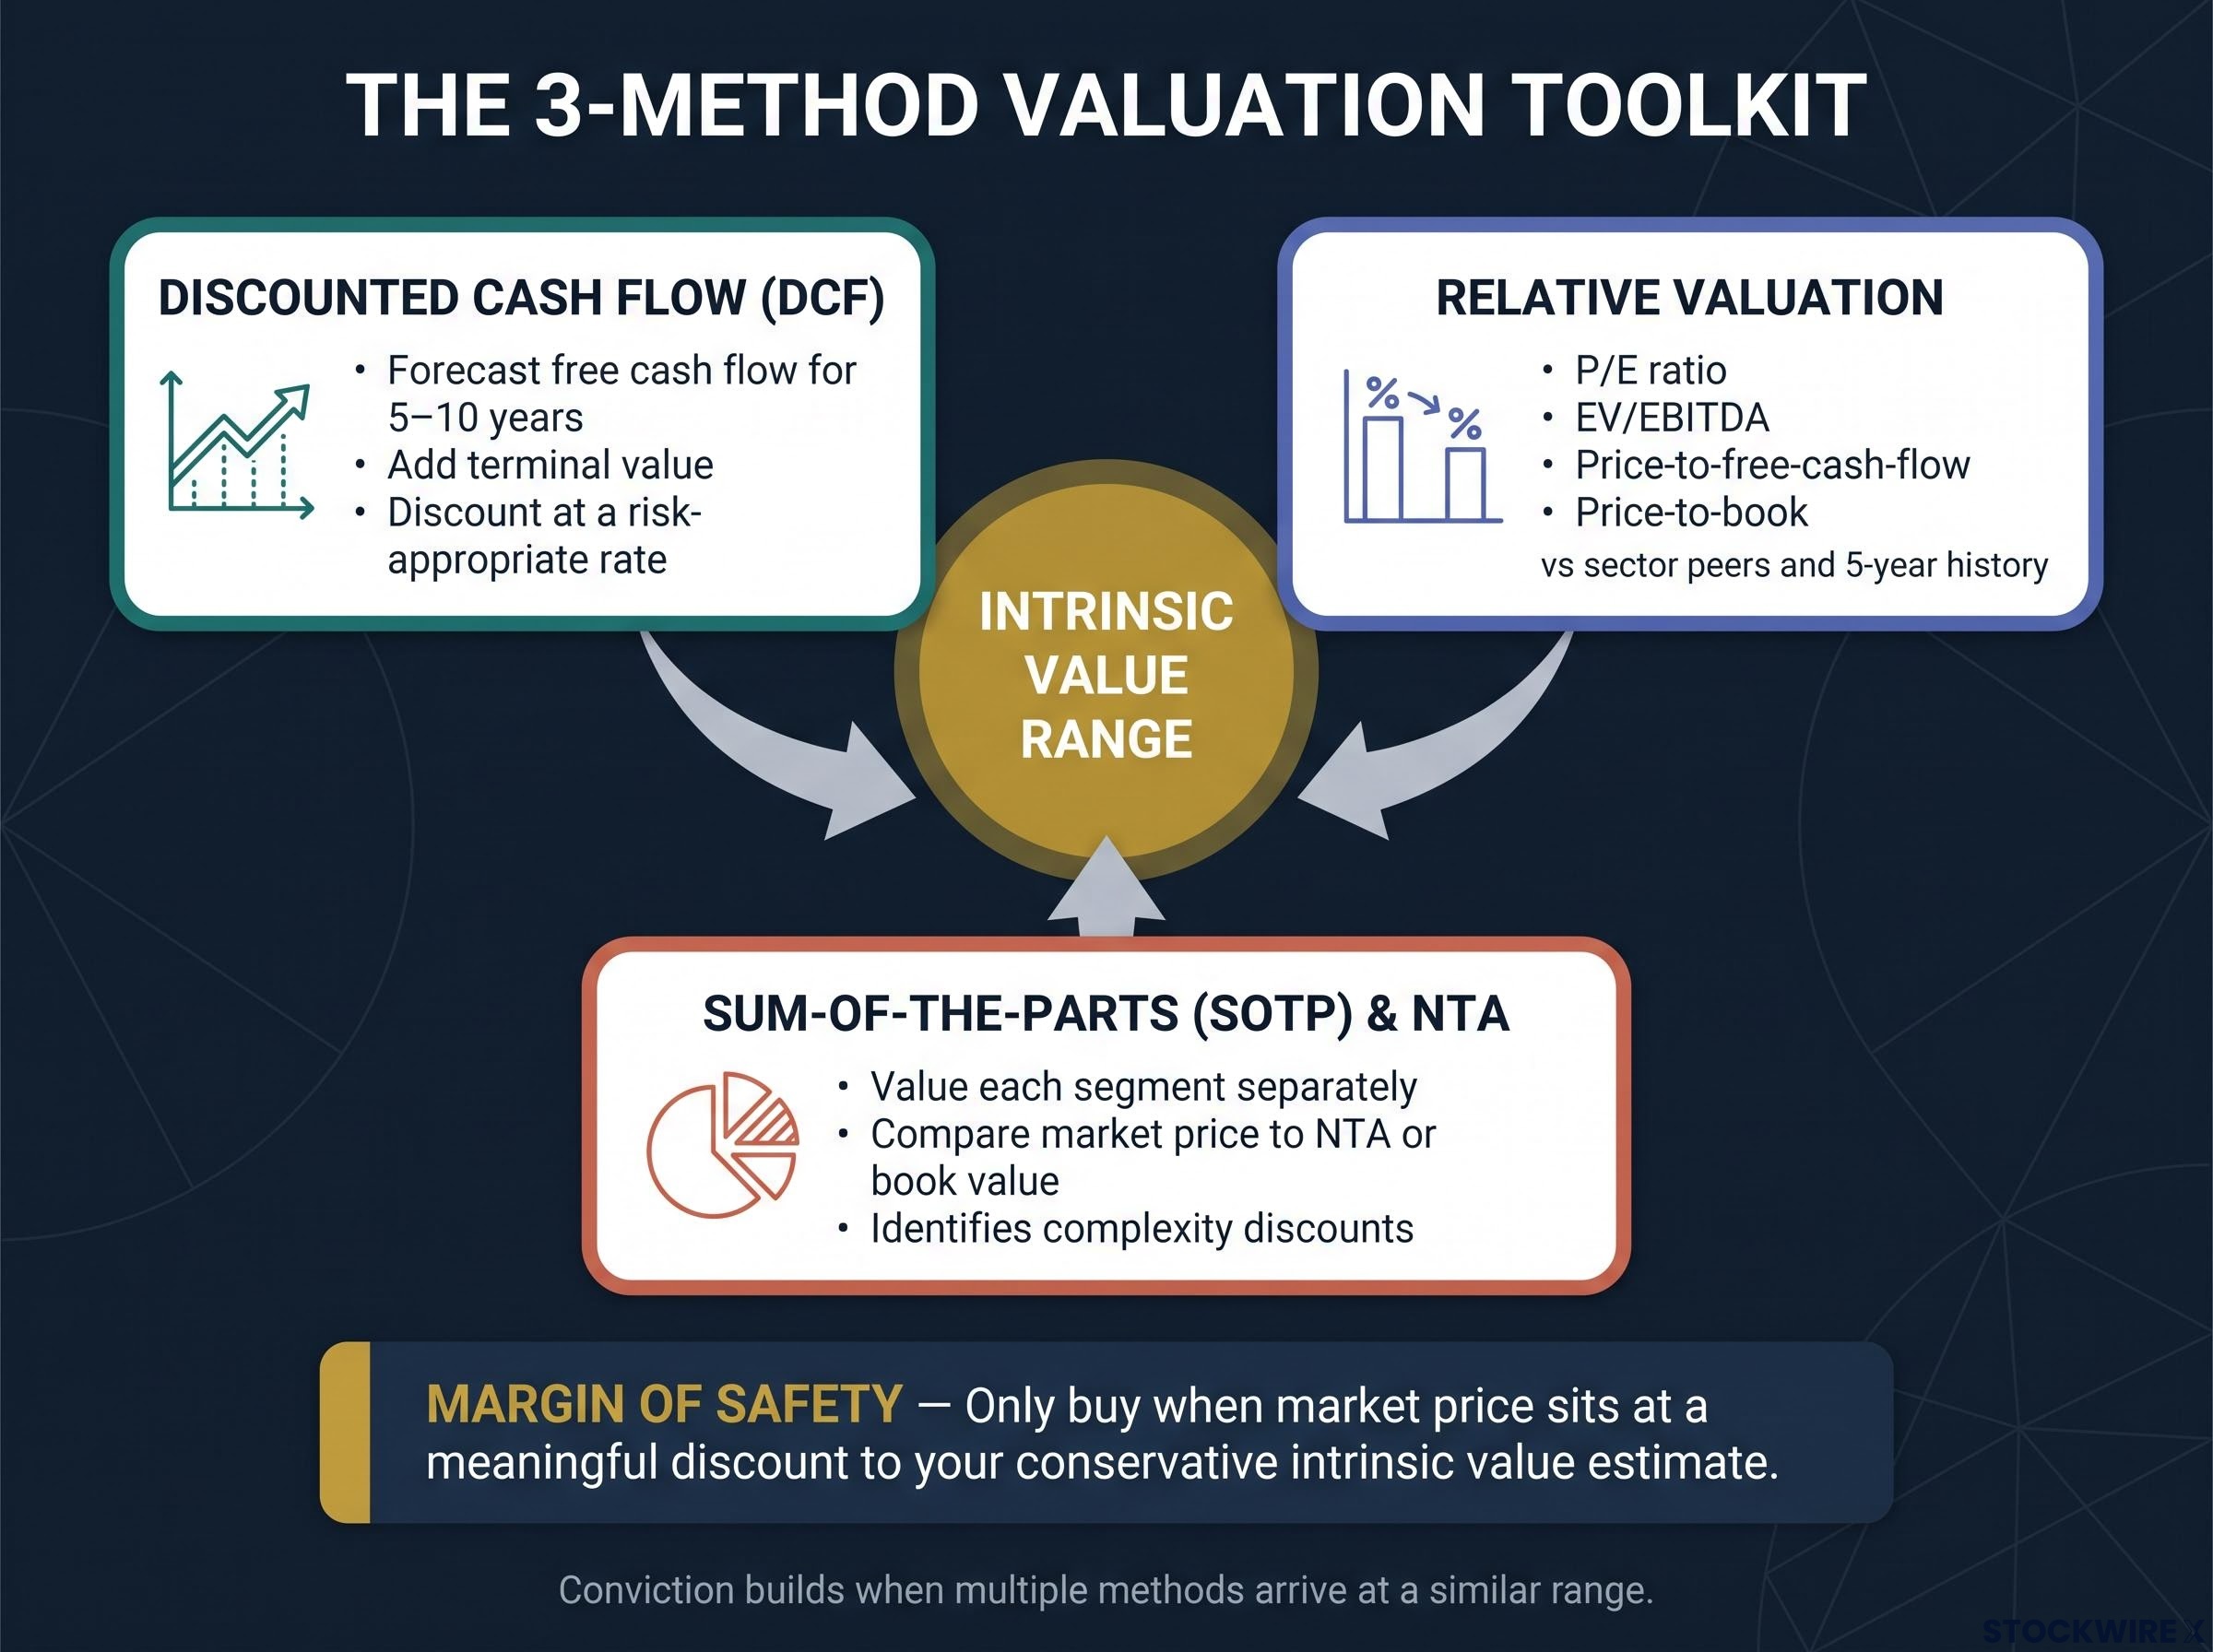
A stock trading at a discount to NTA while also screening cheap on EV/EBITDA and yielding a positive margin of safety in your DCF is a far stronger position than one that passes only a single test. That convergence is what professionals mean when they say a stock is genuinely undervalued.
Where AI fits into a professional research process today
AI has already entered the professional toolkit. This is not a future possibility; it is a current workflow change.
Fundamental Investment Management incorporates Claude by Anthropic into its research workflow, using the tool to significantly speed up the retrieval and examination of historical annual reports and company result announcements, as documented in their July 2026 process description via Firstlinks. The tool handles the archival and data-extraction stages that previously consumed analyst hours, freeing human time for the decisions that require judgement.
CFA Institute research on NLP in investment analysis details how large language models now enable systematic processing of unstructured financial text, including earnings call transcripts and regulatory filings, validating the shift in professional workflows that tools like Claude represent.
Where AI is genuinely useful in stock research today:
- Summarising long annual reports, MD&A sections, and earnings call transcripts
- Extracting specific line items (segment revenue, capital expenditure, debt maturities, risk factors) across multiple reporting periods
- Tracking how management’s language around a specific risk or strategy has shifted over several years
- Drafting initial checklists, thesis outlines, and alternative scenarios to stress-test your assumptions
A practical AI workflow for retail investors
The boundary is clear, and you should respect it. AI does not replace judgement about business quality, competitive dynamics, or management integrity. It surfaces patterns and inconsistencies, but you decide whether they are material. Valuations or models suggested by AI still require your scrutiny of assumptions.
AI limits in primary research are most acute in the ASX small cap segment, where smaller issuers produce less frequent and less detailed public disclosure, leaving the tool with an informational base too thin to support confident thesis building without management meetings and site visits.
Here is a four-step workflow that mirrors how professionals integrate the tool:
- Use AI to collect and summarise filings and earnings call transcripts
- Transfer key figures into your own spreadsheet and verify them against the source
- Use AI to generate stress-test questions, alternative scenarios, and counterarguments to your thesis
- Make all final valuation and buy/sell decisions yourself, based on your model and risk tolerance
For a retail investor working alone, AI eliminates the primary time barrier to running a thorough process. Reading ten years of annual reports in an afternoon rather than a week changes what is practically possible for you as a part-time investor. That shift in capacity is the real value of the tool.
How to mirror this process as a retail investor using public information
Everything described so far is institutional practice. But the structure is transferable. You cannot run a 30-person research team, but you can adopt the same sequence with scaled-down tools and public information. A three-year model built from ASX filings and verified against one competitor’s commentary is infinitely more rigorous than a decision made on a broker note alone.
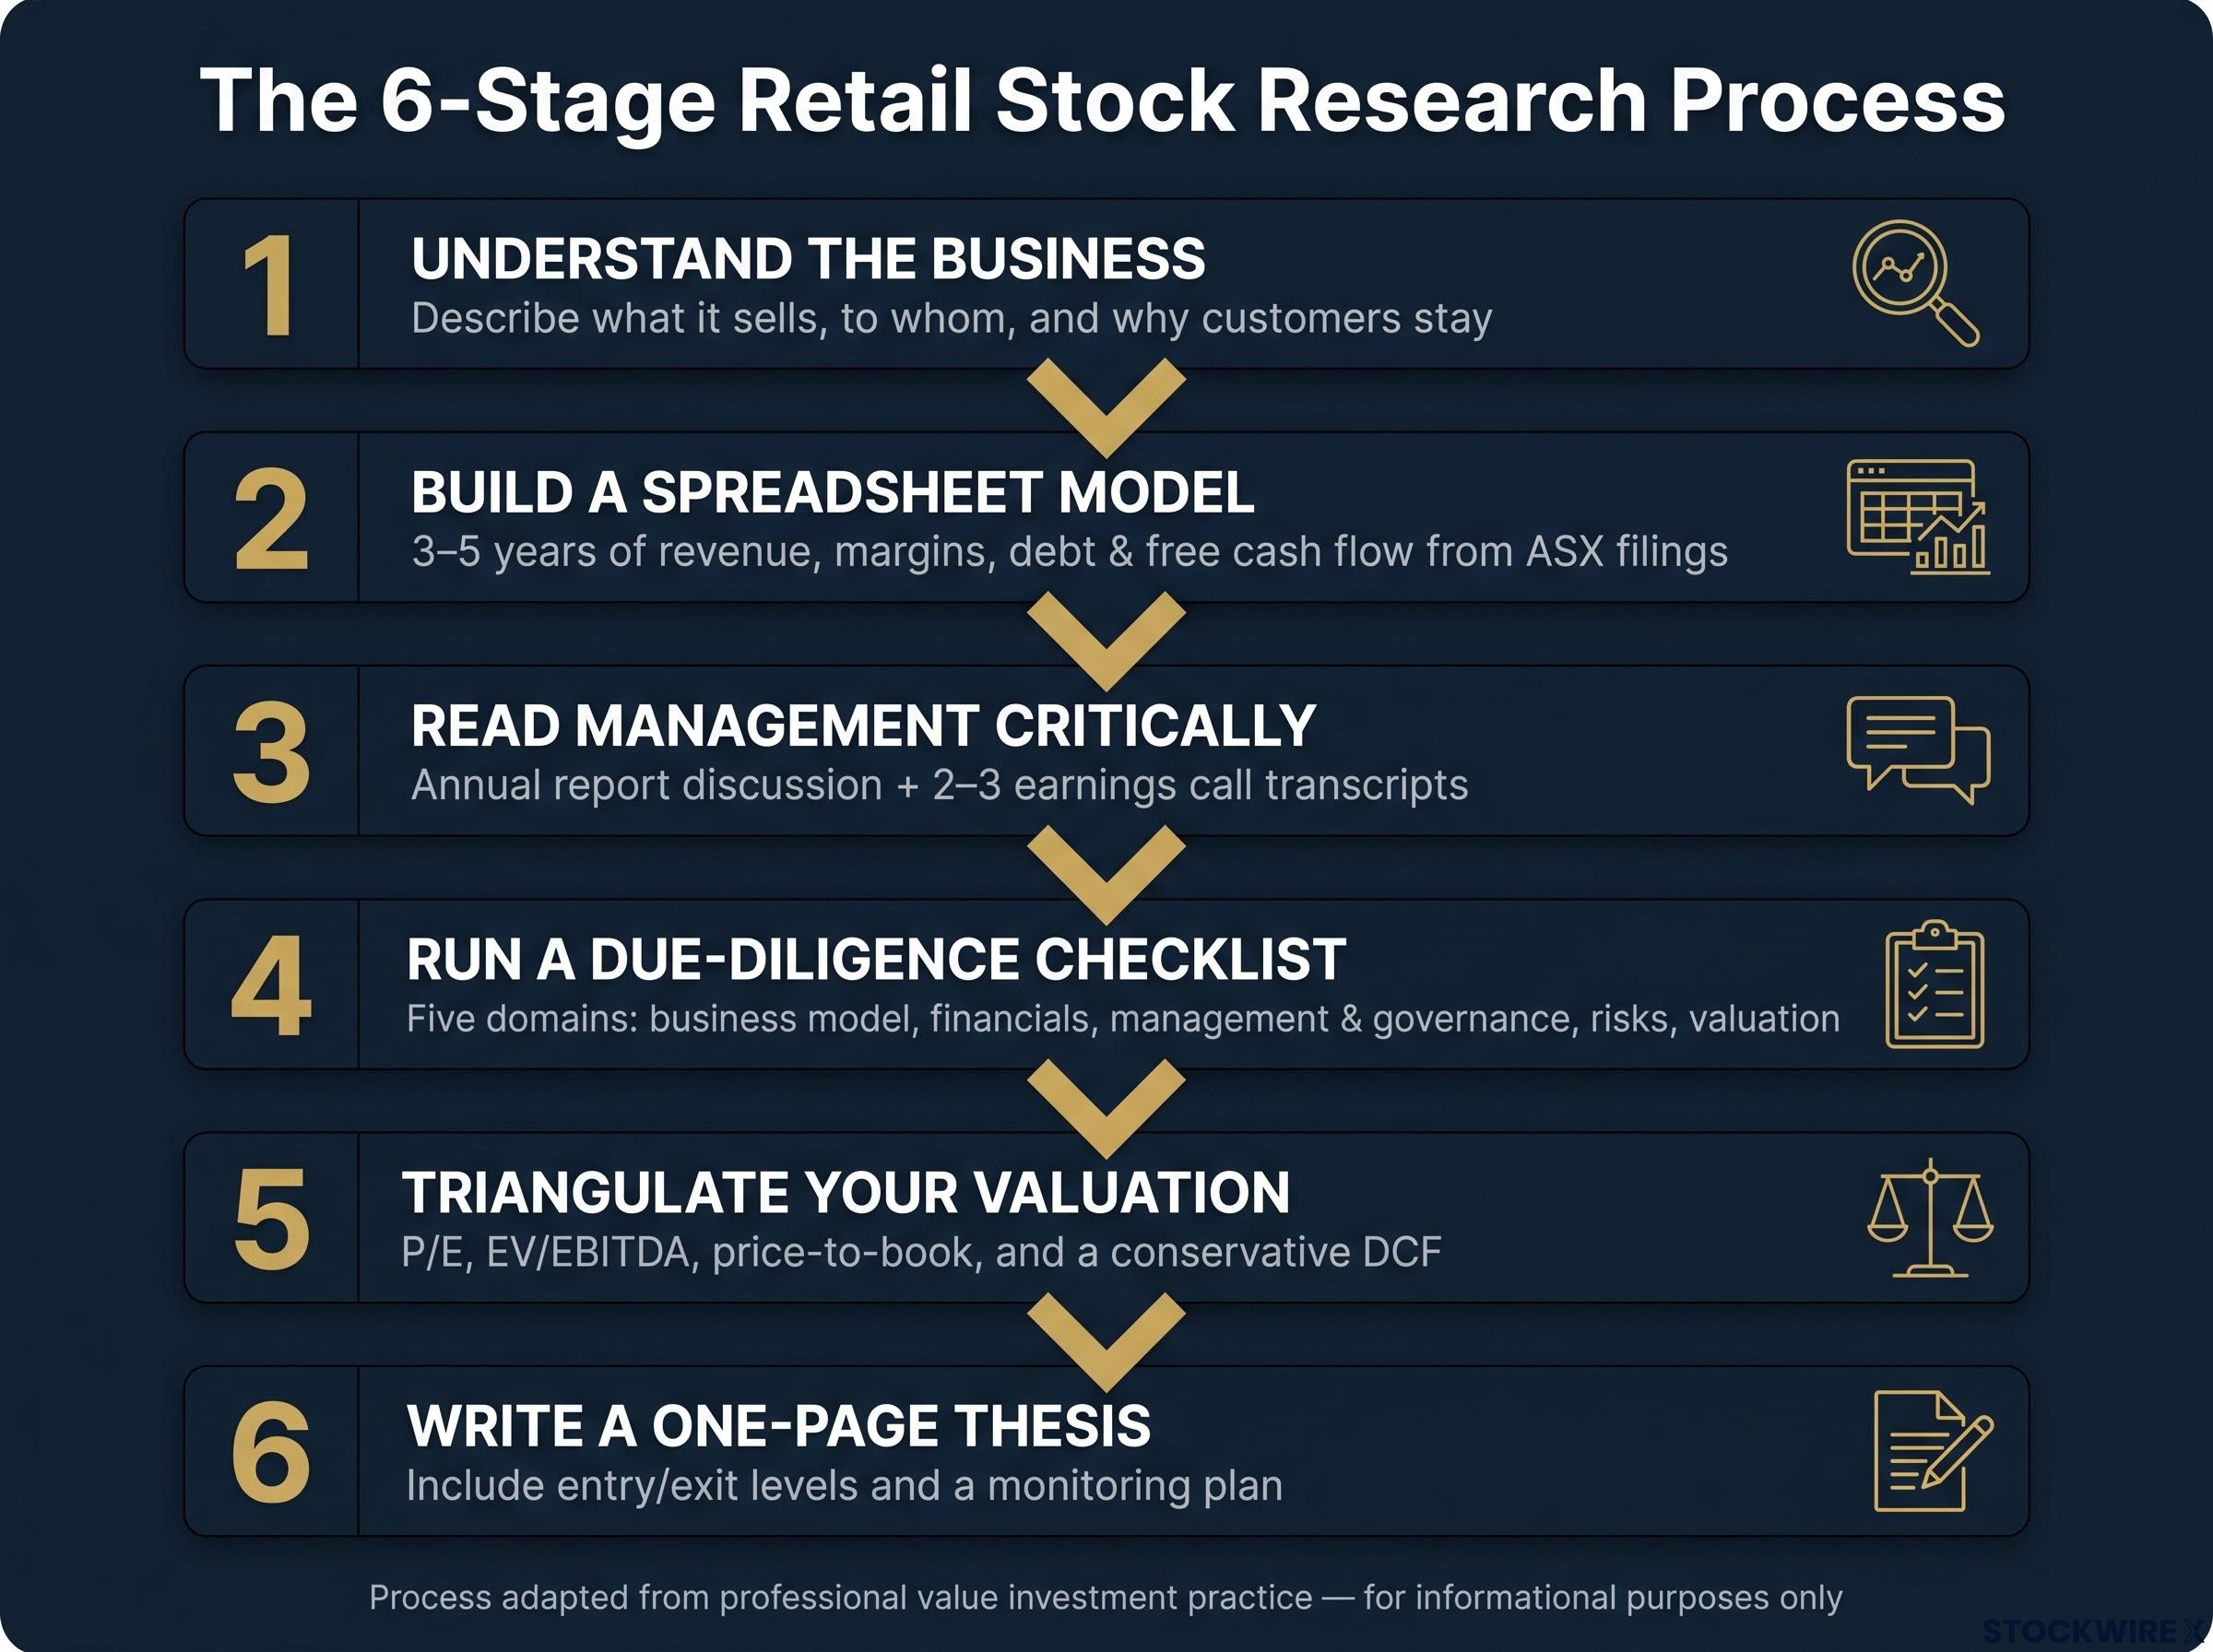
Here is the six-stage retail-adapted process:
- Understand the business in plain language. Describe what it sells, to whom, how it makes money, and why customers stay. If you cannot explain it simply, you do not understand it well enough to value it.
- Build a simple spreadsheet model from public filings. Pull 3-5 years of revenue, margins, debt, and free cash flow from ASX annual reports and full-year result announcements. Track operating cash flow against net income. This is your earnings quality diagnostic.
- Read management’s own words critically. Go through the latest annual report’s management discussion, plus two or three recent earnings call transcripts. Note any changes in how they discuss strategy, risks, or competitive positioning. Compare those statements against what competitors say about the same market.
- Run a formal due-diligence checklist. Cover five domains: business model, financials, management and governance, risks, and valuation. Write down specific risk items, whether that is customer concentration, refinancing risk, or regulatory exposure. The checklist ensures nothing material is overlooked.
- Perform a basic triangulated valuation. Check P/E, EV/EBITDA, and price-to-book against sector peers and the company’s own five-year history. Try a simple DCF with conservative assumptions and wide ranges. Set an entry range, not a single fair value number, and require a clear discount before buying.
- Write a one-page thesis with a monitoring plan. This is the step most retail investors skip, and it is the most protective.
The one-page thesis and why professionals write it down
Your thesis has four components: what the company does, why the stock is attractively priced relative to your intrinsic value estimate, what could prove the thesis wrong, and your entry and exit price levels.
The discipline of writing it down is what separates investors who learn from their mistakes from those who rationalise them after the fact. Every new piece of information, whether an earnings update, a competitor’s result, or a macroeconomic shift, gets evaluated against the thesis rather than in isolation. Without a written thesis, you have no anchor. With one, you have a decision framework that compounds in quality over time.
What a structured process actually protects you from
A structured research process is not extra work for its own sake. It is targeted risk elimination. Each stage directly addresses a specific failure mode that costs retail investors money.
| Common investing error | Process step that addresses it |
|---|---|
| Value traps: stocks that look cheap but have deteriorating cash flows | Multi-metric valuation and cash flow scrutiny in the financial model |
| Management over-trust: taking optimistic guidance at face value | Third-party verification and language analysis across reporting periods |
| Single-metric valuation: buying “cheap” on P/E alone | Triangulated valuation using DCF, relative metrics, and SOTP or NTA |
| Unexamined risks: missing customer concentration, debt maturities, or regulatory exposure | Formal due-diligence checklist covering five risk domains |
| No margin of safety: paying full price so any disappointment breaks the thesis | Requiring a meaningful discount to conservative intrinsic value before purchasing |
Portfolios managed with a value discipline tend to record lower overall volatility than the broader market, with that advantage showing up most clearly in their capacity to limit losses when conditions deteriorate. The stocks held in such portfolios are typically supported by sound, verifiable valuations rather than near-term price momentum, which gives them a more stable foundation when sentiment shifts.
The asymmetry of permanent capital loss is the deepest reason margin of safety is non-negotiable: a 50% portfolio decline requires a 100% gain to recover, which means the cost of overpaying for a stock is not simply a temporary setback but a compounding drag on every future return.
When quantitative and index fund flows push prices away from underlying business value, disciplined value managers treat those dislocations as potential entry points rather than sources of concern. The mispricing that results from systematic, non-fundamental buying and selling is precisely the kind of opportunity that patient, process-driven investors are positioned to capture.
Adopting even a partial version of this process changes your question from “is this stock cheap?” to “why is this stock cheap?” The first question is dangerous without the second.
Taking the first step toward a more rigorous research process
The gap between institutional and retail investment outcomes is primarily a process gap, not an information gap. The tools to close it, from ASX filings and earnings call transcripts to AI-powered filing analysis, are largely available to any Australian investor today.
Your concrete first action: pick one stock you already own or are considering, and work through the six-stage framework described above. Use AI for the filing-review stages. Build even a simple three-year model. Write down your thesis. The process will surface questions you did not know you had, and those questions are where genuine investment insight begins.
Professional value managers like Fundamental Investment Management have refined this process over decades, not because markets are simple, but because markets are noisy. A structured process is how patient investors find signal in that noise. You now have both the map and the tools. The next move is yours.
This article is for informational purposes only and should not be considered financial advice. Investors should conduct their own research and consult with financial professionals before making investment decisions.
—