
The S&P 500 CAPE ratio crossed 40 in May 2026, a threshold breached only once before in more than 140 years of recorded U.S. market history. The last time it happened, the dot-com bubble was nine months from its peak.
That single data point sits at the centre of one of the most polarising valuation debates in recent memory. Bulls point to record corporate profit margins as proof the economy has genuinely changed. Bears point to a CAPE reading more than double its 145-year average and argue that no structural story justifies prices this extreme. Both camps have real evidence. Neither has certainty.
Here is a framework for reading the CAPE ratio honestly: what it actually signals, where the bull case has merit, where it strains credulity, and what a CAPE near 40 means for how you should be thinking about equity returns over the next decade.
How the CAPE ratio works, and why the current reading is extraordinary
The cyclically adjusted price-to-earnings ratio, also called the Shiller P/E, takes the real (inflation-adjusted) price of the S&P 500 and divides it by a decade’s worth of averaged, inflation-adjusted earnings. Using a long earnings window is the entire point of the measure: it irons out the sharp profit swings that make any single year’s earnings an unreliable yardstick for valuation.
The construction has four features worth understanding:
- It uses 10 years of earnings data, not one, to smooth the profit cycle
- It adjusts both price and earnings for inflation, so comparisons across decades are valid
- It is designed as a long-run forecasting tool, not a short-term trading signal
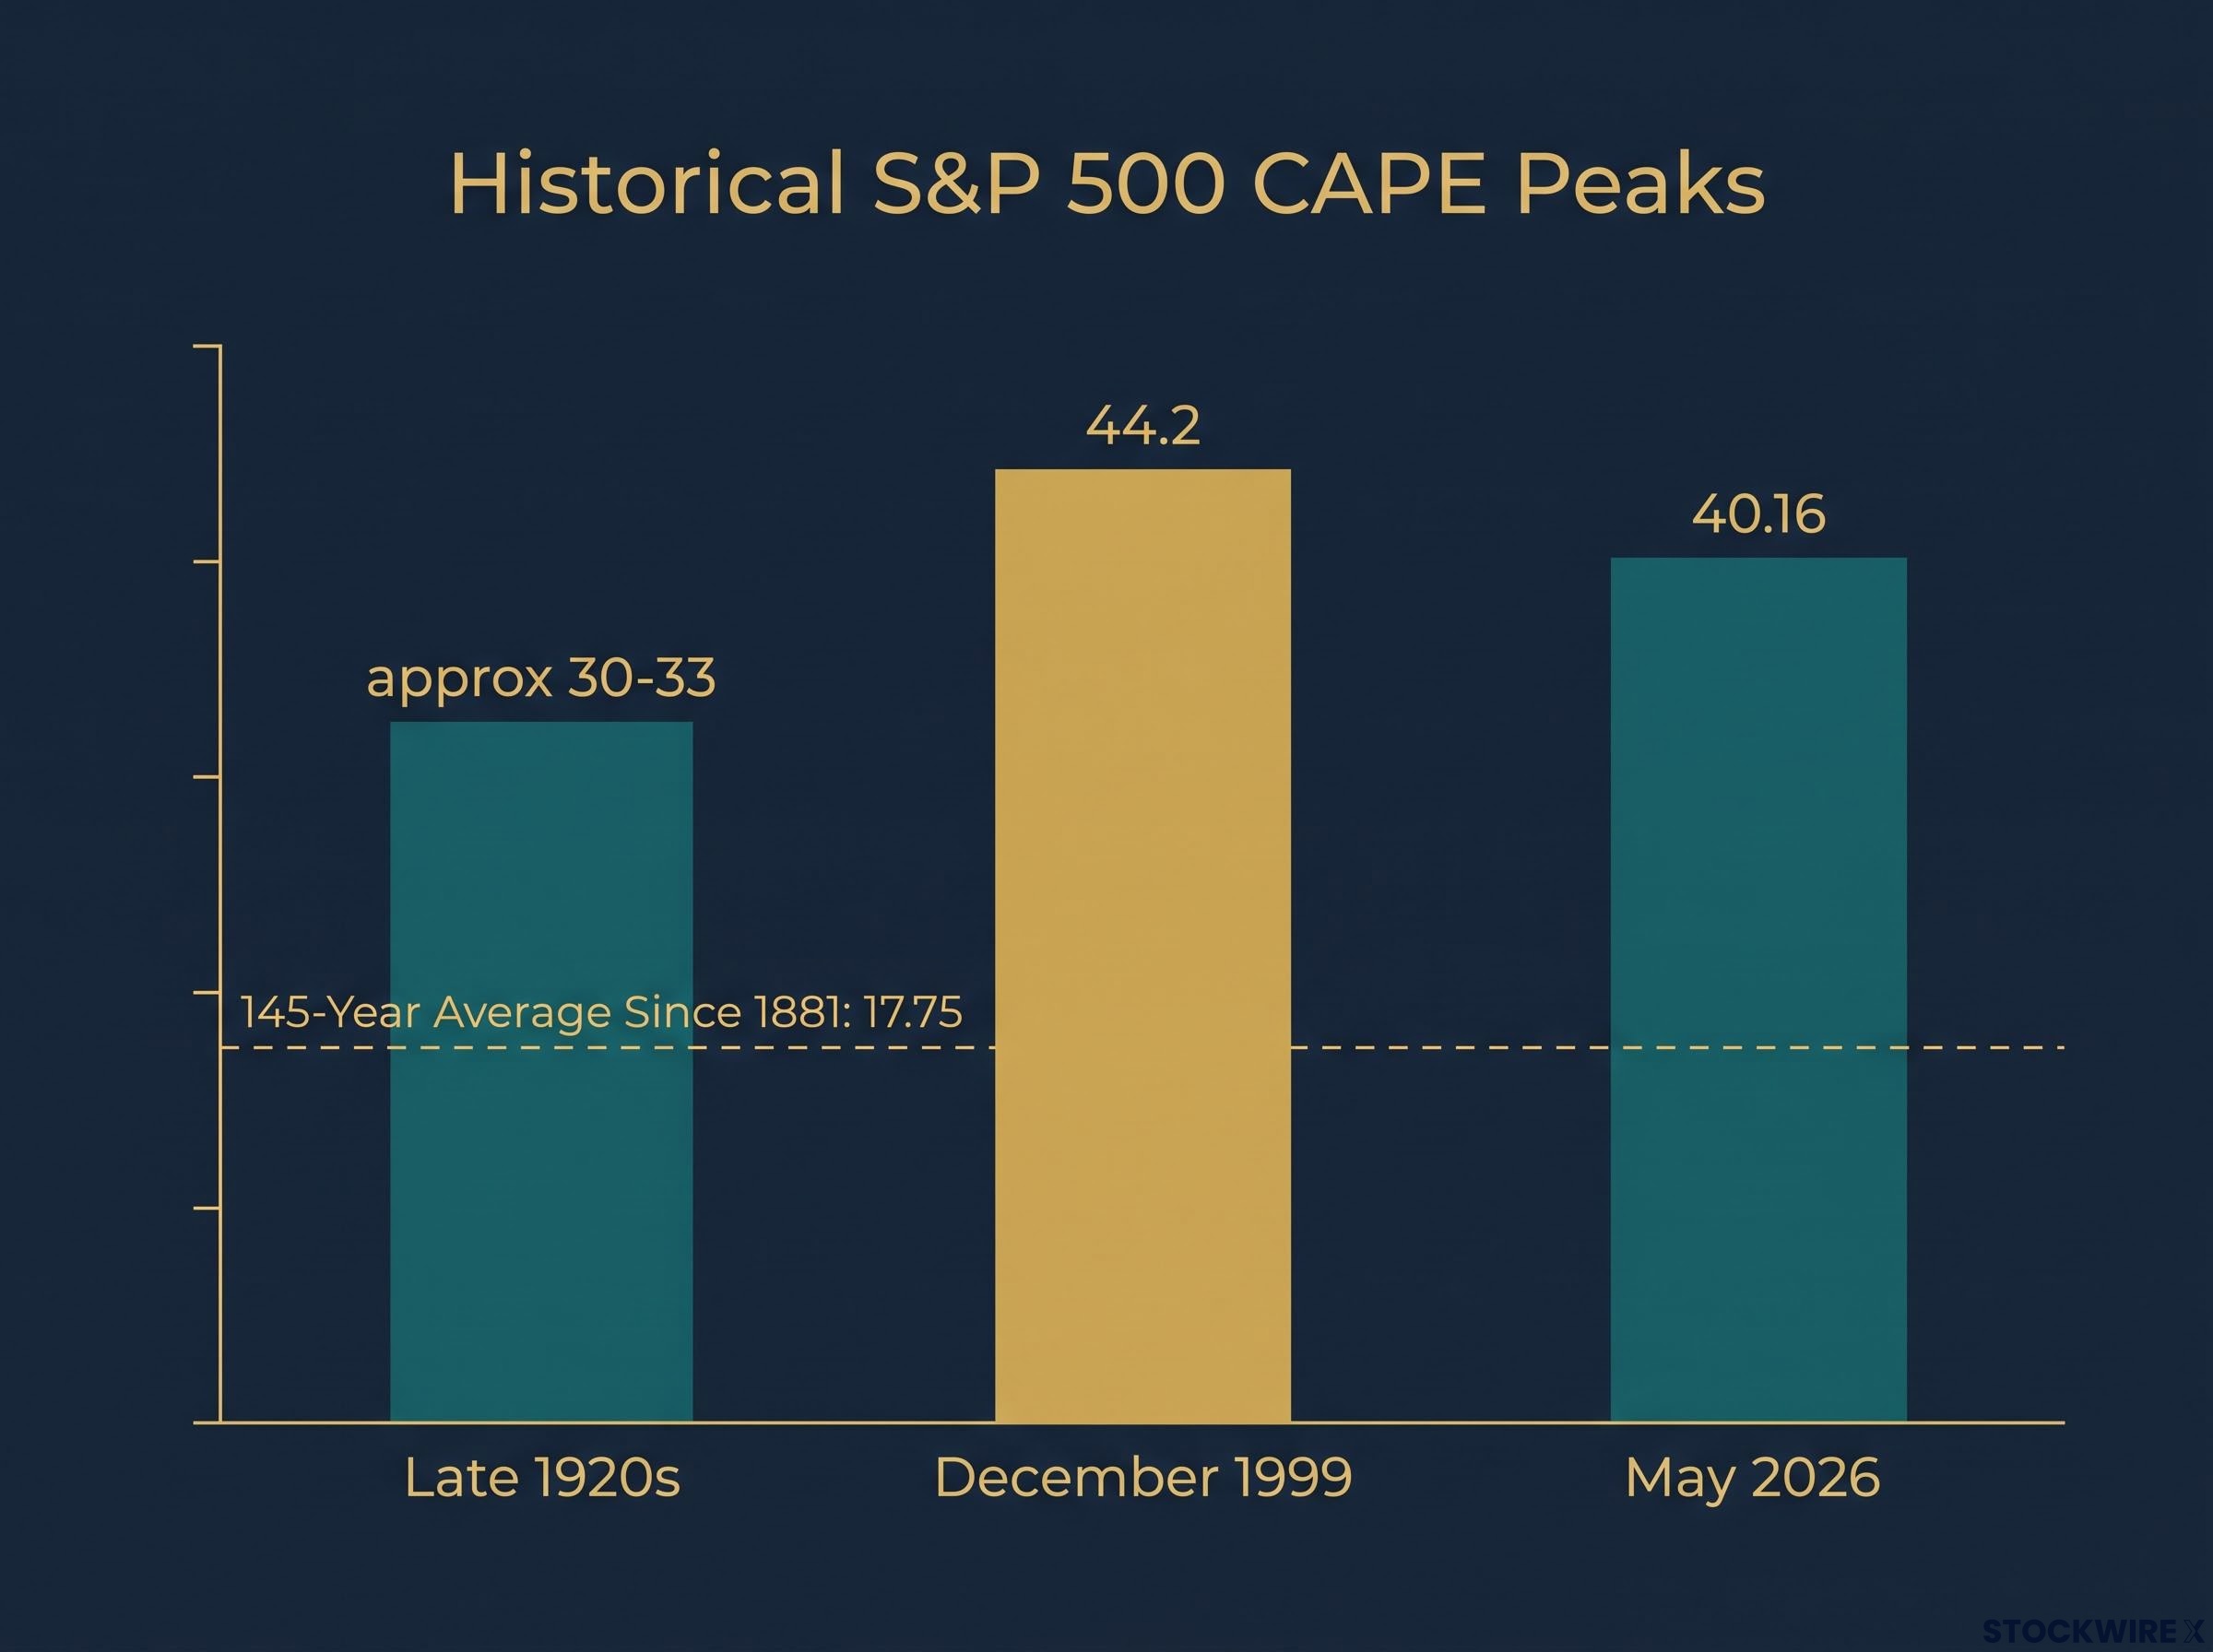
- Its long-run average since 1881 is 17.75, giving investors a stable baseline for comparison
“A CAPE of 40.16 as of May 2026 means U.S. equities are priced at more than double their 145-year average valuation.”
Only two prior episodes have approached this territory. The late 1920s peak reached approximately 30-33, well below 40. The dot-com era peaked at roughly 44.2 in December 1999. With a reading of 40.16, the S&P 500 now sits in territory that has appeared in only one other data cluster across nearly a century and a half of recorded market history.
Why conventional P/E ratios fail where CAPE succeeds
A standard trailing P/E ratio divides price by just one year of earnings. That creates a specific distortion: during recessions, depressed earnings make stocks appear artificially expensive, and during profit surges, elevated earnings make stocks appear artificially cheap. CAPE’s 10-year smoothing removes this distortion, giving investors a valuation signal that is comparable across different stages of the earnings cycle.
When big ASX news breaks, our subscribers know first
The only comparable moment: what the dot-com era actually looked like
The dot-com precedent matters, but it matters for reasons that are more subtle than the headline comparison suggests. The ratio did not vault straight to 44: it first cleared the 40 mark in January 1999 and kept rising for the better part of a year before the market turned.
- January 1999: CAPE breached 40 for the first time in recorded history
- December 1999: CAPE reached its all-time peak of approximately 44.2
- March 2000: The market began its sustained collapse
- 2000-2010: A decade of poor real returns followed, validating the signal retrospectively
The 1929 peak, often invoked in bubble discussions, never crossed 40. It topped out around 30-33. That means the dot-com episode is the only true precedent for today’s reading, and the comparison is not hyperbole.
The AI stock bubble debate extends the CAPE discussion into market structure: the top 10 S&P 500 constituents now account for 40-43% of total index market capitalisation, more than 50% above the dot-com era peak concentration of roughly 27%, adding a second layer of risk that the CAPE ratio alone does not capture.
Robert Shiller has consistently framed CAPE as a tool that speaks to long-run expected returns, not to the timing or form of any correction. The ratio tells you what valuation regime you are in. It does not tell you when that regime will change.
What the dot-com timeline actually shows is that extreme CAPE readings can persist for months to years before resolving. The correct response is not a binary decision to exit equities, but a recalibration of return expectations and risk tolerance for what may be a multi-year process.
Record profit margins: the evidence that complicates a straightforward bearish reading
The bearish case built on CAPE alone is incomplete, and the reason is profit margins.
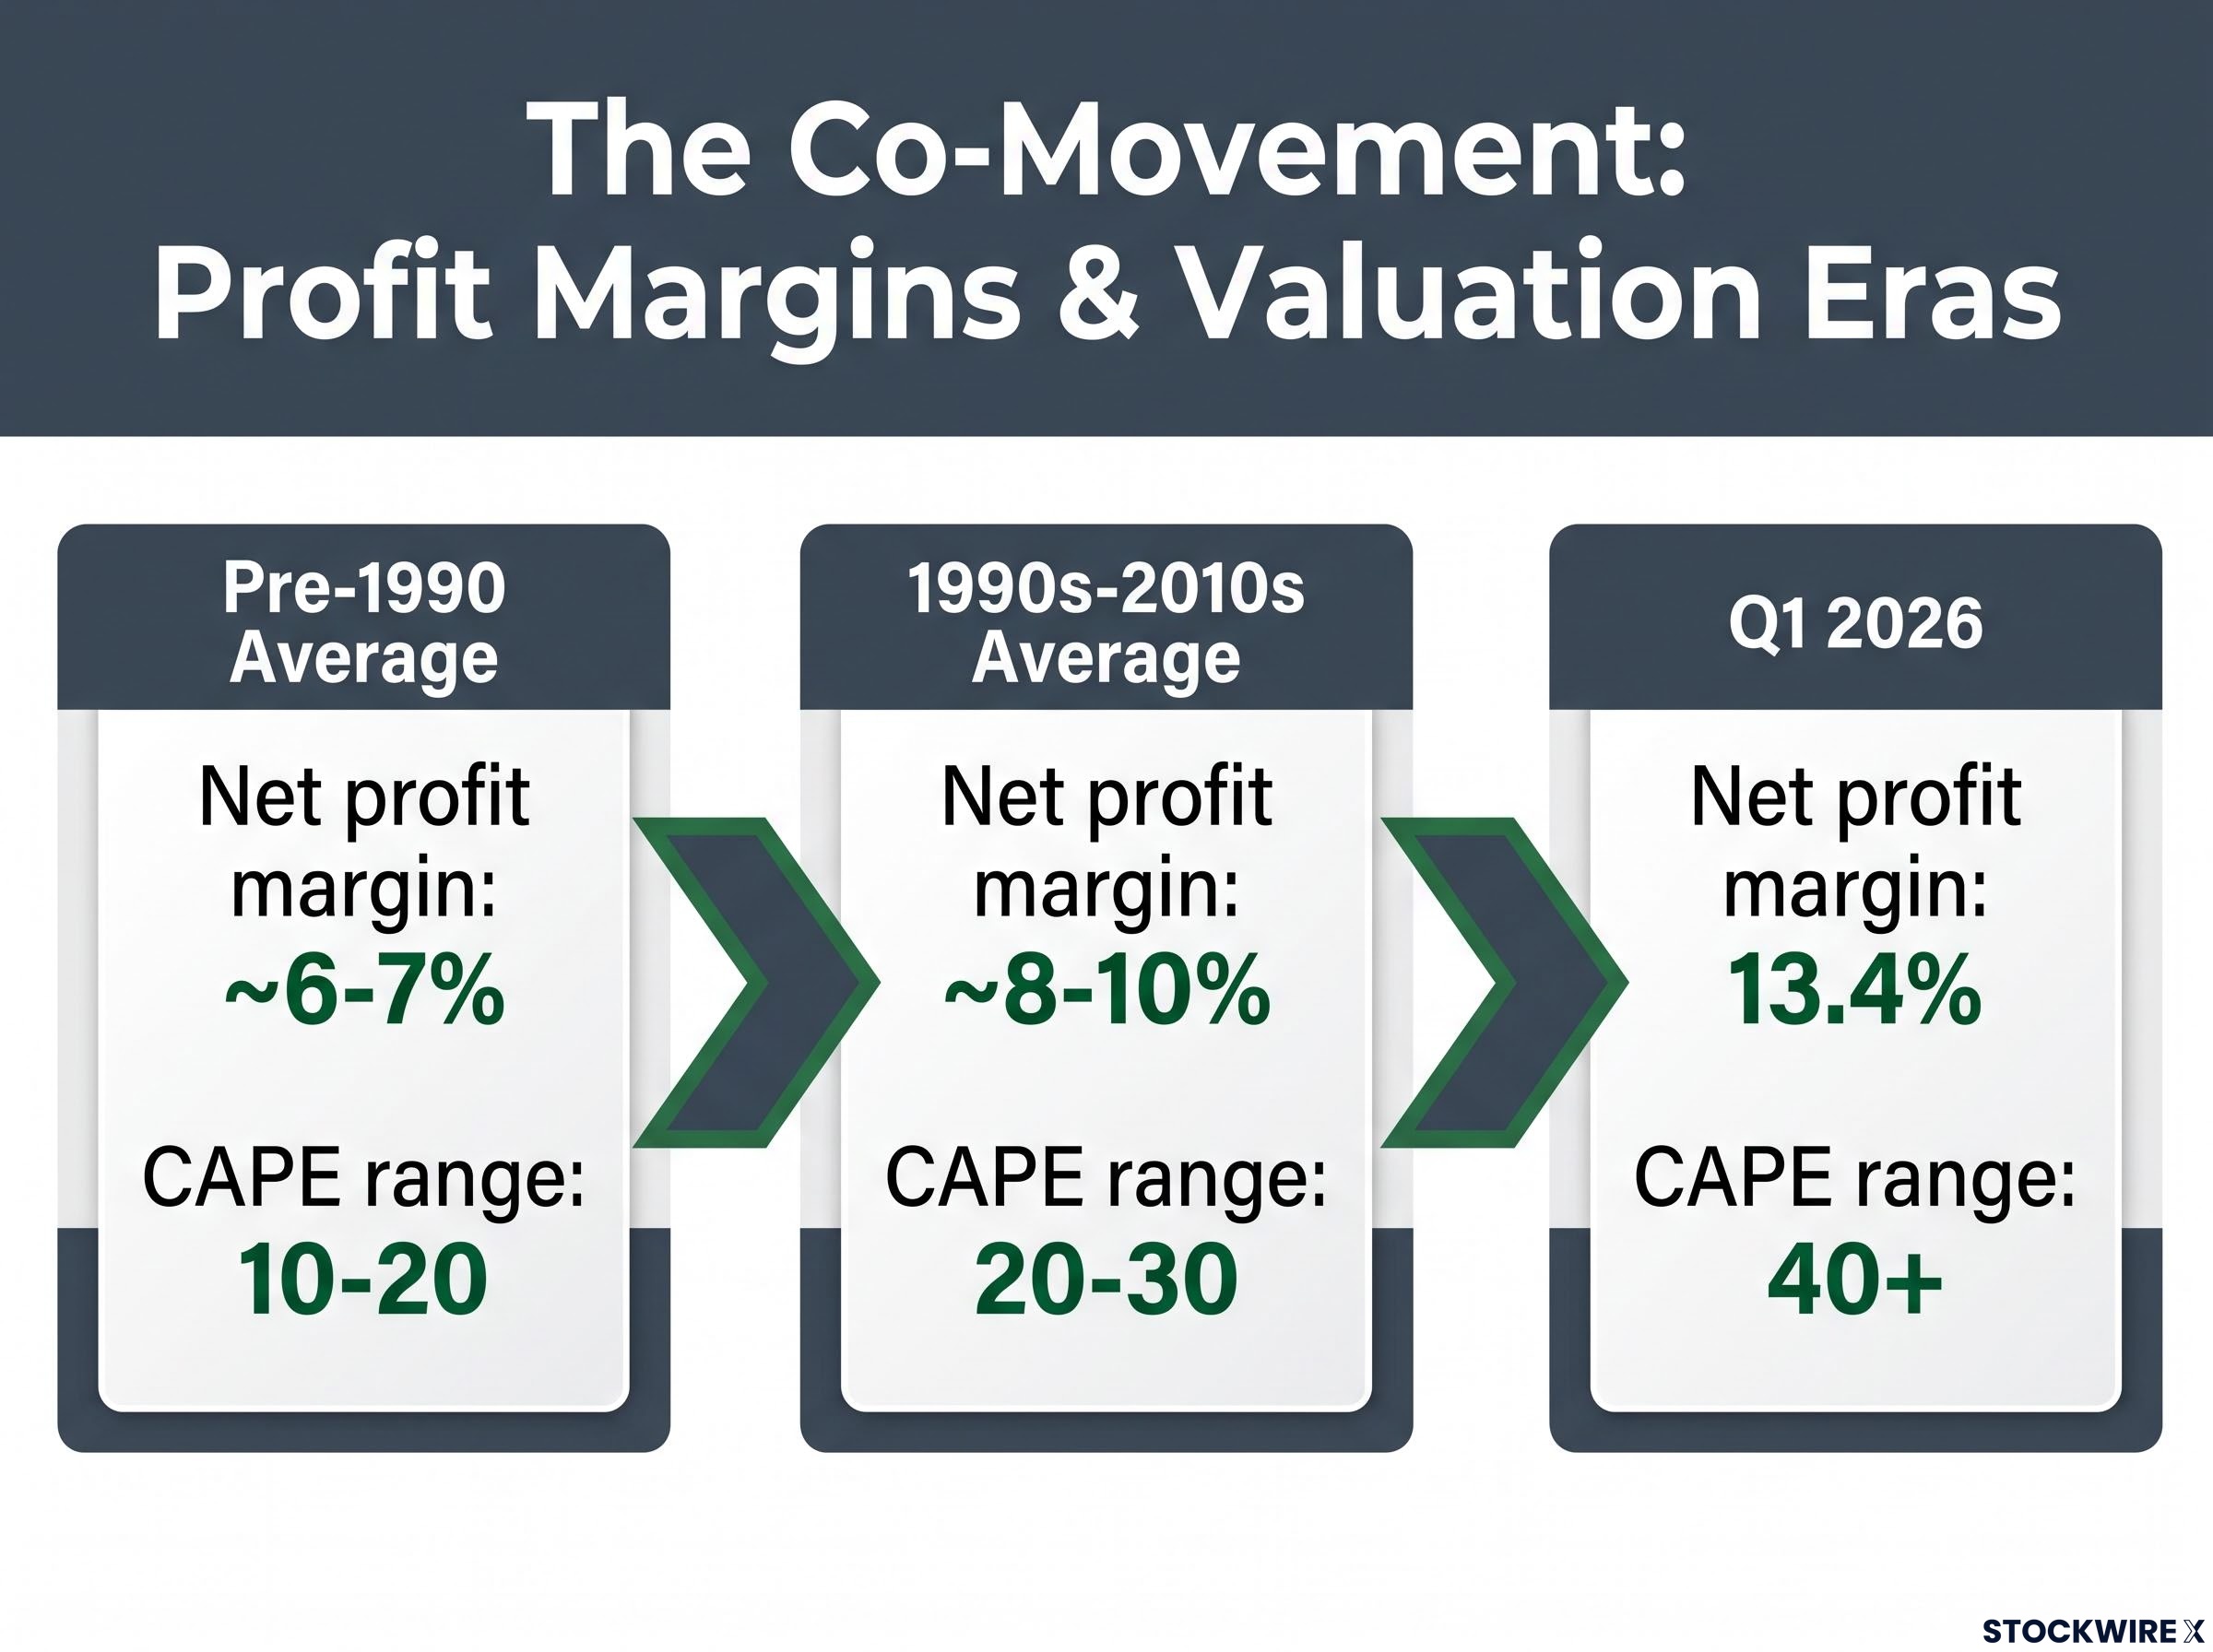
According to CBS MarketWatch, the S&P 500 net profit margin reached 13.4% in Q1 2026, against a long-run average of 6.3% going back to 1946. That gap is substantial: American corporations are generating roughly twice the profit per dollar of revenue that the historical record would suggest is normal, and those elevated earnings flow directly into CAPE’s 10-year denominator.
| Era | Net profit margin | Approximate CAPE range |
|---|---|---|
| Pre-1990 average | ~6-7% | 10-20 |
| 1990s-2010s average | ~8-10% | 20-30 |
| Q1 2026 | 13.4% | 40+ |
The co-movement is hard to dismiss. As margins have risen decade by decade, CAPE has followed. A portion of today’s elevated multiple reflects genuinely higher earnings power, not just speculative excess.
The structural drivers behind higher corporate profitability
Several reinforcing forces make a compelling case for durably higher margins: technology and automation have cut operational costs across virtually every industry; the economy has tilted meaningfully toward capital-light, scalable business models; globalised supply chains and leaner inventory practices have reduced input costs; and artificial intelligence may represent the next major wave of productivity improvement across the corporate sector.
Where the structural argument reaches its limits
Grant every point in the structural case. Margins are genuinely higher. Business models have changed. Technology has created lasting efficiencies. Even then, the arithmetic of mean reversion raises a question that is difficult to wave away.
A complete simultaneous return of both the CAPE ratio and net profit margins to their respective long-run averages would point to an S&P 500 level of around 1,646, roughly 78% below where the index currently trades.
“A full reversion of both the CAPE ratio and net profit margins to their long-run averages would imply an S&P 500 level of approximately 1,646, a conceptual scenario, not a forecast, but a measure of the gap between current prices and historical norms.”
That figure is not a prediction. It is a way of quantifying the compound exposure embedded in today’s market. Current prices require three conditions to hold simultaneously:
- Structurally higher profit margins persist at or near record levels
- The CAPE multiple holds at historically extreme readings
- No macroeconomic shock triggers reversion in either variable
Long-run data on profit margins shows tendencies toward mean reversion over multi-year periods, as competition, regulation, and macroeconomic conditions shift. Some structural change likely justifies higher normal margins and somewhat higher normal valuations than in the mid-20th century. That does not automatically justify multiples more than double the long-run average.
Return on equity compression from accelerating AI capital expenditure introduces a third variable the CAPE debate does not fully price in: Goldman Sachs projects a seven-point ROE decline for the mega-cap tech cohort driving record margins, as roughly $770 billion in 2026 capital expenditure flows through depreciation schedules over the next several years.
What this tells you is that you are holding a position with two simultaneously stretched variables. Understanding that compound exposure is what determines appropriate risk management posture, not whether a correction happens next quarter.
What CAPE near 40 actually signals about the next decade of returns
CAPE’s primary empirical function is straightforward: it forecasts average real returns over 10-20 year horizons. Higher CAPE readings are statistically associated with lower subsequent decade-long returns, as valuations drift back toward longer-term norms.
What CAPE near 40 tells you:
- Expect below-average real returns from U.S. large-cap equities over the next 10-20 years
- The margin for error in return assumptions is thin
- Compounding effects of even modestly lower annual returns are significant over a retirement horizon
- Risk management matters more than usual at stretched valuations
What CAPE near 40 does not tell you:
- When a correction will arrive
- What form the valuation resolution will take (crash, slow grind, or extended flat returns)
- That you should exit equities entirely
- That CAPE above 40 cannot persist for months or years before resolving
Why the 10-20 year forecast horizon is the right lens
Valuations are poor short-run predictors because sentiment, momentum, and liquidity can override fundamentals for extended periods. Over 10-20 year horizons, however, reversion to mean has historically been a powerful force. Demanding a one-year signal from CAPE is a category error: it asks a long-run instrument to perform a short-run function it was never designed to do.
For U.S. investors building or sustaining retirement portfolios, a CAPE near 40 is not a reason to sell everything. It is a statistically grounded reason to model future equity returns conservatively, and that recalibration has concrete downstream effects on savings rates, asset allocation, and withdrawal planning that deserve immediate attention.
Four portfolio moves worth considering at historically extreme valuations
These are risk-management and expectation-calibration responses, not market-timing calls.
- Valuation diversification. With U.S. large-cap equities at extreme CAPE readings, other geographies and styles, including European equities, value tilts, and smaller caps, frequently trade at significantly lower multiples. Tilting modestly toward cheaper assets is a rational adjustment, not a bet against U.S. markets.
- Earnings quality monitoring. At stretched valuations, margin compression or earnings deceleration removes the structural justification for elevated multiples and can trigger rapid repricing. Tracking margin trends becomes a more critical signal than usual.
- Leverage and concentration discipline. Extreme valuations argue for avoiding excessive leverage or single-stock concentration, where the asymmetry of outcomes is worst. Very high CAPE levels have sometimes persisted for years, which is precisely why leverage carries outsized downside risk at these levels.
- Return-assumption recalibration. Update financial plans and retirement models to reflect the statistical likelihood of below-average real returns from U.S. large-cap equities over the next decade. Several percentage points of annual real return difference compounds significantly over a retirement horizon.
| Move | What it involves | What it does not mean |
|---|---|---|
| Valuation diversification | Tilting toward cheaper geographies and styles | Abandoning U.S. equity exposure entirely |
| Earnings quality monitoring | Tracking margin trends and earnings revisions closely | Selling at the first sign of margin pressure |
| Leverage and concentration discipline | Reducing leverage and single-stock concentration | Moving to all cash or all bonds |
| Return-assumption recalibration | Modelling lower expected real returns in financial plans | Assuming equities will deliver zero returns |
Each of these moves is a form of recognising that the margin for error in a CAPE-40 environment is thin. The practical response is to build portfolios that can survive a range of outcomes rather than ones that require the optimistic scenario to hold.
For investors wanting to translate these risk-management principles into a concrete framework, our comprehensive walkthrough of portfolio risk management covers beta-weighted position sizing and volatility targeting with a six-step rebalancing workflow designed to close the gap between dollar allocation and actual market exposure.
What the CAPE debate actually asks of investors: navigating genuine uncertainty
The structural argument for higher margins has genuine merit. The CAPE signal has 145 years of empirical support. Holding both of these things to be true at once is what makes the current environment analytically challenging and practically uncomfortable for investors on every side of the debate.
How observers read the evidence tends to reflect their prior convictions: those who lean pessimistic find the valuation data alarming, while those who lean optimistic find the margin data reassuring. Both readings deserve scrutiny.
The most durable takeaway is this: a CAPE at 40.16 with net profit margins at 13.4%, both historically extreme simultaneously, is a risk-management signal and a return-expectation recalibrator, not a market-timing tool. The investors most at risk are those who treat it as either a reason to panic or a reason to do nothing.
This article is for informational purposes only and should not be considered financial advice. Investors should conduct their own research and consult with financial professionals before making investment decisions. Past performance does not guarantee future results. Financial projections are subject to market conditions and various risk factors.