
Most Australian income investors eventually discover that “buy dividend stocks” is not a strategy. The real question is which structure should hold those stocks, because the container changes the income you receive, the tax attached to it, and how much work you carry.
With franking credits, superannuation phase transitions, and the concentration of Australian dividend payers in two sectors, the structure decision is more consequential here than in almost any other market. The choice between a Listed Investment Company (LIC), a dividend Exchange Traded Fund (ETF), and a direct share portfolio is not cosmetic. It determines whether your income is smoothed or volatile, whether you control when you realise capital gains, and whether an active manager is taking a cut of returns you could otherwise keep.
Here is a framework for matching structure to your own income objective, tax situation, and time availability. Not every reader needs the same answer, and by the time you finish this, you will understand why that is the point.
Why the structure you choose matters more than the stocks inside it
Two investors can own the exact same underlying companies and receive materially different after-tax income. The difference is the vehicle holding those companies.
LICs, dividend ETFs, and direct shares are not three flavours of the same product. They are legally and operationally distinct containers, each with its own rules for how income reaches you, how tax is generated, and how much control you retain. Before you evaluate a single product, you need to understand which trade-offs you are actually willing to accept.
| Feature | LICs | Dividend / Factor ETFs | Direct Shares |
|---|---|---|---|
| Legal structure | Company (closed-end) | Unit trust (open-ended) | Direct ownership |
| Income smoothing | Yes, can retain profits | No, mandatory pass-through | No, depends on each company |
| Franking mechanics | Generates additional franking at LIC level | Passes through underlying franking only | Direct franking from each company |
| Fees | Typically higher than broad ETFs | Lower than active LICs; higher than broad index | Brokerage only, no ongoing fee |
| Control over tax events | Low | Low | High, you decide when to sell |
Australia’s large banks and resource companies dominate both market capitalisation and dividend distributions. That means cap-weighted index exposure already tilts toward yield without requiring a specialist product. The structure decision is not about finding yield. It is about deciding how that yield reaches you and what you sacrifice along the way.
When big ASX news breaks, our subscribers know first
How LICs create smoothed, franked income and what that costs you
The appeal of a LIC starts with a structural feature no ETF can replicate. Because a LIC is a company rather than a unit trust, it can retain earnings in strong years and draw on those reserves to maintain dividends in weak ones. For a retiree drawing income quarterly, this is not a nice-to-have. It is a structural defence against having to sell assets in a down market to fund living expenses.
Argo Investments has maintained annual dividends since 1946 and full franking since the introduction of the imputation system.
When COVID-19 hit and numerous listed companies cut or abandoned their dividends entirely, a number of the larger LICs were able to keep their own payments relatively steady throughout the period. That resilience is the smoothing mechanism doing exactly what it is designed to do.
There is a second, less appreciated advantage. A LIC pays company tax at 30% (for large entities) on its income and realised gains. Because the LIC itself is an Australian company that earns profits and pays Australian tax, it can attach franking credits to dividends distributed from those retained profits, regardless of where the underlying assets are located. A global LIC investing in international shares can therefore pass Australian franking credits to its investors, which is an outcome a standard international ETF structure cannot replicate.
International equity exposure via a LIC is the one structural path through which offshore returns can carry Australian franking credits to the investor, because the LIC pays Australian corporate tax on its consolidated profits regardless of where the underlying assets are located.
The closed-end structure also insulates the manager from redemption flows, reducing pressure toward short-term decision-making. But the same structure creates the costs you need to weigh.
LIC shares can trade at a discount or premium to the underlying Net Tangible Assets (NTA), which is the per-share value of the portfolio. Buying at a premium means overpaying. A persistent or widening discount can drag on your returns even if the portfolio performs well. Monitoring NTA versus price is an ongoing requirement. And because most LICs are actively managed, your outcome depends on manager skill and fees, both of which are difficult for individual investors to evaluate with confidence.
LICs tend to suit you if you:
- Prioritise stable, fully franked income over chasing maximum yield
- Are retired or near-retired and need to minimise income volatility
- Value franking on both Australian and international exposure
- Are willing to monitor NTA discounts and premiums
- Accept higher fees and active-manager risk in exchange for smoothing
What dividend ETFs actually deliver for income investors (and where they fall short)
Dividend and factor ETFs solve the two biggest LIC complaints in one stroke. There is no NTA discount risk, because the unit trust structure keeps the trading price close to the value of the underlying portfolio through market-making and creation/redemption mechanisms. And there is no subjective manager to evaluate, because the portfolio follows transparent, rules-based methodology you can assess in advance.
Those are genuine advantages. Here is what they look like in practice:
- Units trade close to Net Asset Value (NAV), removing the additional return uncertainty that LIC discounts create
- Rules-based, transparent portfolios allow you to evaluate the methodology before you invest
- Fees are generally lower than active LICs, though niche factor or dividend ETFs cost more than broad index products
- Liquidity is high, with tight bid-ask spreads and typically daily holdings disclosure
ASIC’s regulatory guide on exchange traded products sets out the obligations ETF issuers and market operators must meet, including the creation and redemption mechanisms that keep ETF unit prices close to underlying net asset value, which is the structural feature that eliminates the NTA discount risk present in closed-end LICs.
The income mechanics, however, work differently from what many investors expect.
ETFs are structured as unit trusts. They must distribute their net income and realised capital gains each year. They cannot build reserves for future smoothing. When underlying companies cut dividends, or when the ETF realises material capital gains through portfolio turnover, those outcomes flow straight through to your distributions.
The June distributions for both the BetaShares Australian Ex-20 Portfolio Diversifier ETF (ASX: EX20) and the VanEck Australian Equal Weight ETF (ASX: MVW) came in roughly 40% below what investors received in the same period the year before.
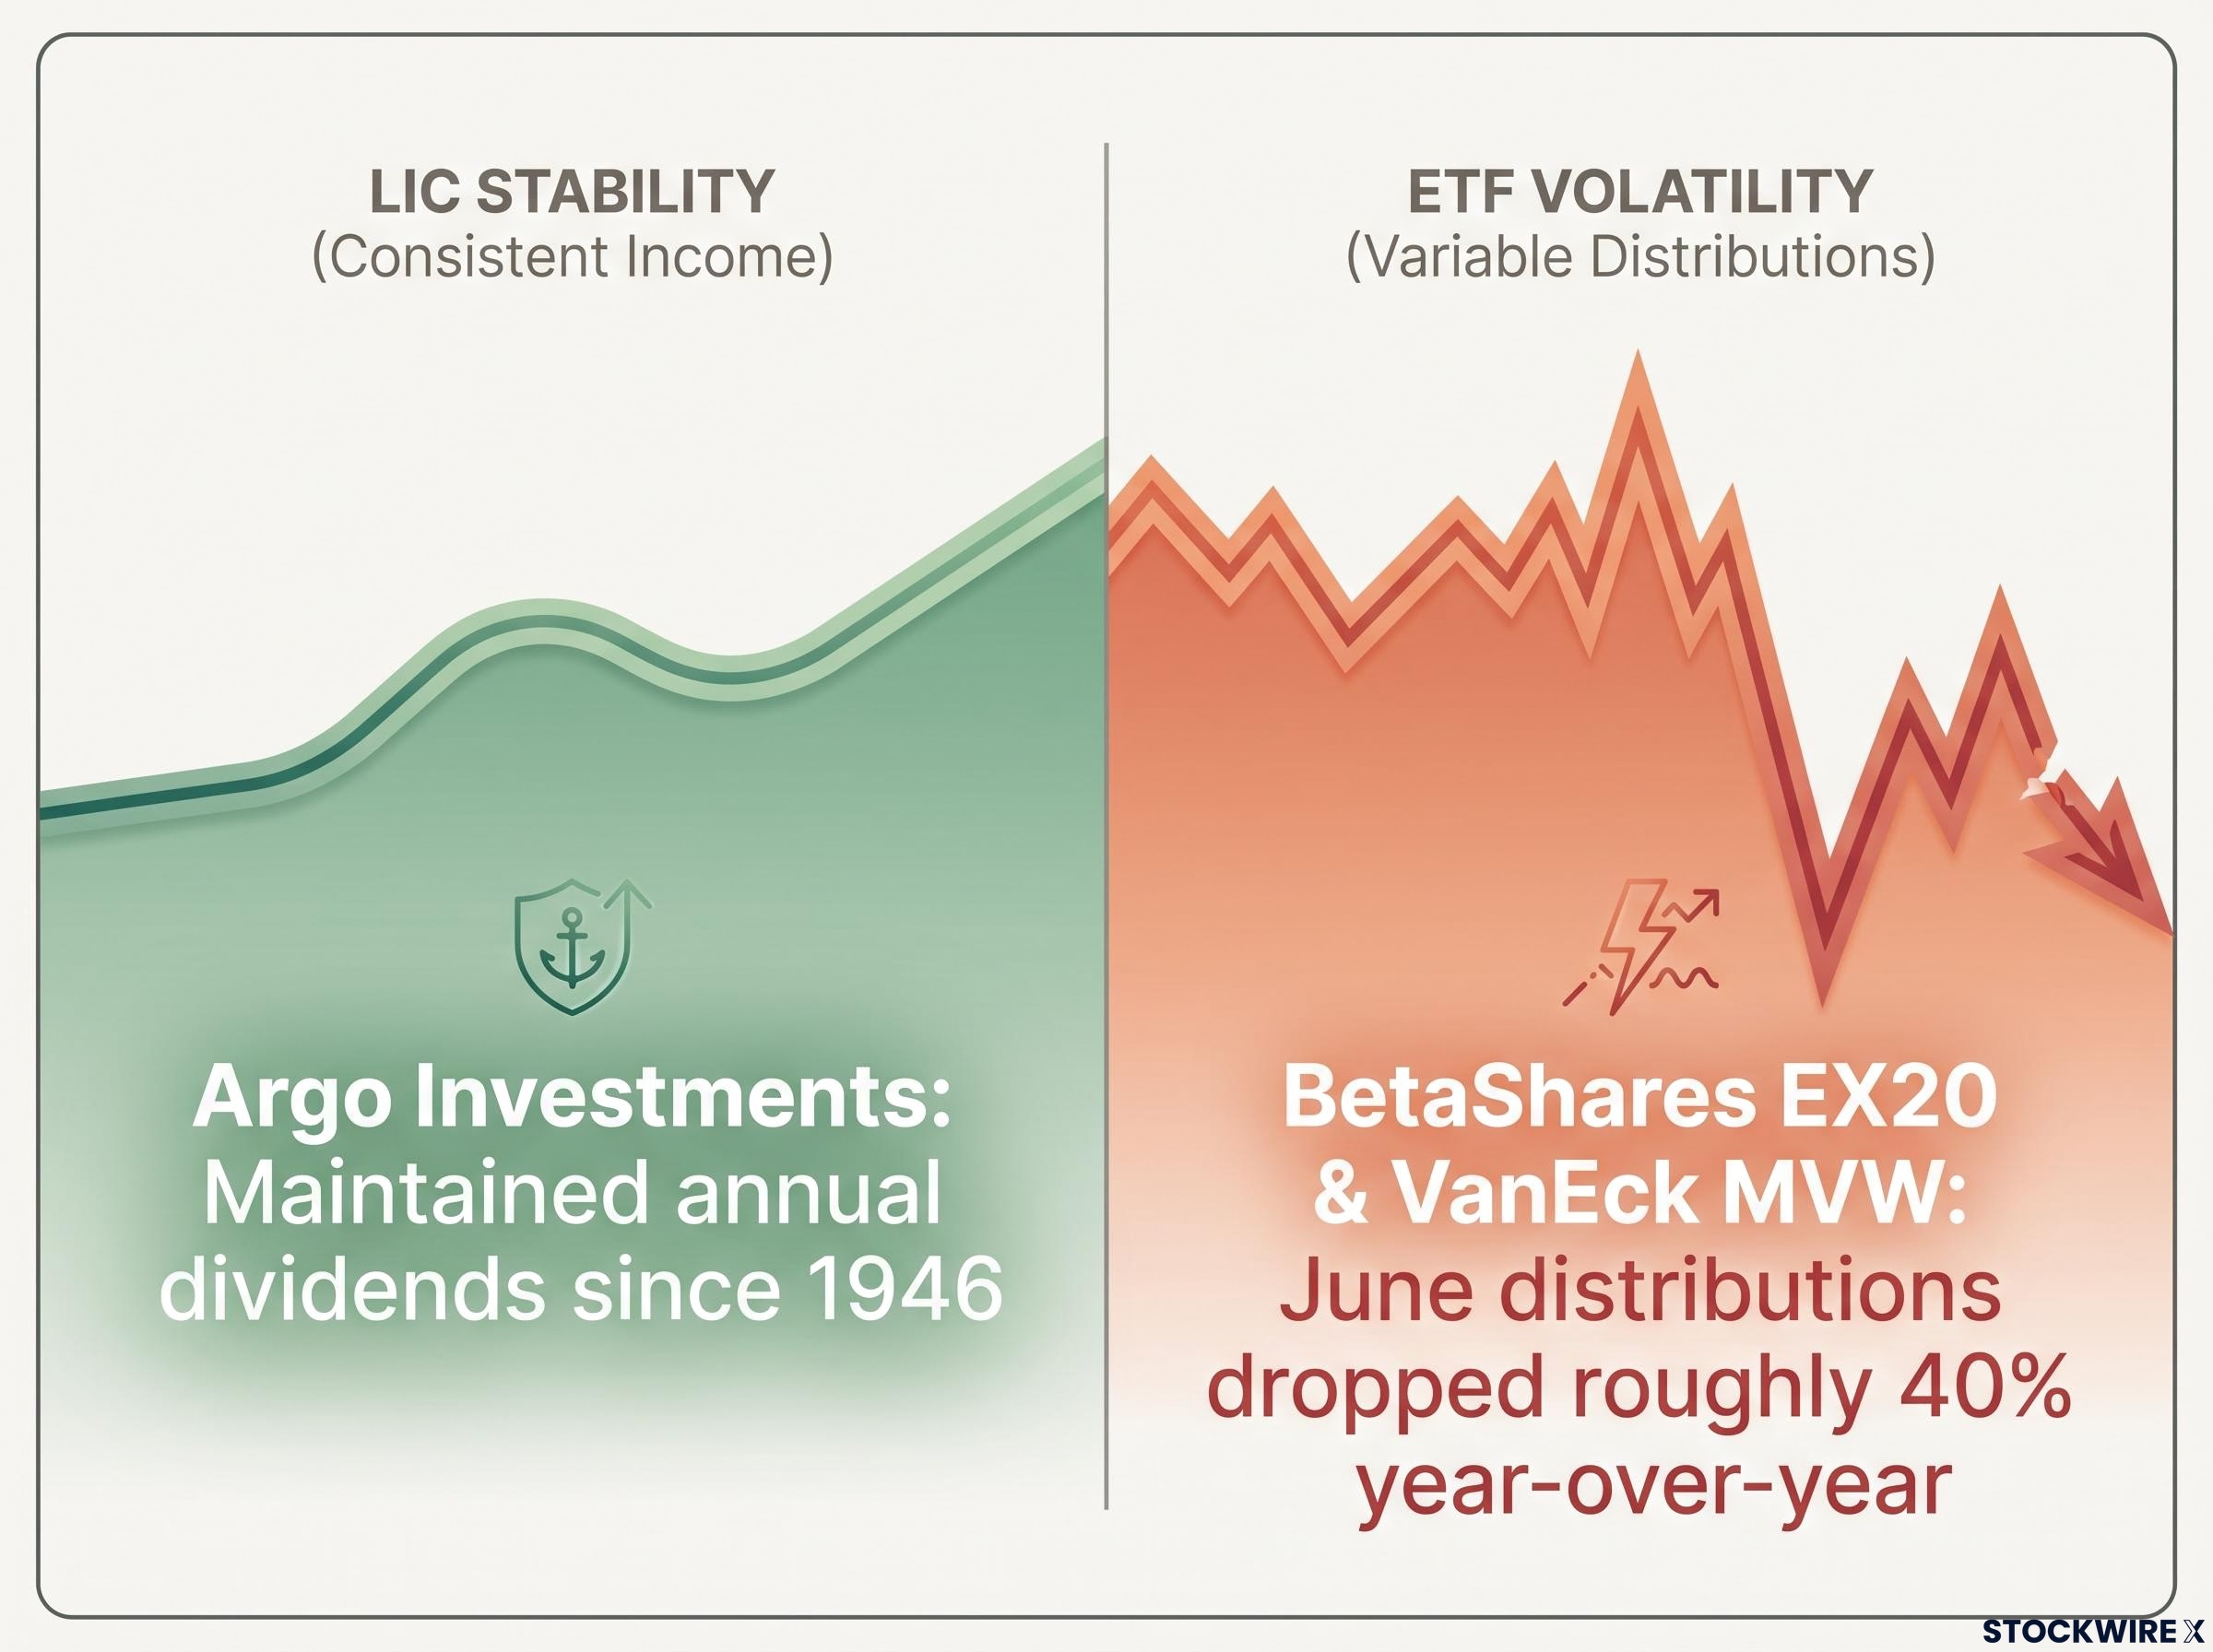
That 40% drop is the clearest single illustration of what pass-through income volatility looks like. Before choosing an ETF as your primary income vehicle, you need to ask whether your budget can absorb a swing of that size.
The drawbacks for income-focused investors go further:
- No built-in smoothing mechanism to dampen distribution declines during stress periods
- Franking flows only from underlying holdings; no additional franking is generated at the trust level
- Factor ETFs often carry higher turnover, generating realised capital gains that appear in your distributions and may be taxed differently to franked dividend income
- MVW investors may find that capital gains make up a larger share of their distributions than they expect
In the Australian context, moving away from cap-weighting through equal-weighting, excluding the top 20, or applying yield screens does not automatically result in more reliable income. The dividend difficulties that affect the major miners and banks flow through to their smaller counterparts as well, often with greater severity because those companies lack the scale to absorb pressure as readily.
Building a direct share income portfolio: the case for and against doing it yourself
Direct share ownership gives you two things no pooled vehicle can: zero ongoing management fees and complete control over when you realise capital gains and losses. For investors with a portfolio large enough that a 0.5% annual management fee represents a five-figure annual cost, the fee argument alone justifies serious consideration. Calculate your own number before dismissing the effort required.
Why income-focused analysis is more tractable than most investors assume
Evaluating shares for income purposes is a narrower task than total-return investing. You are assessing business earnings capacity, dividend history, payout ratios, and debt sustainability. There is no need to forecast how the market will price the stock at any given moment, which sector will rotate into favour next, or how other investors will respond to news flow.
Payout ratio analysis is the most reliable early warning system available to direct share investors: a ratio rising from 40% toward 80% across successive reporting cycles often signals that future dividends depend on earnings recovery rather than sustainable free cash flow.
Dividend-paying companies tend to be well-established businesses with relatively predictable earnings, operating in industries where competitive dynamics shift slowly. The lower failure risk makes them easier to hold with conviction, and the focus on income rather than price removes much of the noise that leads investors to make poor decisions. Concentrating on the cash a business returns to you, rather than watching the share price daily, keeps your attention on the factors that actually determine your outcome.
The risks you are taking on when you go direct
The primary drawback is idiosyncratic concentration risk. With fewer holdings than a fund, your income and capital are more exposed to company-specific shocks. A portfolio of 8-15 high-quality, dividend-paying ASX companies is a practical range for managing this, but you need deliberate diversification across enough positions and sectors to avoid being over-exposed to a single earnings disappointment.
The time cost is real. Staying current on results seasons, capital-allocation announcements, and industry shifts across a dozen or more companies is non-trivial. You also carry full responsibility for the discipline required to focus on income rather than price noise.
Direct shares tend to suit you if you:
- Have time, interest, and competence to analyse businesses
- Value control, transparency, and fee minimisation more than convenience
- Have a larger portfolio where management fees would be a material drag
- Want fine-grained control over capital gains timing, including super phase transitions
- Can manage the behavioural discipline to focus on income, not price movements
How franking credits change the calculus for Australian income investors
Franking is the single biggest reason Australian income investing strategy diverges from international equivalents. If you do not account for it in your structure decision, you are likely leaving meaningful after-tax value on the table.
The imputation system works like this: when an Australian company pays corporate tax on its profits, it attaches franking credits to the dividends it distributes. Those credits represent tax already paid. When you receive the dividend, you include the grossed-up amount (the dividend plus the credit) in your taxable income, then claim the credit as a tax offset. If your marginal tax rate is lower than the corporate rate, you receive a refund of the difference. If your tax rate is zero, as in a self-managed superannuation fund (SMSF) in pension phase, you receive the entire credit as a cash refund.
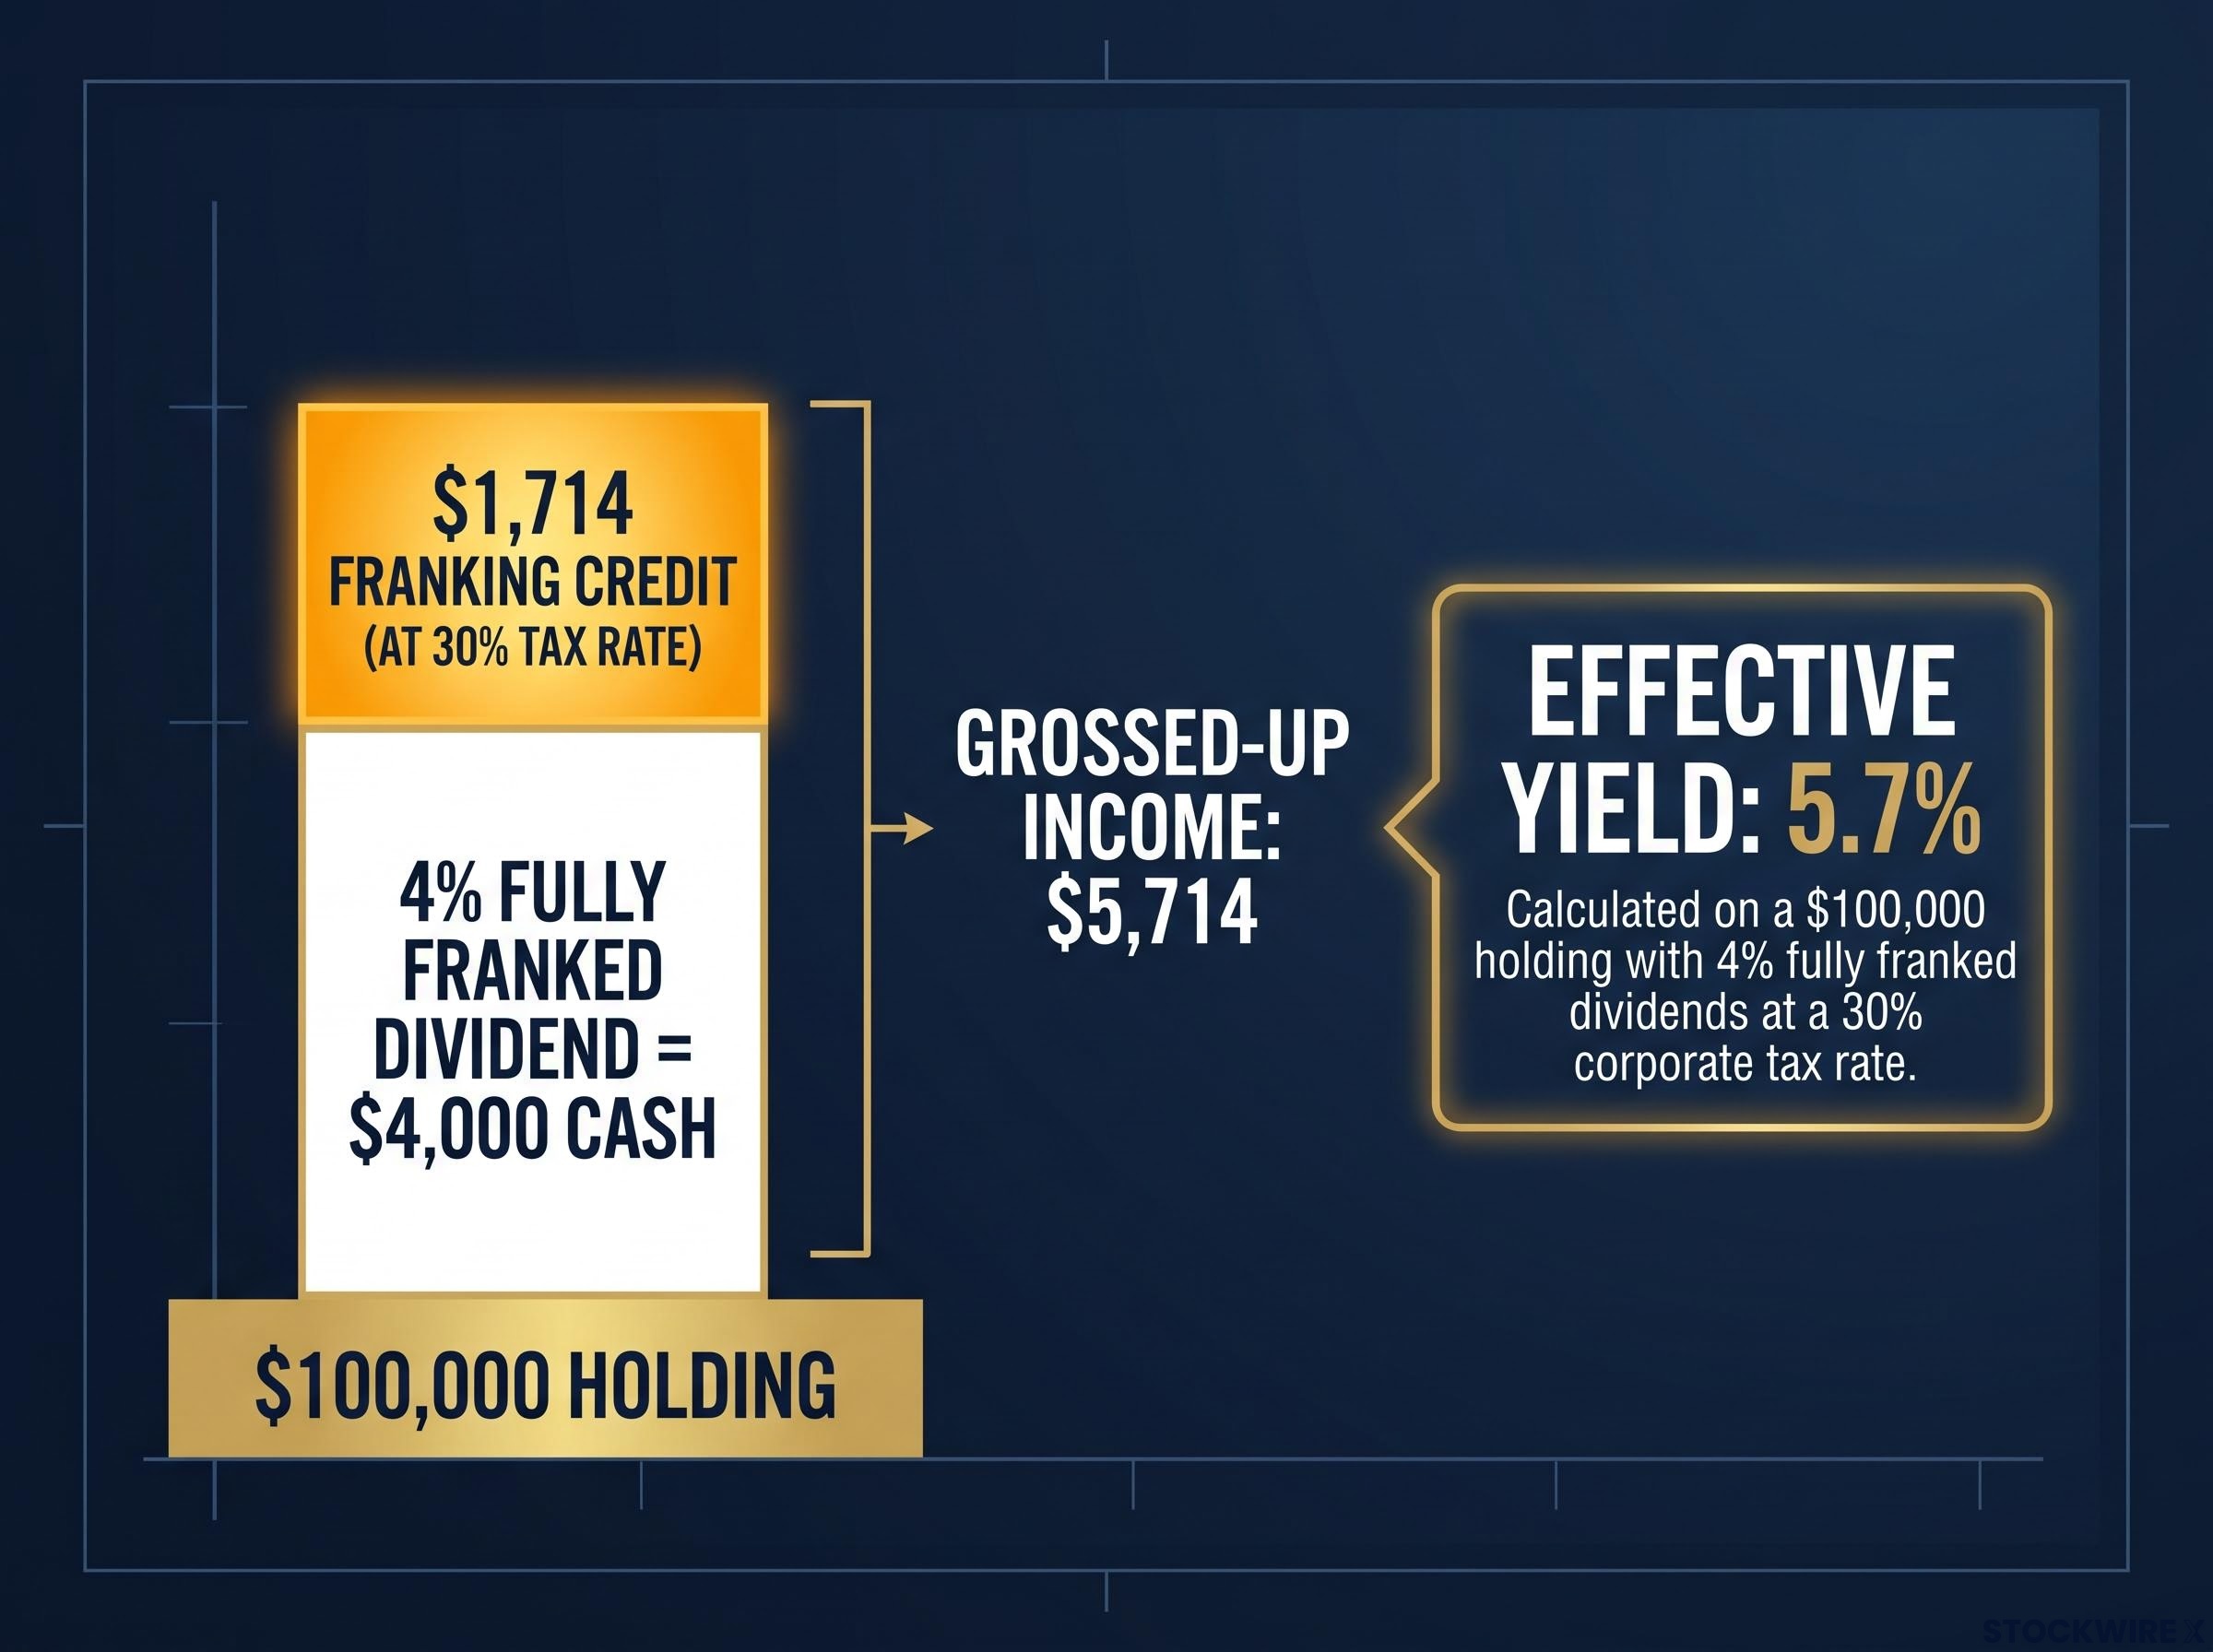
Here is what that looks like in practice. A 4% fully franked dividend on a $100,000 holding pays you $4,000 in cash. The attached franking credit is approximately $1,714 (calculated at the 30% corporate tax rate). Your grossed-up income is $5,714. If you are in pension phase with a zero tax rate, you receive the full $1,714 credit as a cash refund from the Australian Taxation Office, lifting your effective yield from 4% to approximately 5.7%. An unfranked 4% yield delivers $4,000 and nothing more.
Each structure interacts with franking differently:
- LICs are Australian companies that pay tax on their profits in Australia, which means franking credits accumulate at the LIC level and can be distributed to investors. This applies even when the LIC’s portfolio holds international assets, making a LIC the only structure through which offshore investment returns can carry Australian franking credits to the investor.
- ETFs pass through the franking attached to dividends from underlying companies. They do not generate additional franking at the trust level. International ETFs generally cannot pass through Australian franking credits because the underlying companies do not pay Australian tax.
- Direct shares offer the most transparent franking profile. You see exactly which companies are generating credits and at what level, and you can tilt your portfolio toward fully franked payers deliberately.
For retirees in pension phase, or for low-tax investors and SMSF members, the effective yield difference between franked and unfranked income is not marginal. It is structural. A retiree holding a fully franked LIC dividend is effectively receiving a government transfer on top of the corporate distribution.
The grossed-up yield advantage for SMSF members in pension phase is not a rounding error: a 6% fully franked yield can equate to approximately 8.5% in after-tax equivalent terms, a gap that compounds meaningfully over a multi-decade retirement.
This article is for informational purposes only and should not be considered financial advice. Investors should conduct their own research and consult with financial professionals before making investment decisions.
Matching structure to investor profile: a decision framework for Australian income investors
You have the mechanics. Now you need the map from your personal situation to a starting point. Four factors drive the structure decision, and the one that binds hardest for you effectively answers the question.
| Personal Factor | Low Complexity Preference | Tax-Priority Preference | Income-Stability Preference |
|---|---|---|---|
| Income volatility tolerance | Dividend ETFs (accept variable distributions) | Direct shares (match realisations to tax years) | LICs (smoothed, reserve-backed dividends) |
| Tax situation | Broad ETFs (minimal active decisions) | Direct shares (full capital gains control) | LICs (franking on Australian and international exposure) |
| Available time | ETFs (rules-based, set-and-monitor) | Direct shares (ongoing research required) | LICs (delegate to manager, monitor NTA) |
| Comfort with manager risk | ETFs (no discretionary manager) | Direct shares (you are the manager) | LICs (accept manager dependency) |
The single-structure choice is less common among experienced income investors than the blended approach. That is rational rather than indecisive, because each structure addresses different needs:
- Core direct share portfolio of 8-15 high-quality, dividend-paying ASX companies for maximum control, franking, and tax flexibility
- One or more Australian equity LICs for smoothed, fully franked income and long-term reserves, especially valuable in retirement
- Targeted ETFs where broader diversification is desired and your individual stock-picking edge is weaker, accepting more variable distributions as the trade-off
If you finish this section with a clear answer about which of the four personal factors is most binding for your situation, you have effectively answered the structure question. Each factor maps to a dominant vehicle preference.
For investors wanting to connect portfolio structure to a specific retirement income number, our dedicated guide to dividend income capital targets shows how franking credits reduce the capital required to meet the ASFA comfortable retirement benchmark, with worked examples across different tax structures.
Choosing the right vehicle is the beginning, not the end
No single structure is optimal across all investor situations. The framework above equips you to identify your own binding constraint and match it to the vehicle, or blend of vehicles, that fits.
Once that first-order decision is made, the second-order question becomes substantially more tractable. Which specific LICs, ETFs, or individual companies belong in your portfolio is a narrower, more manageable problem when you already know what structural features you need.
Your circumstances will change. Entering retirement, transitioning to pension phase, growing your portfolio past a fee threshold: each of these shifts the optimal structure or blend. Revisiting the framework periodically is not indecision. It is part of the process.
Past performance does not guarantee future results. Financial projections are subject to market conditions and various risk factors.