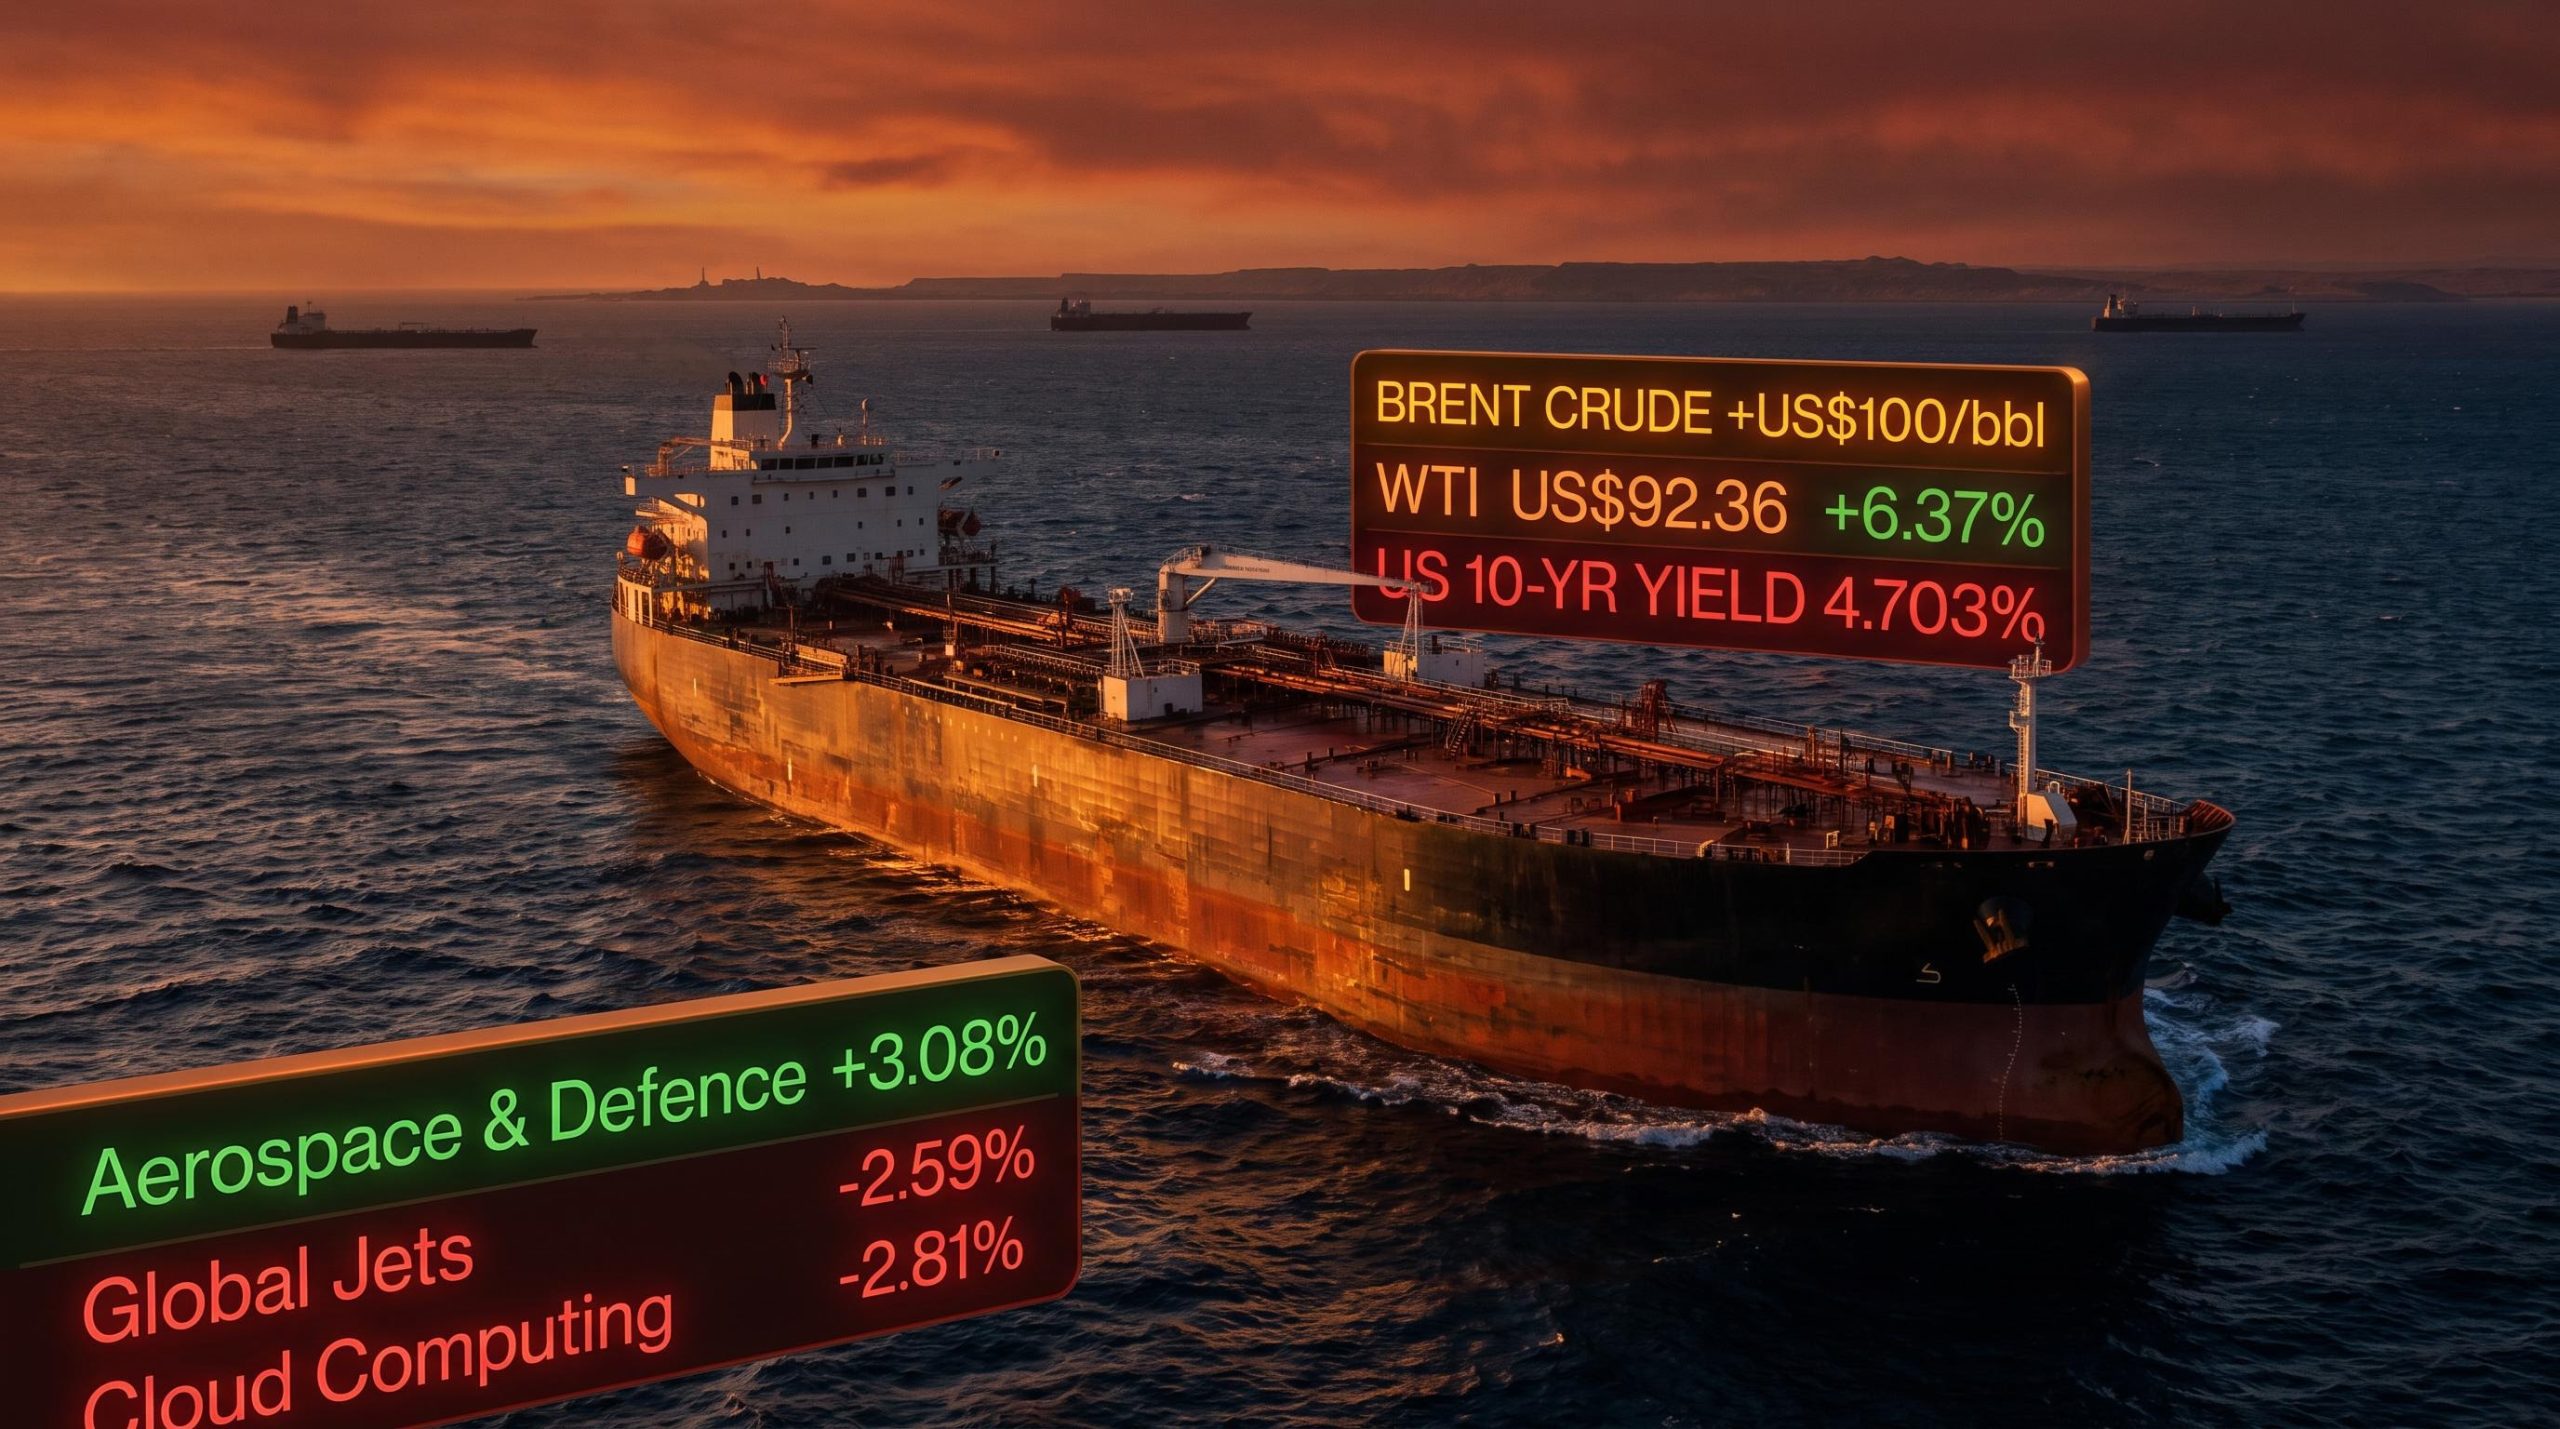
On 24 July 2026, oil prices surged past US$100 per barrel for the first time in roughly two months, as Houthi attacks on Saudi tankers in the Red Sea combined with President Trump’s threats of military retaliation against Iran to send crude sharply higher. The price move was sharp. What followed was sharper.
Sovereign bond markets pushed US 10-year Treasury yields to their highest reading of the year. The European Central Bank (ECB) put September on the table for a potential rate hike. Defence stocks surged while aviation and technology sold off hard. This is not a slow-moving macro shift; it is an event-driven repricing happening across asset classes simultaneously, driven by a geopolitical trigger that may or may not resolve quickly.
For anyone tracking fixed income, energy positioning, or central bank timelines, the next few weeks in the Red Sea carry more weight than any scheduled data release. Here is what the oil move is actually doing to rates, inflation, and positioning right now, and which variables will determine whether this is a temporary spike or the start of a second inflation chapter.
What pushed Brent above US$100 overnight
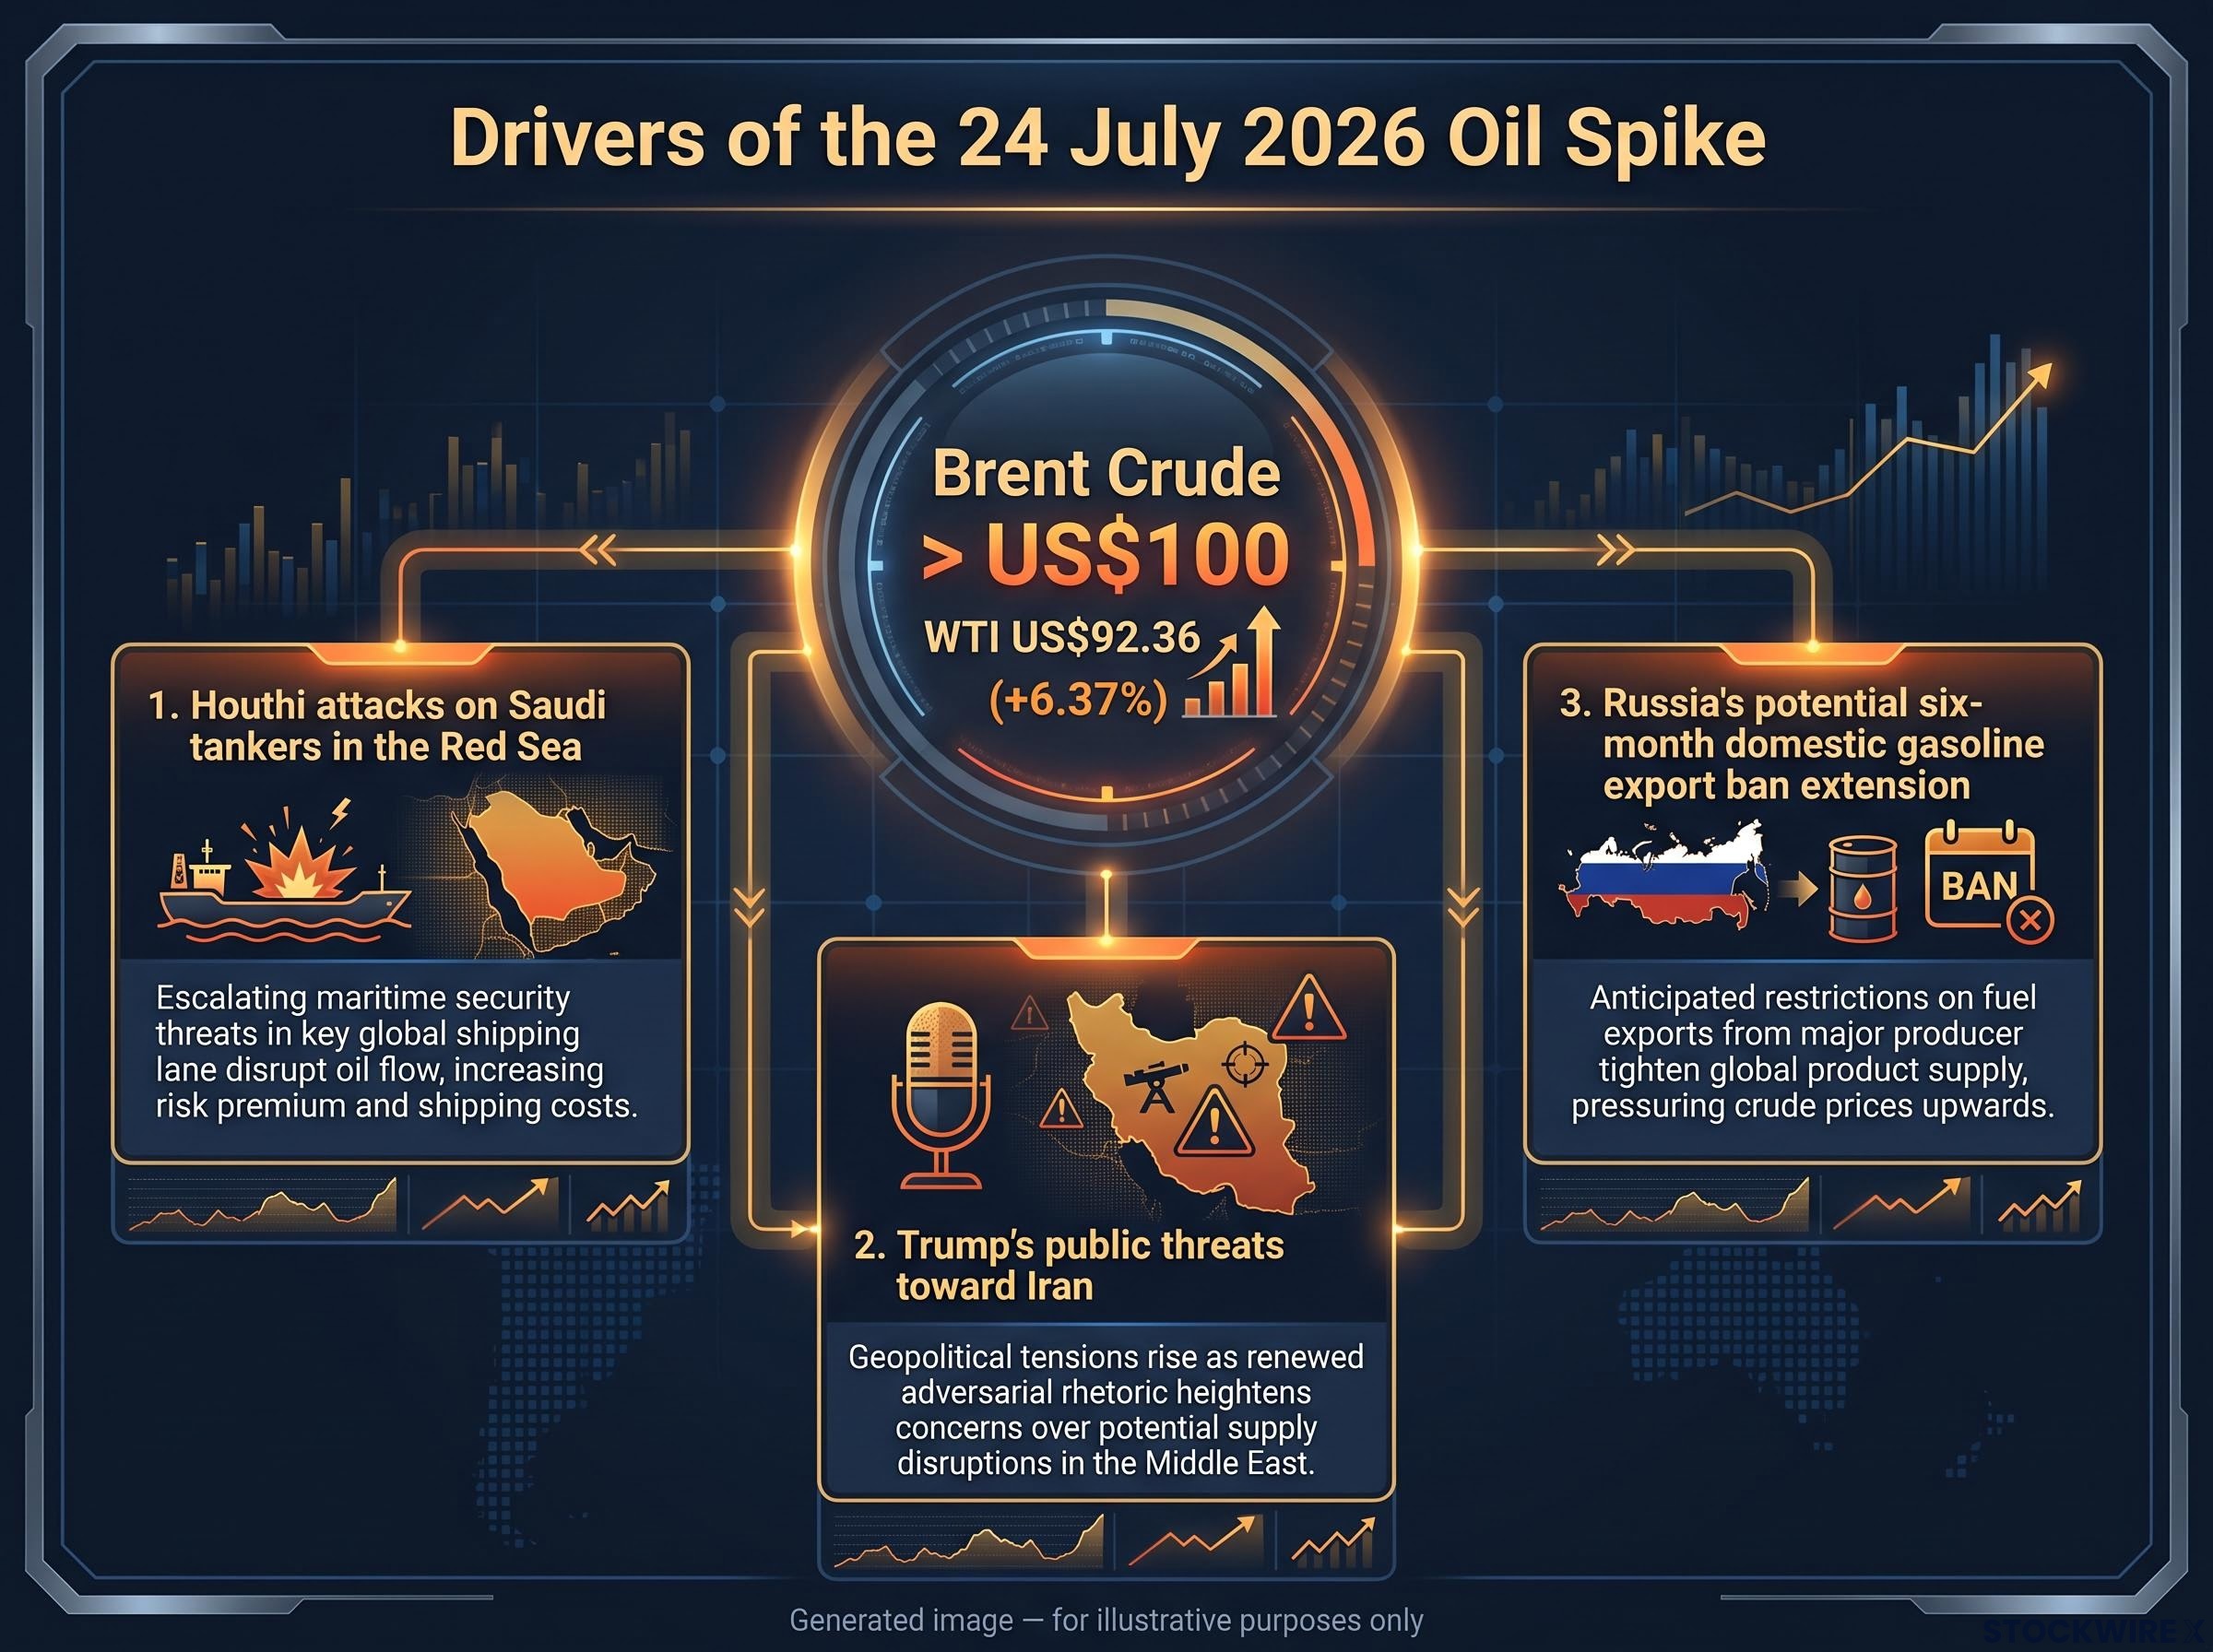
The sequence matters. Attacks by Houthi forces on a pair of Saudi tankers in the Red Sea sent Brent crude surging past US$100 per barrel in a matter of hours. WTI climbed in parallel, settling at US$92.36, representing a 6.37% advance on the day. That alone was enough to rattle energy markets. Then President Trump escalated.
According to reporting from CNBC and Axios, Trump threatened consequences for both Iran and the Houthis, and indicated he was weighing a full resumption of major military operations against Iran, though no decision had been finalised at the time of publication. The combination of a physical attack on tankers and an active military threat from a sitting US president pushed the price move well beyond what the initial strike would have justified alone.
Three supply-side inputs drove the session:
- Houthi attacks targeting a pair of Saudi tankers in the Red Sea, which served as the immediate catalyst for the crude price surge
- Trump’s public threats toward Iran, with reported deliberations over restarting large-scale combat operations adding a substantial escalation premium to prices
- Russia’s potential six-month extension of its domestic gasoline export ban, adding a separate supply constraint to an already tight market
Three very large crude carriers (VLCCs) were observed passing through the Strait of Hormuz as tensions rose, a detail that brought the chokepoint risk into sharp focus. This is not a one-variable story. The complexity itself is part of why markets moved as violently as they did.
The VLCC daily hire rate, which tracked approximately $110,000 per day during the peak May 2026 disruption, is one of the physical market signals that the Hormuz risk premium does not simply dissolve when diplomatic language softens, a dynamic the IEA has projected will decompress slowly over months rather than weeks.
When big ASX news breaks, our subscribers know first
How a US$100 oil shock feeds through to inflation
Headline inflation: the direct channel
Energy sits inside every major Consumer Price Index (CPI) basket, the measure central banks use to track the cost of living. Motor fuel, heating oil, and electricity are direct line items. When crude prices rise and stay elevated, those components reprice within weeks.
A large, sustained oil move typically adds several tenths of a percentage point to headline inflation in advanced economies, with the peak impact arriving within 3-6 months. If Brent holds above US$100, petrol prices rise, transport costs climb, and the headline inflation number central banks report each month moves higher mechanically.
According to futures pricing, the market currently expects crude to pull back to around US$86 per barrel by December 2026, reflecting a collective view that the current spike will prove temporary rather than the start of a sustained structural move higher.
Core inflation: the slower, stickier risk
The more dangerous transmission runs through core inflation, which strips out food and energy to capture underlying price pressure. This channel moves slower, but it is what keeps central bankers awake.
Higher transport and logistics costs push up goods prices across supply chains. Firms facing sustained energy-driven cost pressure attempt to rebuild margins by raising prices on non-energy goods and services. If workers then demand compensation for higher living costs, wage-price dynamics can keep core inflation elevated long after the original oil shock fades.
IMF research on oil price second-round effects documents how sustained energy cost pressure feeds into wage demands and non-energy goods pricing in advanced economies, a transmission mechanism that takes quarters to fully manifest but is considerably harder to reverse than the original commodity shock.
The policy-relevant question is not where oil is today but how long it stays elevated and whether it forces pass-through into non-energy prices. If the disinflation narrative built on falling energy prices unravels, and if repeated energy shocks begin to unanchor household inflation expectations, the inflation picture for 2026 looks materially different from what central banks projected entering the year.
Analyst estimates from the May 2026 cycle suggested 40-60% of an oil price increase feeds into oil pass-through into core CPI over a 3-6 month window, which is precisely why the June and July data prints carry more policy weight for the Fed than the initial crude price reading itself.
Why the ECB and the Fed are reading this very differently
At its July 2026 meeting, the ECB voted unanimously to keep its deposit rate steady at 2.25%. That was expected. Less routine was the message from ECB President Christine Lagarde, who made clear that the September meeting could result in a rate increase, with the decision hinging on how conflict-related energy pressures feed into the inflation outlook. That language represents a concrete shift in ECB communication that investors in European fixed income or EUR-denominated assets cannot treat as standard forward guidance.
Europe’s deeper structural dependence on oil and gas imports makes the trade-off starker. An energy shock simultaneously pushes up inflation and weighs on growth, a combination that forces the ECB into a more uncomfortable position than the Federal Reserve faces.
The Fed has not publicly moved to a hike posture. Its exposure runs along three channels: near-term headline CPI pressure, the risk of inflation expectations drifting higher, and the growth drag from energy acting as a consumer tax. The Fed’s current communication is more cautious than the bond market’s repricing implies, but the gap between what the Fed is saying and what yields are doing tells its own story.
| Institution | Current Rate | Policy Posture | September Catalyst |
|---|---|---|---|
| ECB | 2.25% | Hold, with September explicitly live for a hike | Iran-related inflation feed-through assessment |
| Fed | Unchanged (restrictive) | No public hike signal; cautious relative to bond market pricing | CPI data, inflation expectations, energy persistence |
The divergence creates positioning implications for currency, rates, and cross-market duration exposure. Two institutions are making different calculations from the same oil price.
Deutsche Bank projected 50 basis points of ECB hikes across summer 2026 even as euro area GDP growth was forecast at just 0.5%, a figure that illustrates why central bank divergence between Frankfurt and Washington carries direct implications for cross-regional duration exposure and currency positioning.
What the bond market is already pricing in
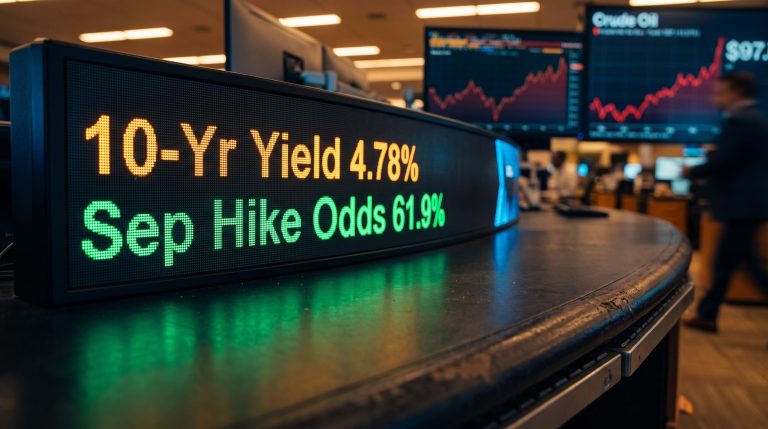
On 24 July 2026, the US 10-year Treasury yield closed at 4.703%, a rise of 0.99% on the session, marking its highest print of the year to date.
That number is not just a data point. It is a collective bet. Bond markets are not treating this as a temporary blip; they are demanding compensation for the possibility that the inflation plateau extends well into 2027.
Three components are driving the yield move:
- Higher near-term inflation pricing: markets expect energy costs to lift headline CPI over the next several months
- Delayed rate cut expectations: the timeline for Fed easing is being pushed further out, reinforcing “higher for longer”
- Rising term premium: investors are demanding additional yield for the uncertainty of holding long-dated bonds in a period where inflation surprises have consistently been to the upside
The dynamic is a bear-steepening of the yield curve, where long yields rise more than short yields as term premium and inflation risk are repriced into the far end of the curve. For anyone holding duration in a fixed income portfolio, this is the practical signal: long-dated bonds are more exposed to further upside inflation surprises, and the yield curve’s shape is telling you the market sees those surprises as plausible.
How equity markets rotated in response
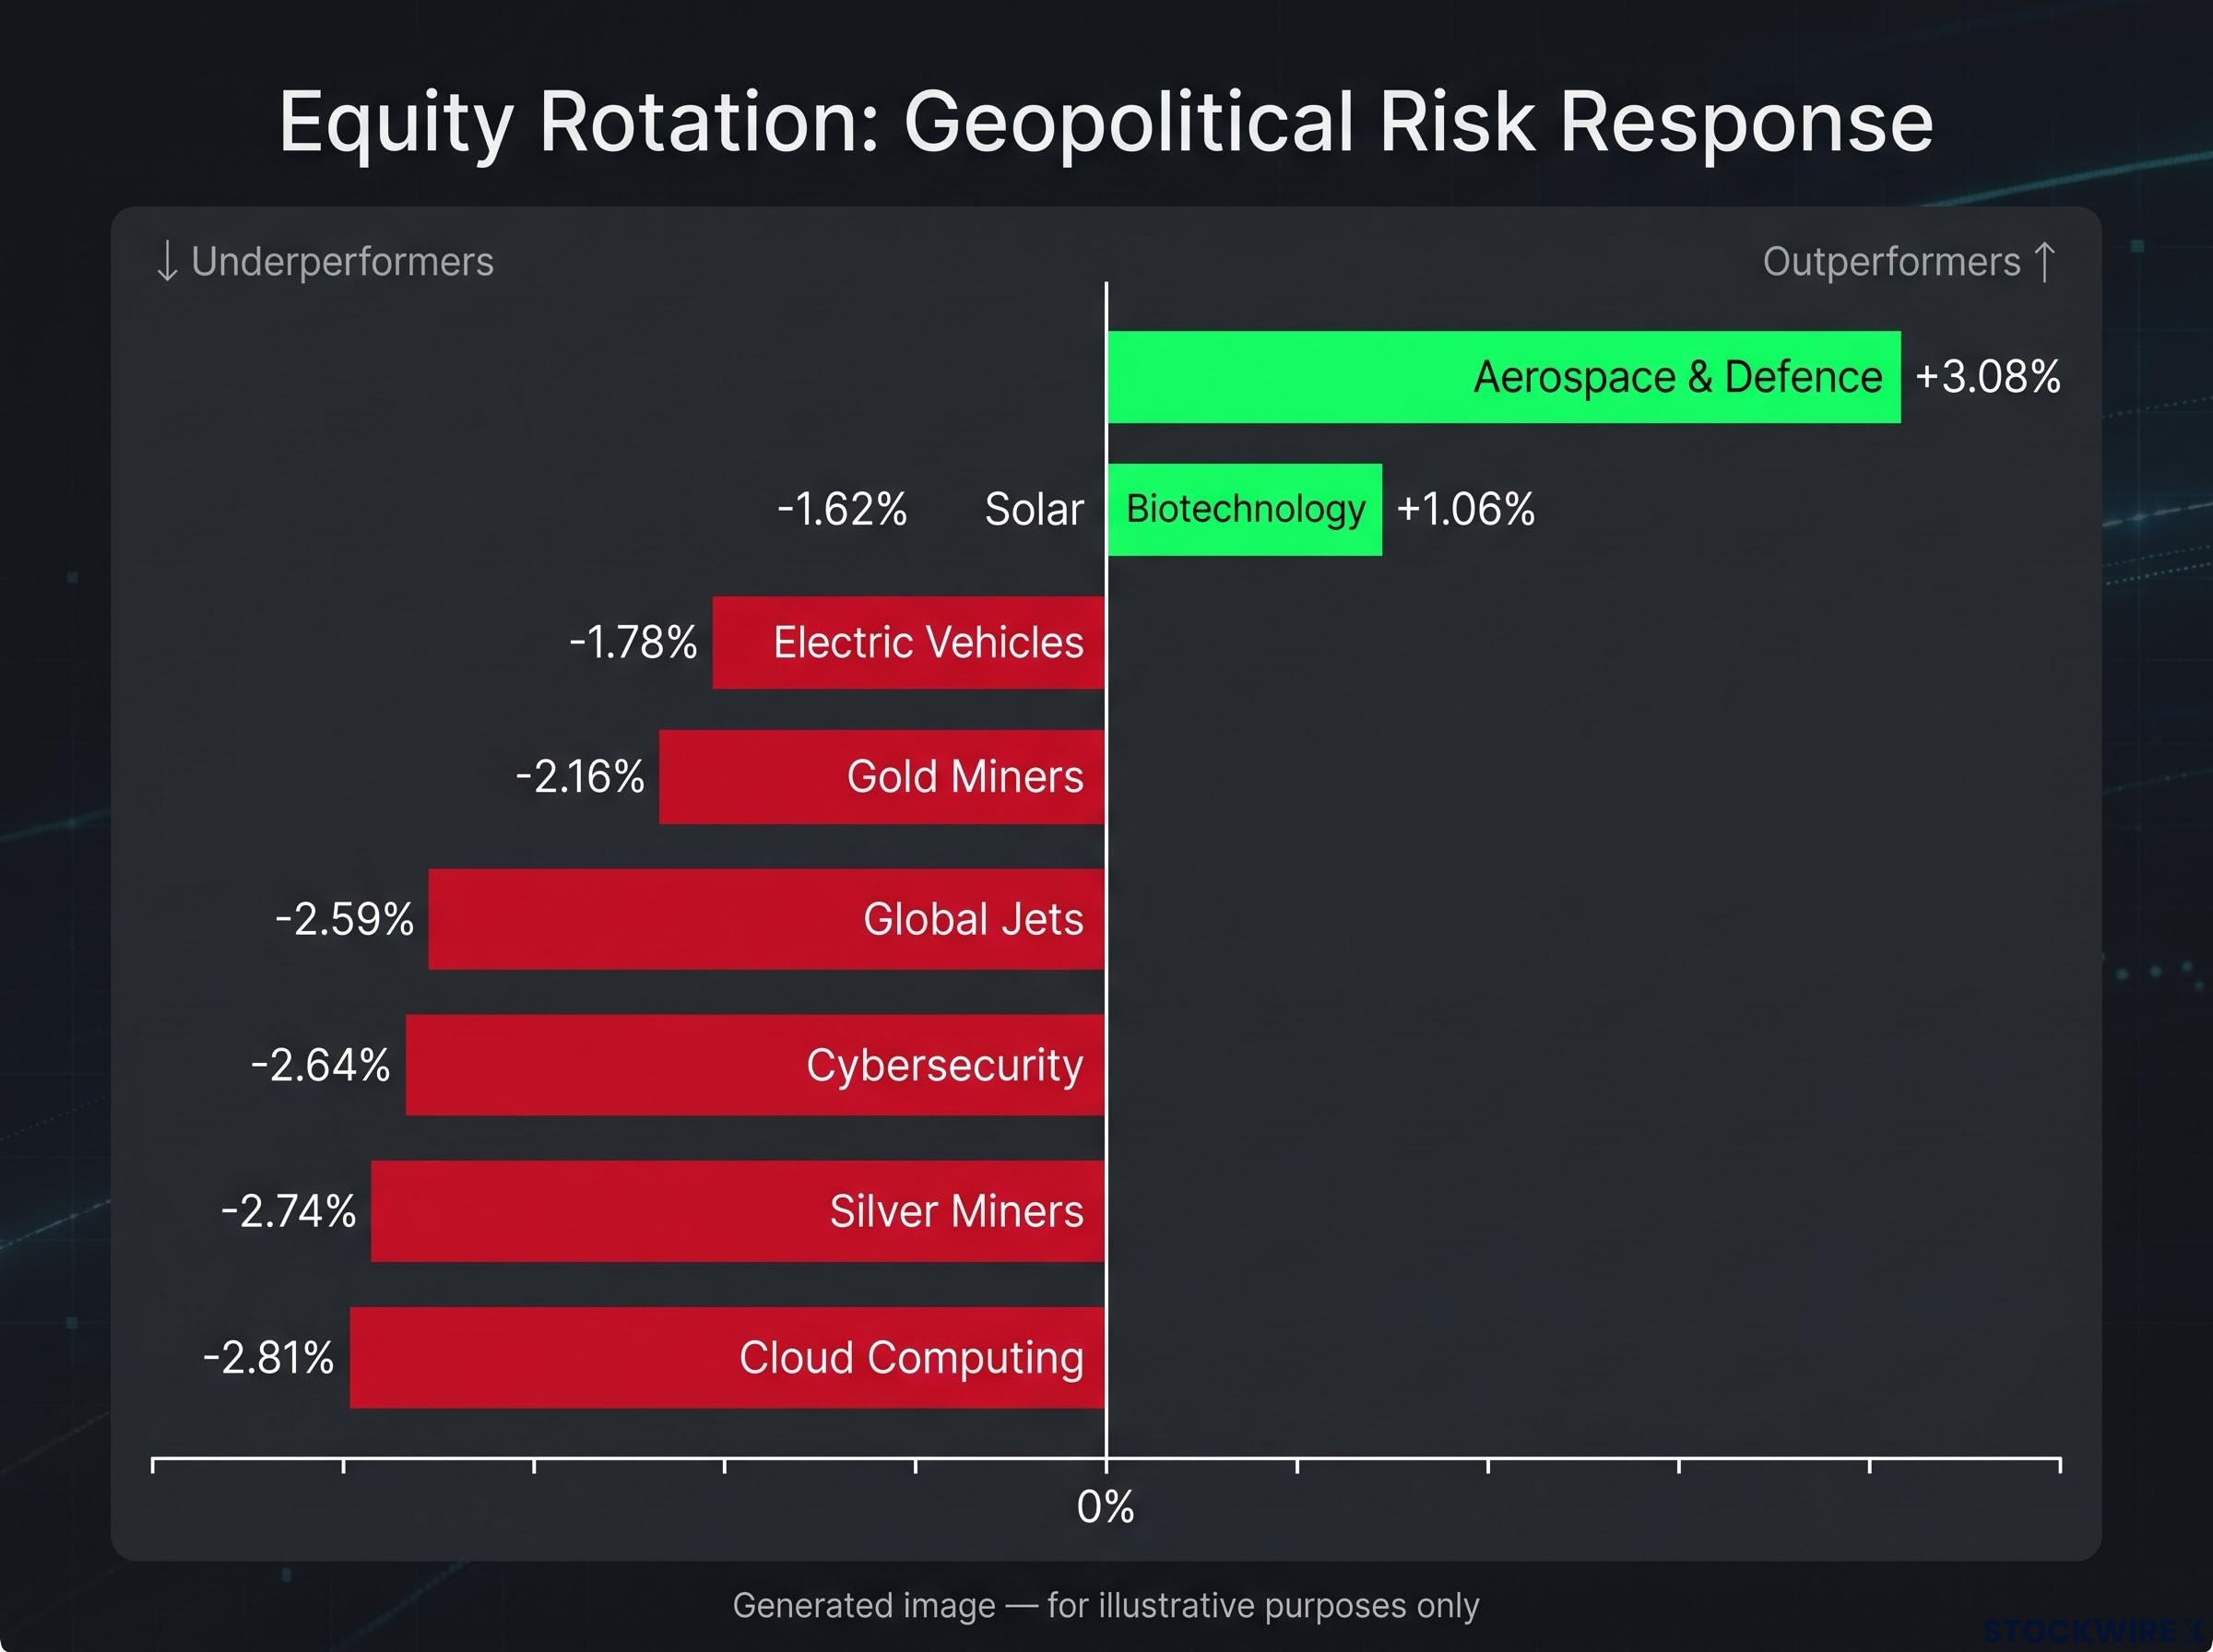
The session’s equity rotation followed a coherent logic. Defence stocks surged because the geopolitical risk is real and escalating. Aviation sold off because jet fuel is oil, and airlines cannot immediately reprice tickets. Technology and clean energy declined because higher yields compress the valuations of long-duration growth equities.
| ETF Sector | Category | Session Move (%) | Closing Price |
|---|---|---|---|
| Aerospace & Defence | Outperformer | +3.08% | 238.23 |
| Biotechnology | Outperformer | +1.06% | 188.98 |
| Global Jets | Underperformer | -2.59% | 29.32 |
| Cloud Computing | Underperformer | -2.81% | 22.52 |
| Cybersecurity | Underperformer | -2.64% | 37.25 |
| Solar | Underperformer | -1.62% | 52.85 |
| Electric Vehicles | Underperformer | -1.78% | 34.34 |
| Gold Miners | Underperformer | -2.16% | 75.02 |
| Silver Miners | Underperformer | -2.74% | 75.28 |
The simultaneous decline in gold miners alongside the rise in pure-play defence names is the detail that sharpens the read. This is not a broad risk-off trade. A broad risk-off move would have sent gold higher, not lower. Instead, the market is running a specific geopolitical-risk rotation: it rewards direct escalation exposure and punishes rate-sensitive growth. If you hold sector ETFs, the question is whether these moves are one-session noise or the beginning of a durable reshuffling toward defence and energy at the expense of long-duration equity.
Energy’s 22% year-to-date gain against a Morningstar US Market Index return of just 0.93% through mid-2026 illustrates how geopolitical sector rotation has made sector selection, not market-level positioning, the dominant return driver across the current cycle.
The variables that will determine whether US$100 holds or fades
The gap between spot and futures is the single most important signal framing the forward view.
Brent sits above US$100 today. Forward contracts for December 2026 imply a price of around US$86 per barrel, indicating the market is betting on de-escalation. If the observable signals do not support that thesis, the futures curve reprices upward and every asset class covered above re-enters a more volatile regime.
Four variables will determine which scenario unfolds:
- Strait of Hormuz escalation. If attacks remain confined to the Red Sea, disruption is manageable. If the Strait of Hormuz is threatened, the supply shock is of a materially different order; the strait carries a significant share of global seaborne oil exports.
- OECD inventory data. Drawdowns in oil stocks and floating storage will signal whether the physical market is tightening beyond what a few days of disruption would explain.
- CPI fuel components. The next two to three inflation prints, particularly fuel and transport costs, will show whether headline CPI is absorbing the shock or passing it through.
- ECB and Fed communication. Lagarde has already flagged September as a decision point. Any shift in Fed language toward acknowledging persistent inflation risk would confirm the bond market’s “higher for longer” bet.
IEA Strait of Hormuz transit data puts average daily flows at approximately 20 million barrels in 2025, representing around 25% of global seaborne oil trade, a concentration that explains why any credible threat to the strait produces a supply shock of a fundamentally different scale than Red Sea disruptions alone.
A decision by Trump to move from warnings to active military engagement against Iran would represent a step-change escalation that futures markets are not currently pricing.
What the spot-to-futures gap tells investors right now
Three markets are telling the same story from different angles. The ECB is openly considering a rate hike. The 10-year Treasury yield at 4.703% is pricing “higher for longer” into duration and term premium. The equity rotation is punishing rate-sensitive growth and rewarding direct escalation exposure.
For spot crude to retrace toward US$86 by December, as futures currently imply, three conditions must remain intact: the Strait of Hormuz stays open, Trump stops short of active military engagement against Iran, and energy cost pressures fail to pass through into core CPI across the next two to three data cycles. If even one of those conditions fails, the gap between spot and December futures closes upward rather than downward, and the central bank timelines mapped above shift materially toward further tightening.
Readers who understand those three conditions are better positioned to act on the data as it arrives than those tracking the oil price in isolation. The ECB September meeting, the next CPI prints, and the military trajectory in the Red Sea are the three inputs that will determine whether this week’s repricing was an overreaction or the opening chapter of a second inflation problem.
This article is for informational purposes only and should not be considered financial advice. Investors should conduct their own research and consult with financial professionals before making investment decisions. These statements are speculative and subject to change based on market developments and geopolitical conditions.